
KT RSI Power Zones Indicator
MT4/MT5 [Free Download]
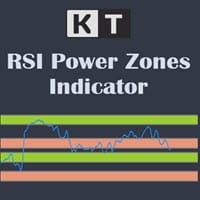

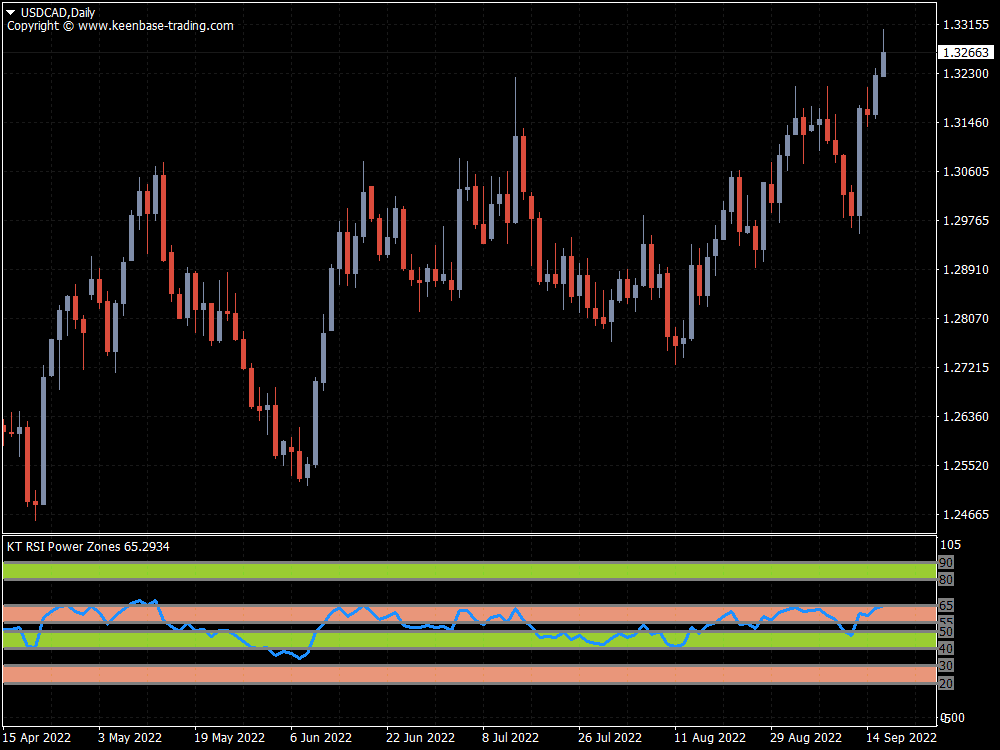
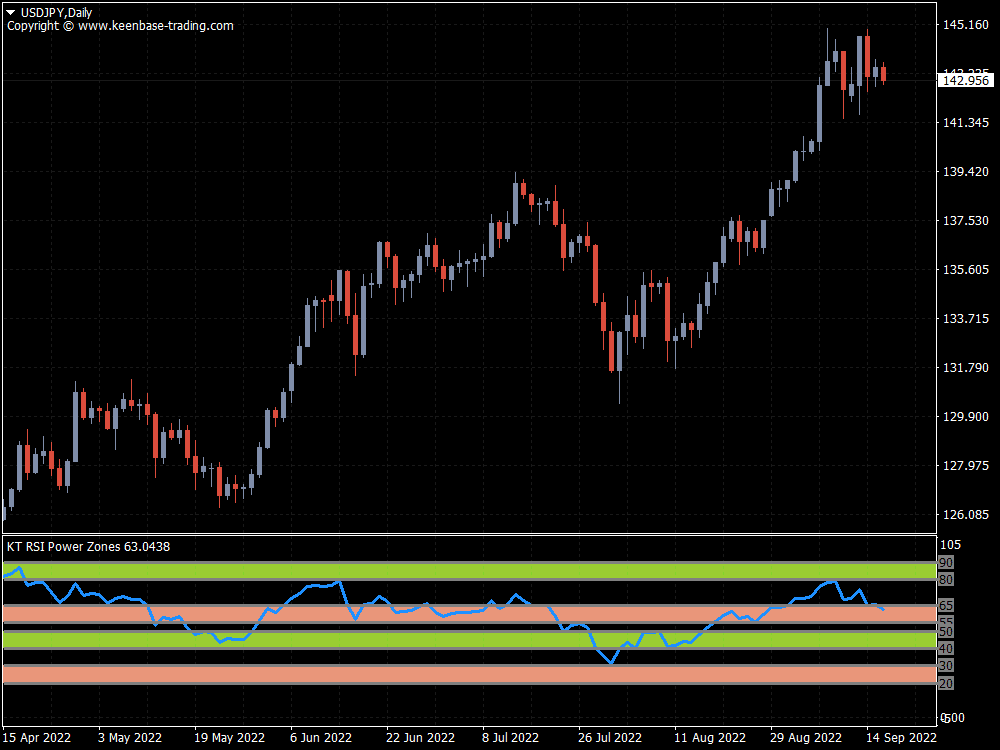
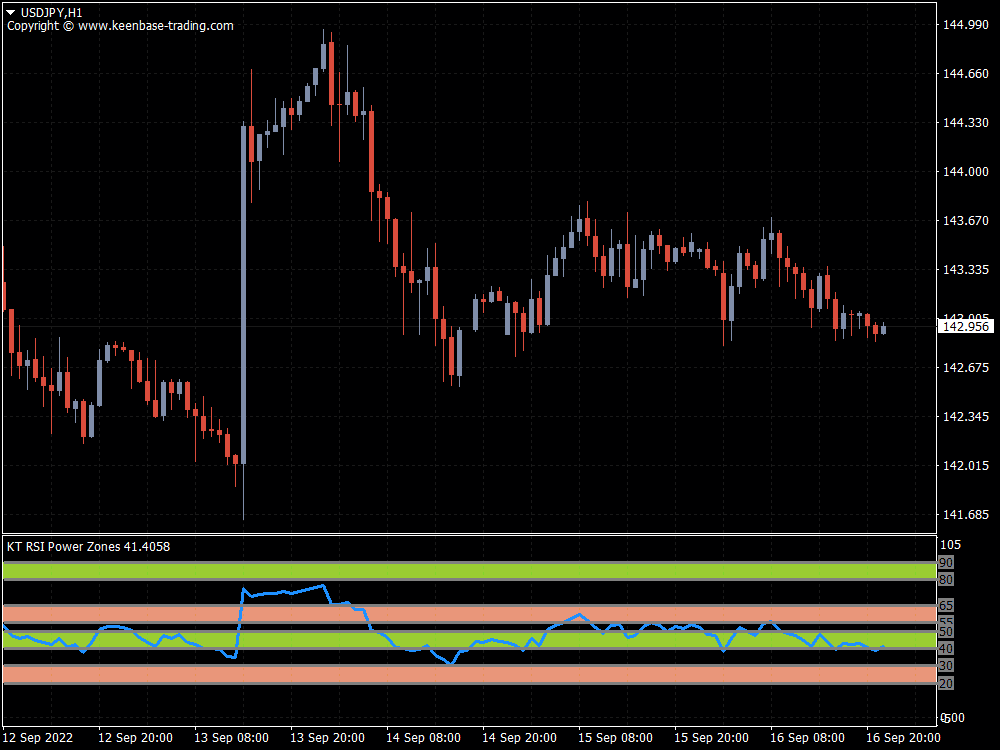
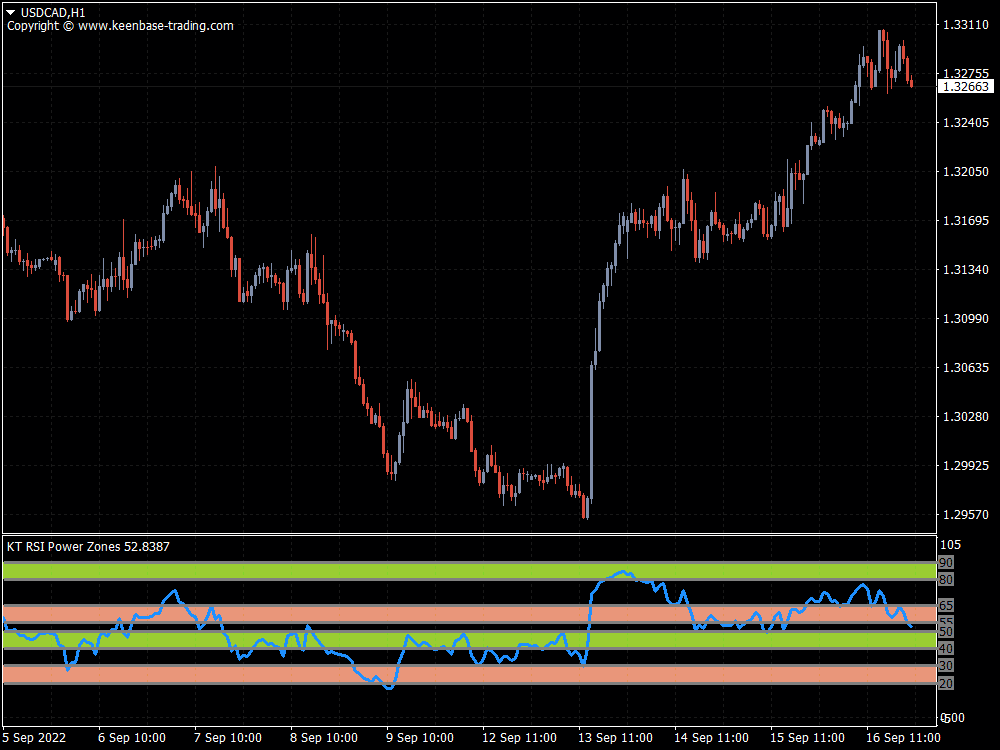
The KT RSI Power Zones indicator divides and shows the movement of RSI into four different power zones to identify the potential support and resistance zones using the RSI.
Bull Support
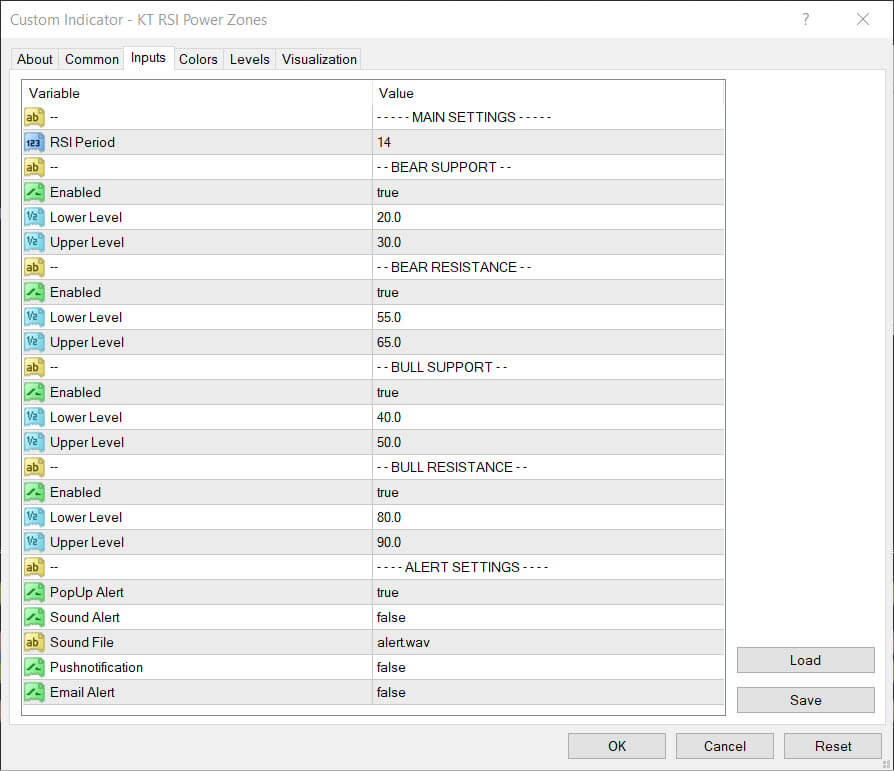
The bull support ranges from 40 to 50. The price is expected to reverse to the upside from this zone.
Bull Resistance
The bull resistance ranges from 80 to 90. The price is expected to reverse to the downsize from this zone.
Bear Support
The bear support ranges from 20 to 30. The price is expected to reverse to the upside from this zone.
Bear Resistance
The bear resistance ranges from 55 to 65. The price is expected to reverse to the downside from this zone.
Read More
Screenshots
You Might Also Like

















Help others make better choices. Please review your recent purchase.
By sharing your review, you will help others to make advised decision about what they buy from us. Thanks for contributing.
You must log in to submit a review.