What the KT Trend Trading Suite Actually Does
KT Trend Trading Suite is a trend-following indicator for MetaTrader 4 and MetaTrader 5. It combines an internal trend calculation with recent price breakouts, a pullback reset, chart entry boxes, a multi-timeframe dashboard and optional historical performance information.
It is designed to help you review trend direction and possible continuation entries on the chart. It does not open or manage trades. You remain responsible for entry confirmation, position size, stop placement and risk.
How the Buy and Sell Signals Are Created
The indicator evaluates completed candles. A possible buy signal requires price to close above the recent high defined by the Signals Period, while the internal trend calculation is bullish and price is above its bullish trend level. A possible sell signal uses the opposite conditions: price closes below the recent low, the internal trend calculation is bearish and price is below its bearish trend level.
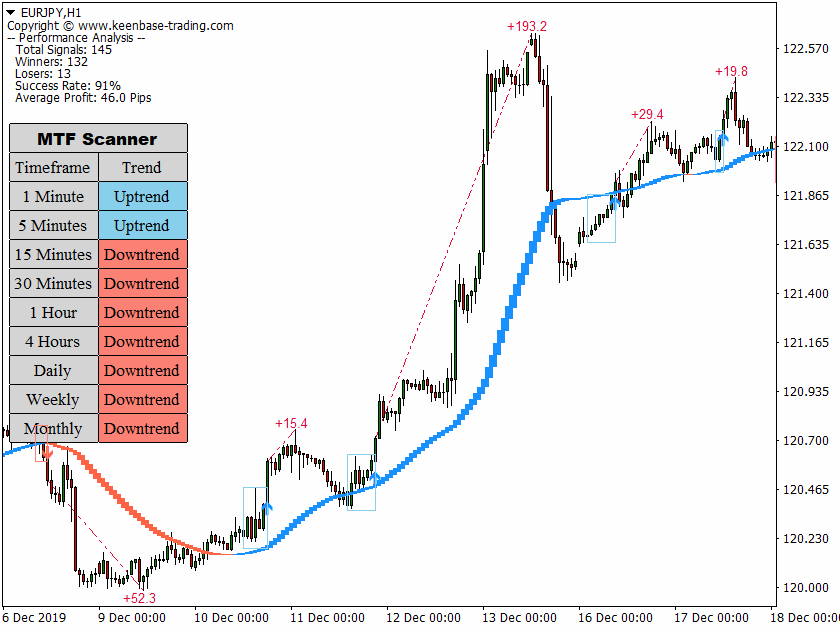
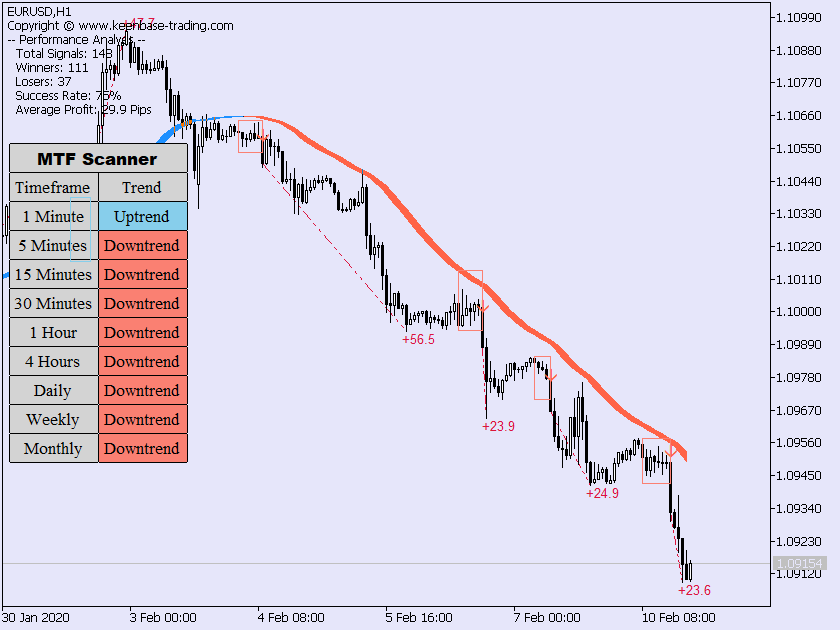
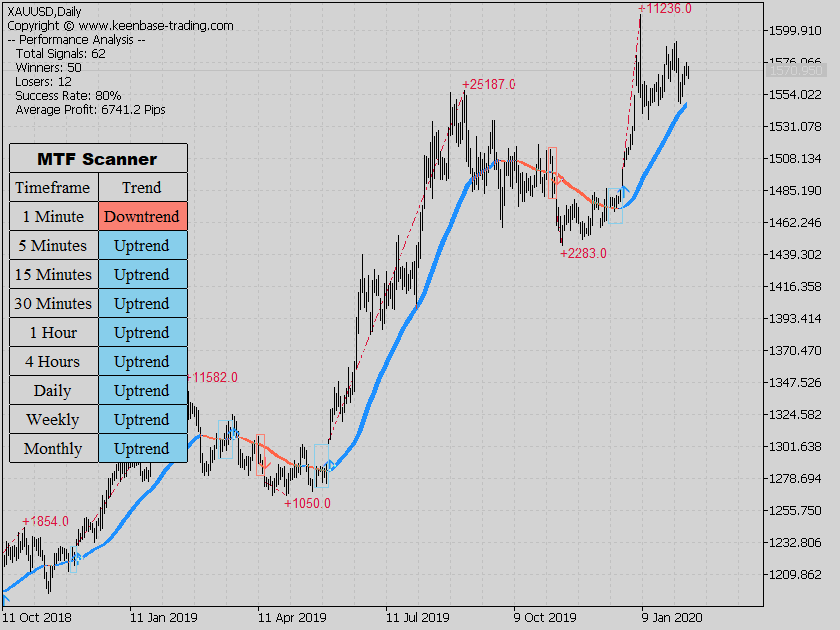
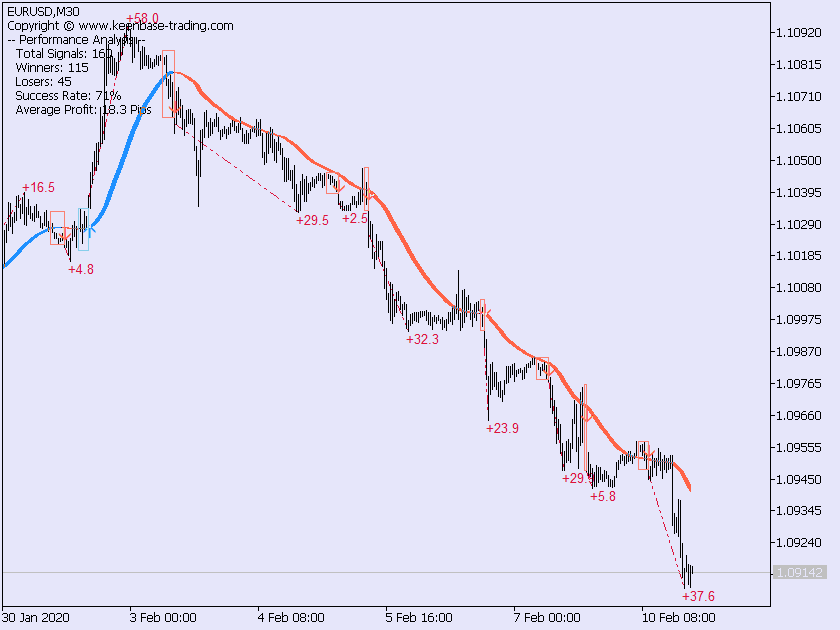
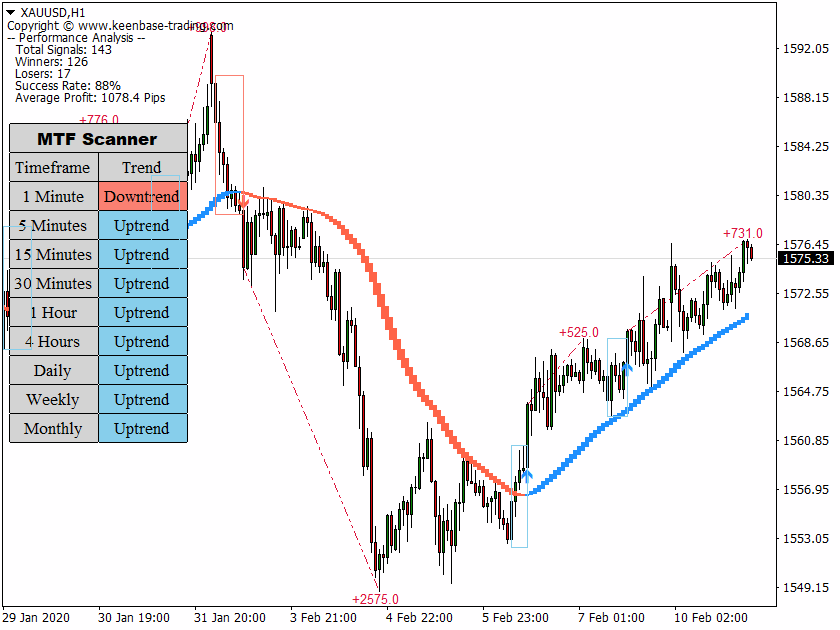
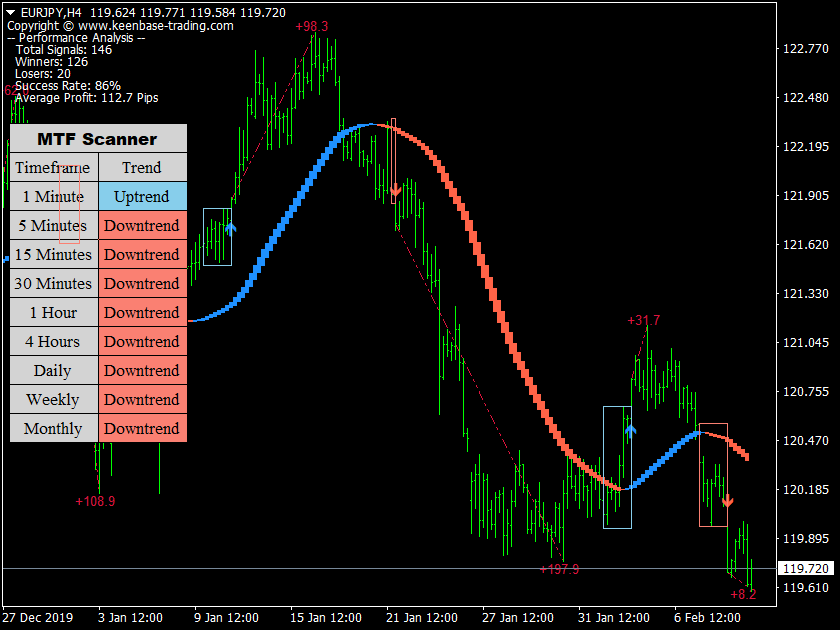
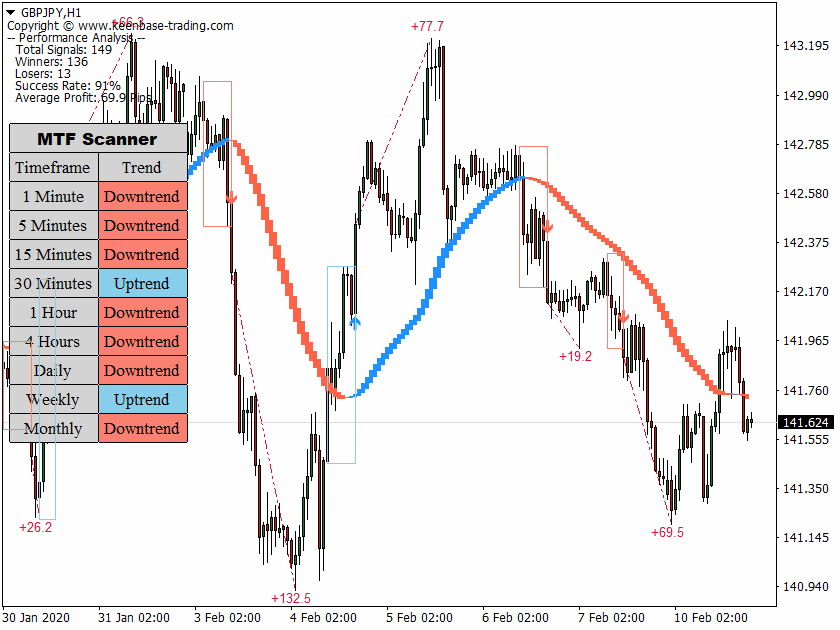
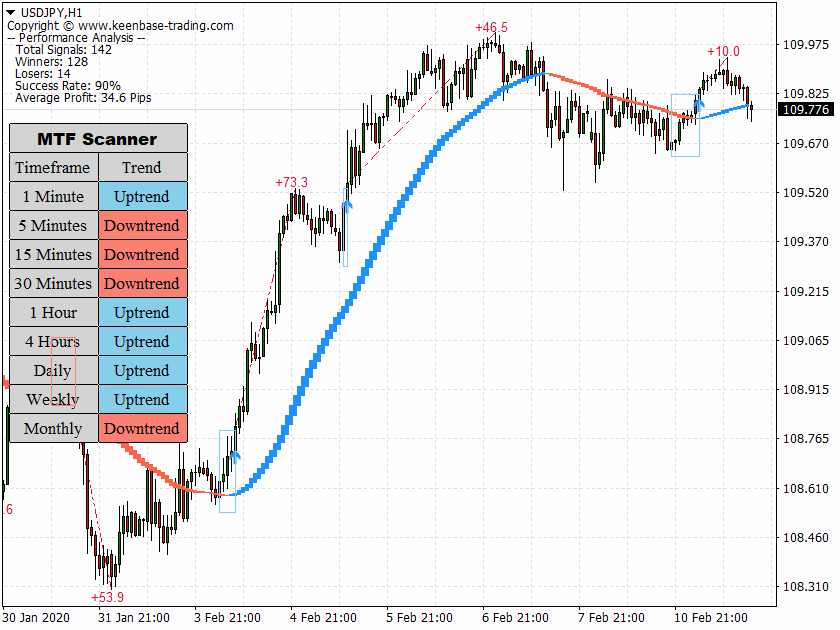
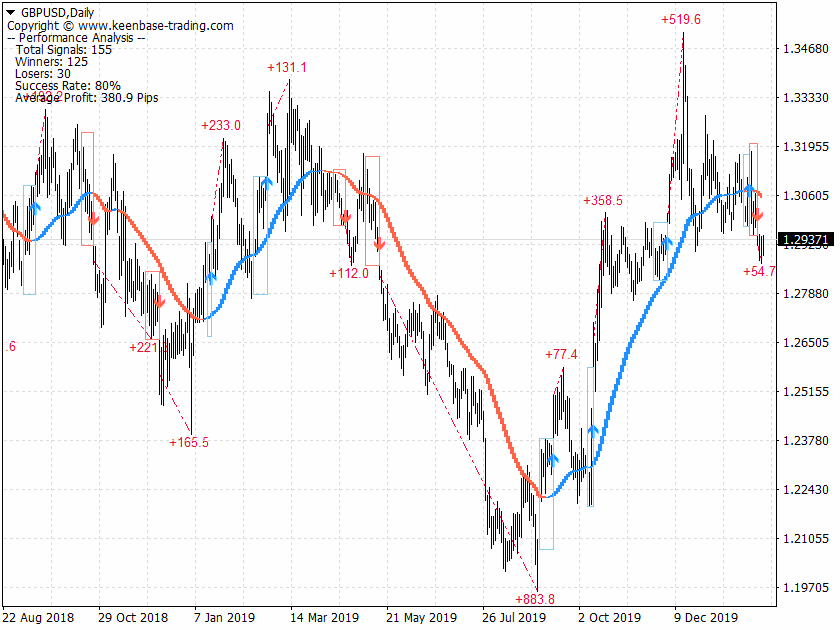
When those conditions agree, the indicator places a signal marker and draws a coloured rectangle from recent local price structure to the breakout level. The box is a visual reference for the setup area, not a guaranteed entry price or profit target.
The Pullback Depth controls when the indicator becomes eligible to identify another continuation signal. This helps prevent every candle in the same move from being treated as a new setup.
How to Read the Chart
- Bullish box and marker: price has broken a recent high while the internal trend conditions are bullish.
- Bearish box and marker: price has broken a recent low while the internal trend conditions are bearish.
- Multi-timeframe dashboard: shows the indicator's current trend state across the available MetaTrader timeframes.
- Performance Analysis: summarises historical signals on the loaded chart and can display total signals, winners, losers, success rate and average favourable movement.
- Profit trend lines: show the favourable movement measured after historical signals when Performance Analysis is enabled.
The performance display is descriptive chart history. It is not a backtest of trading costs, execution, stop-loss rules or future profitability.
MT4 and MT5 Setup
- Open the symbol and timeframe you want to analyse in MetaTrader 4 or MetaTrader 5.
- Attach KT Trend Trading Suite from the Navigator and enter your licence key when required.
- Start with the default Signals Period, Pullback Depth and Trend Period so you have a consistent baseline.
- Choose whether to show the multi-timeframe dashboard, text statistics and performance lines.
- Enable only the alert channels you want to receive.
- Review completed candles on a demo chart before using the indicator in a live trading decision.
Use the same settings when comparing results across symbols or timeframes. Changing several inputs at once makes it difficult to understand which change affected the signals.
Main Input Settings
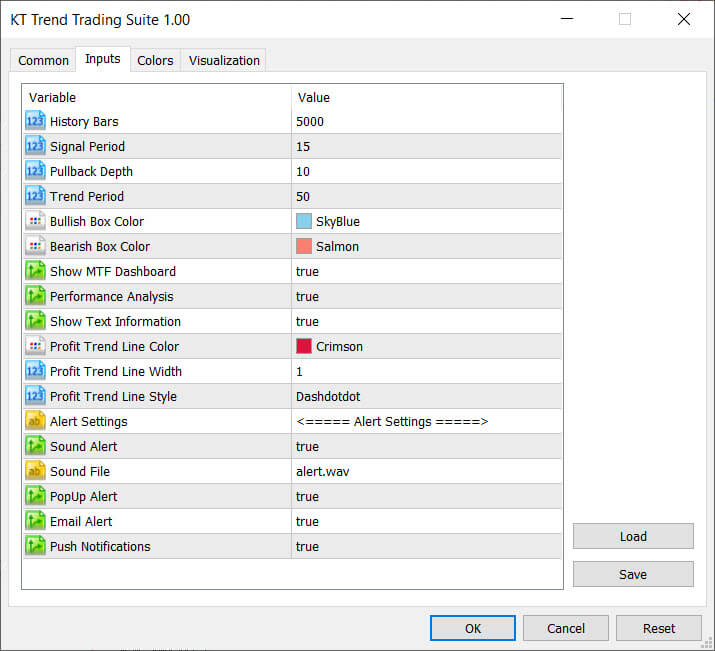
- History Bars: limits how many historical candles are processed and displayed. The installed build defaults to 5,000 bars.
- Signals Period: sets the recent-high and recent-low lookback used for breakout signals. The installed build defaults to 15.
- Pullback Depth: controls the local pullback reference that resets eligibility for another signal. The installed build defaults to 10.
- Trend Period: controls the period used by the internal trend calculation. The installed build defaults to 50.
- Bullish and Bearish Box Color: changes the colours of the two setup boxes.
- Show MTF Dashboard: shows or hides the multi-timeframe trend panel.
- Performance Analysis: shows or hides the historical performance calculations and favourable-movement lines.
- Show Text Information: shows or hides the on-chart performance summary.
- Sound, Popup, Email and Push Alerts: control how a new closed-candle signal is delivered. Email and push alerts also require the corresponding MetaTrader options to be configured.
A Practical Validation Workflow
- Choose one liquid symbol and one timeframe.
- Keep the default settings for an initial sample.
- Review signals only after the candle has closed.
- Record the trend state, breakout level, box location and market conditions for each signal.
- Define your own entry, invalidation, stop and exit rules before measuring results.
- Include spread, commission and slippage in any separate strategy test.
- Test different market conditions before deciding whether the indicator fits your process.
A dashboard agreement across several timeframes can provide context, but it does not remove the need for a risk limit or an invalidation rule. Avoid treating a single marker as a complete trading system.
Trend Trading Suite or a Single Trend Indicator?
Choose a multi-feature suite when you want trend direction, breakout and pullback signals, chart zones, multi-timeframe context and historical statistics in one indicator. A single-purpose trend indicator may be a better fit when you want one calculation and prefer to build the rest of the process yourself.
This distinction helps prevent overlap with other Keenbase trend products. KT Trend Trading Suite is intended for traders who want several trend-continuation tools presented together, rather than one isolated trend line.
Important Limitations
- The indicator does not predict reversals or guarantee that a breakout will continue.
- It does not place trades, calculate position size, set a stop loss or set a take profit.
- Historical performance statistics do not prove how the same settings will perform in the future.
- Results can change with the symbol, timeframe, spread, volatility and chosen inputs.
- Signals should be validated with your own trading plan and risk controls.
Build a Repeatable Trend-Following Plan
For a broader framework covering trend context, entries, exits and risk, read the Trend Following Strategy guide. Use the guide to define the rules around the indicator rather than treating the indicator alone as a finished strategy.











 Useful Indicator
 Fascianting Indicator
 Very Promising