How the Pull Back Indicator Works
The indicator checks a three-bar RSI transition rather than calculating a separate Pullback Factor value. With the default settings, a green arrow can form after RSI moves below 30, recovers into the 30 to 45 range, and then turns lower while remaining at or above 30 on the next completed reading.
The red-arrow condition is the mirror image. RSI first moves above 70, falls into the 55 to 70 range, and then turns higher while remaining at or below 70. These conditions describe the programmed trigger; they do not prove that a pullback has ended or that the previous trend will continue.
Understanding the Green and Red Arrows
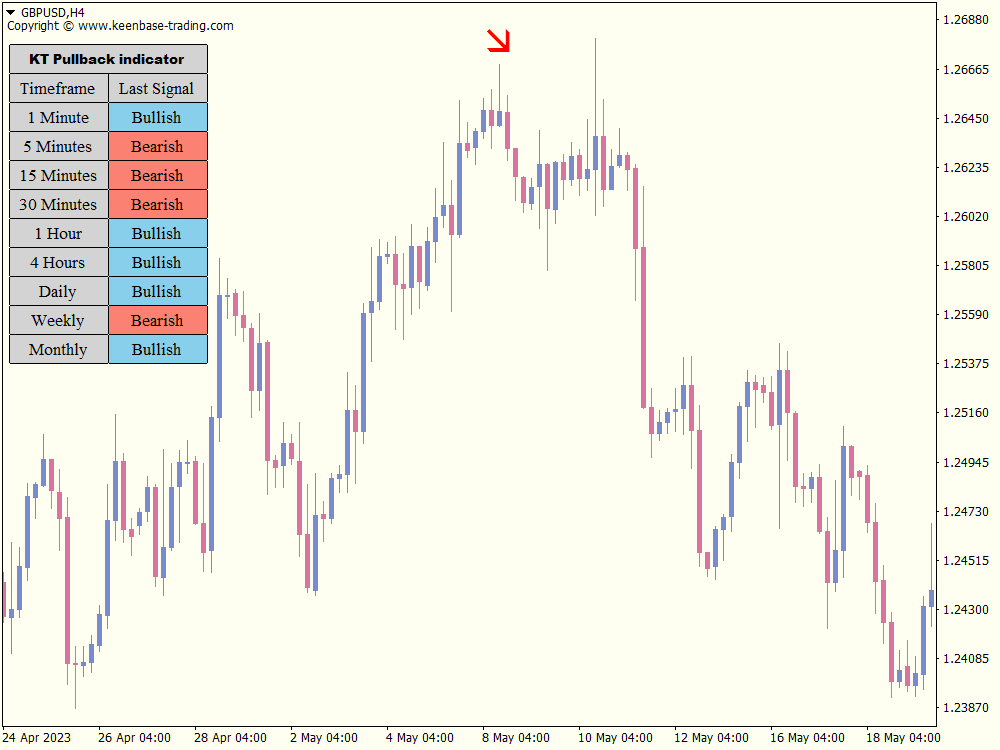
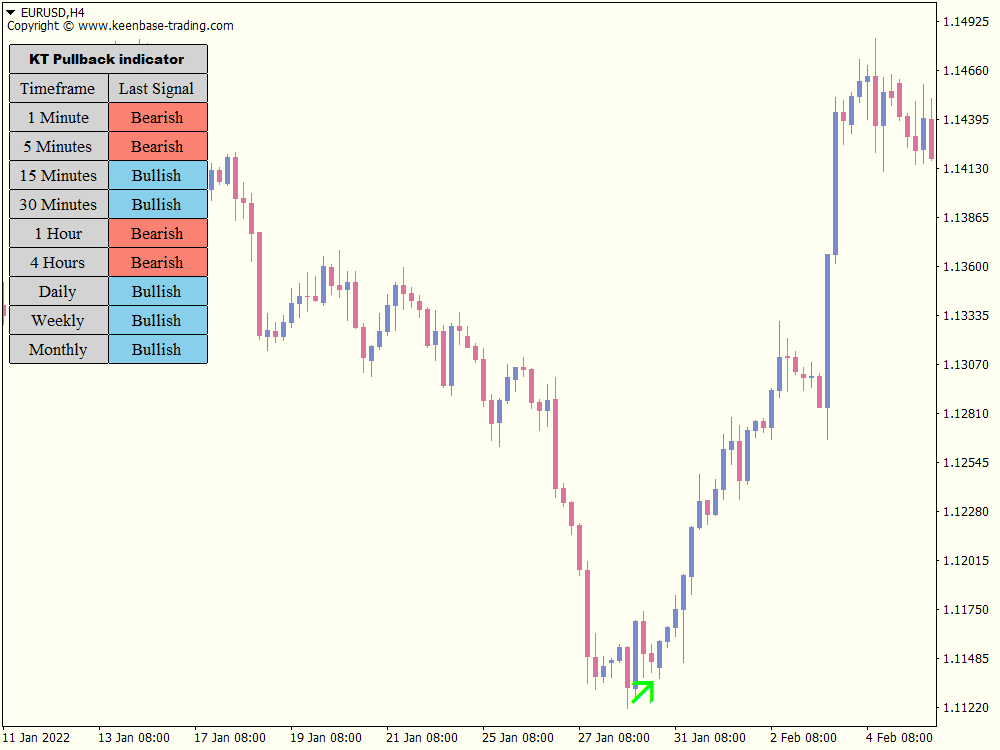
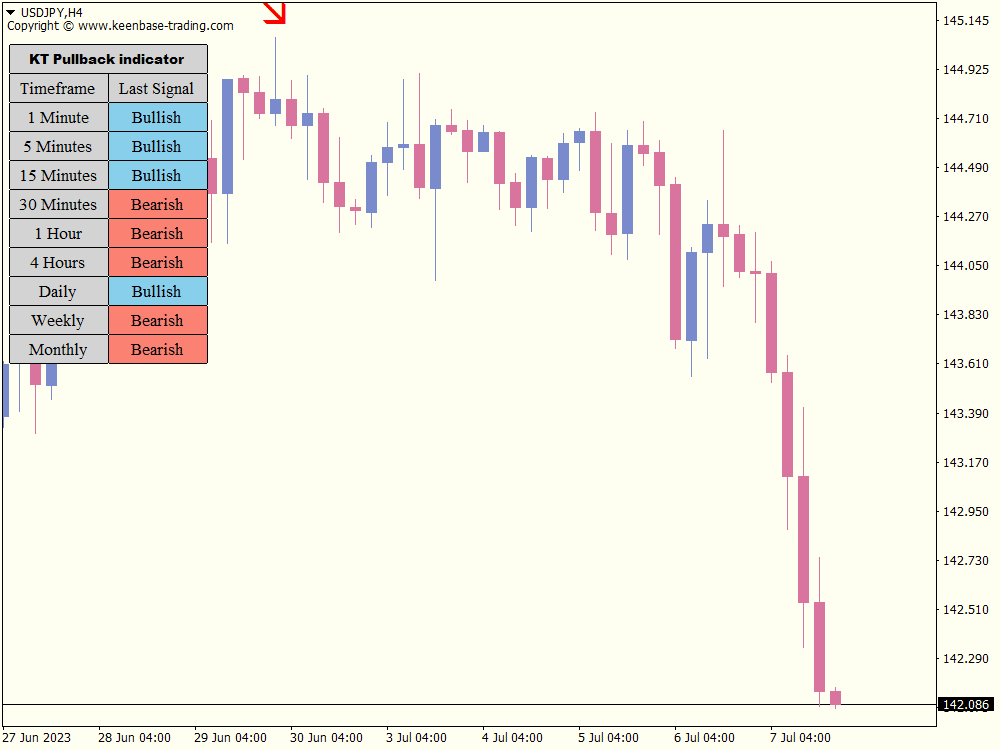
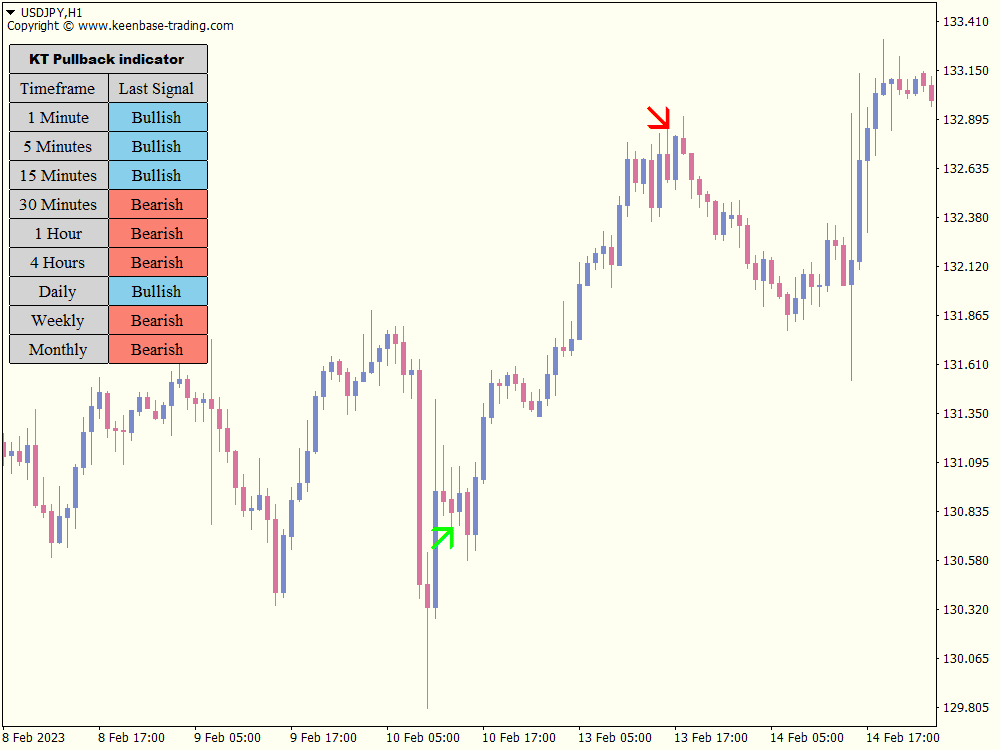
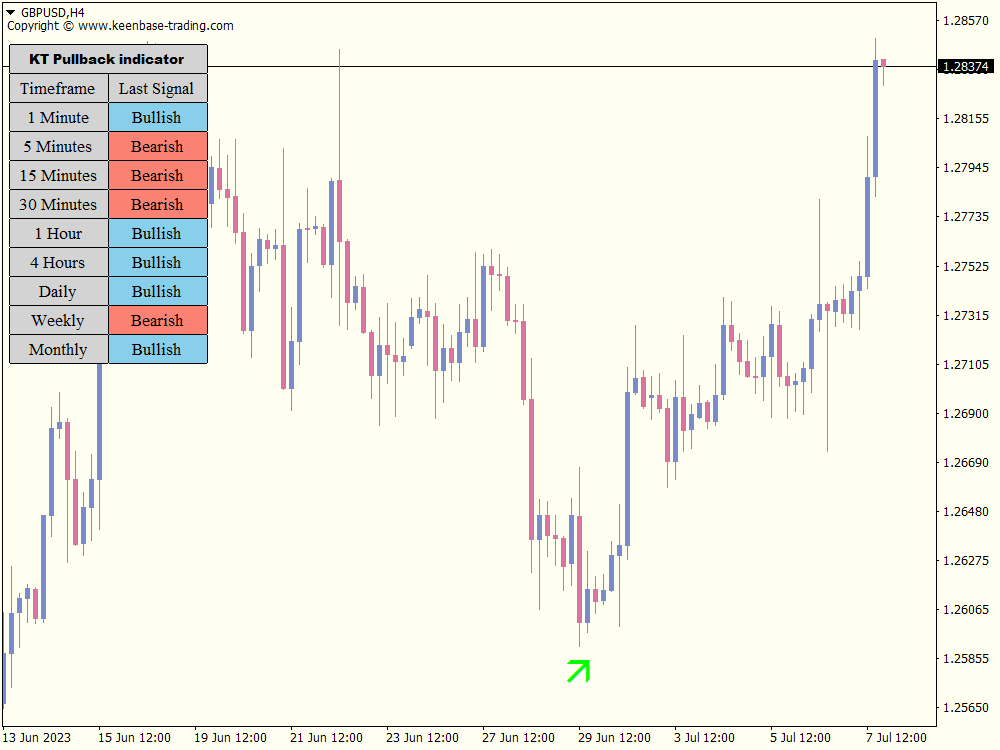
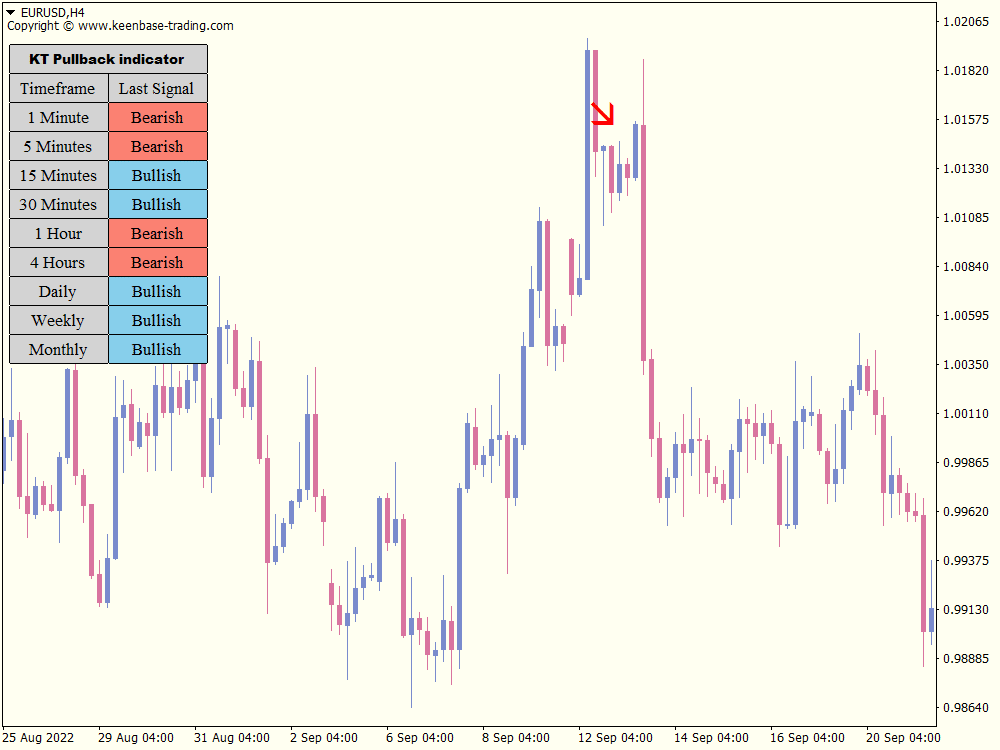
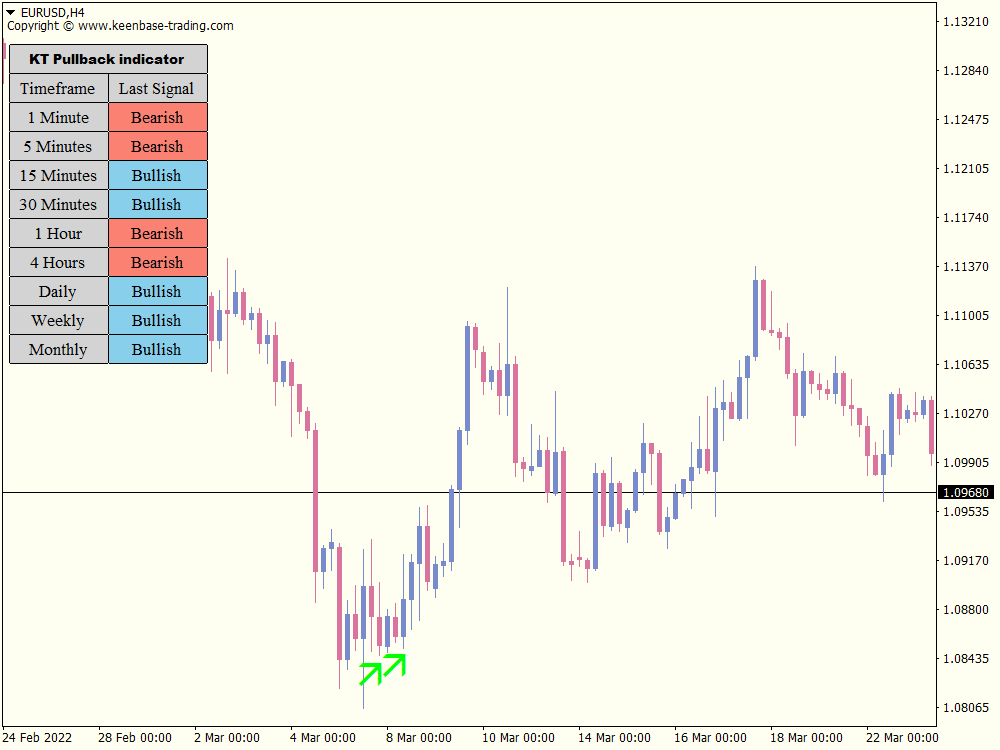
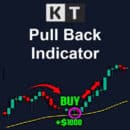
A green arrow appears below the relevant candle as a buy-side pullback setup. A red arrow appears above the candle as a sell-side pullback setup. The arrow is positioned using 0.3 times ATR(14) so it remains visually separated from price; that spacing does not measure signal strength.
Use the arrow with independent price structure and market momentum analysis. An arrow alone is not an instruction to enter a trade.
Default RSI Settings
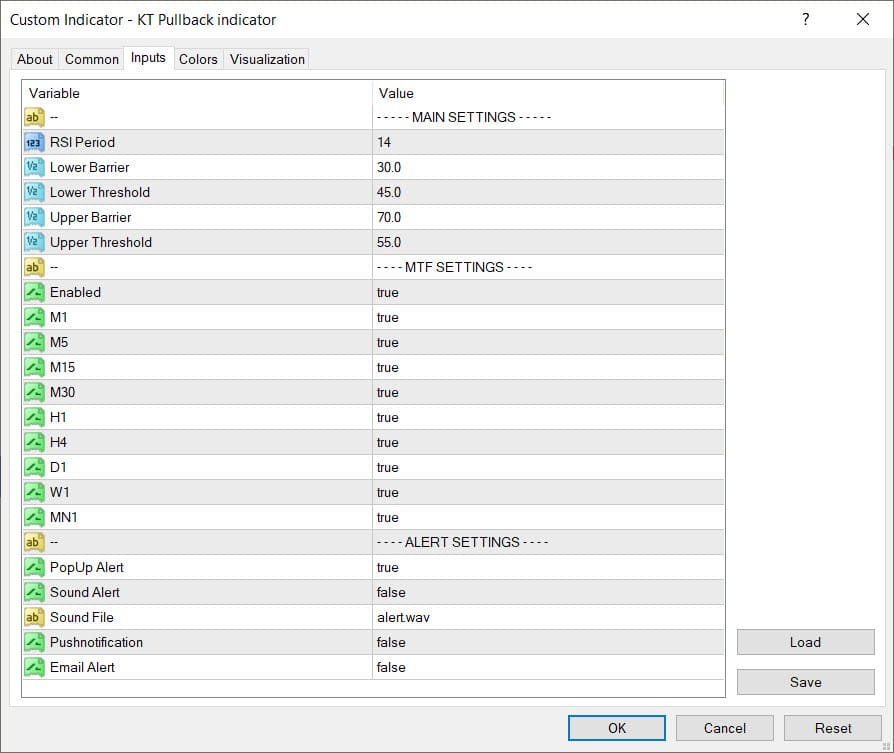
- RSI Period: 14
- Lower Barrier: 30
- Lower Threshold: 45
- Upper Barrier: 70
- Upper Threshold: 55
Start with the defaults and change one setting at a time. Keep the Lower Barrier below the Lower Threshold and the Upper Threshold below the Upper Barrier so the transition zones remain logically ordered.
Input Reference
RSI Period: controls the RSI lookback used by the signal logic.Lower Barrier and Lower Threshold: define the buy-side transition zone.Upper Barrier and Upper Threshold: define the sell-side transition zone.Scanner and timeframe switches: control whether the dashboard is shown and which timeframes it includes.Alert switches: enable popup, sound, email or push notifications according to your terminal setup.Multi-Timeframe Scanner
The scanner is enabled by default and can display M1, M5, M15, M30, H1, H4, D1, W1 and MN1. Its bullish, bearish or sideways label is based on the latest arrow found for each enabled timeframe. It is a compact view of recent arrow direction, not a separate trend-detection algorithm.
Alert Options
Popup alerts are enabled by default. Sound, email and push-notification alerts are available but disabled by default. Signal alerts are checked when a new bar begins and refer to the completed bar, which helps avoid treating an unfinished candle as a confirmed alert.
Email and push alerts also require the corresponding MetaTrader terminal settings to be configured. Review the alert message and chart context before acting.
MT4 and MT5 Setup
- Open MetaTrader and choose File > Open Data Folder.
- Place the MT4 indicator in MQL4/Indicators or the MT5 indicator in MQL5/Indicators.
- Refresh the Navigator or restart the platform, then attach the indicator to a chart.
- Confirm the RSI thresholds, scanner timeframes and alert channels before using the signals.
How to Interpret a Pullback Signal
First identify the broader direction from price structure or another independent method. Then review whether the arrow appears near a relevant support or resistance area. A Fibonacci retracement can provide additional context, but it does not validate the arrow by itself.
Before entering, define where the setup becomes invalid and whether the available risk-reward ratio fits your plan. Position size, stop placement and exit rules are not calculated by this indicator.
Configuration and Validation
Test the default settings on the symbol and timeframe you trade before changing the thresholds. Compare signals across trending, ranging and volatile periods, and record false signals as well as useful ones. If you adjust the RSI period or zones, test the revised settings on data that was not used to choose them.
Avoid selecting settings only because they fit a small historical sample. Broker data, spread, volatility and execution can change practical results.
Limitations
The indicator is based on RSI transitions and can produce late or false signals, especially in ranging markets or sharp reversals. It does not predict the end of every retracement, guarantee trend continuation, calculate profit potential, or provide built-in moving-average confirmation.
Use completed signals as one part of a tested trading process. Past chart examples do not guarantee future performance, and static source inspection does not establish profitability or non-repainting behavior.