How the Fair Value Gap Indicator Works
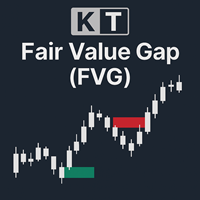
The indicator evaluates a three-candle pattern after the candles close. A bullish FVG is recorded when the third candle's low is above the first candle's high, and the middle candle closes above the first candle's high.
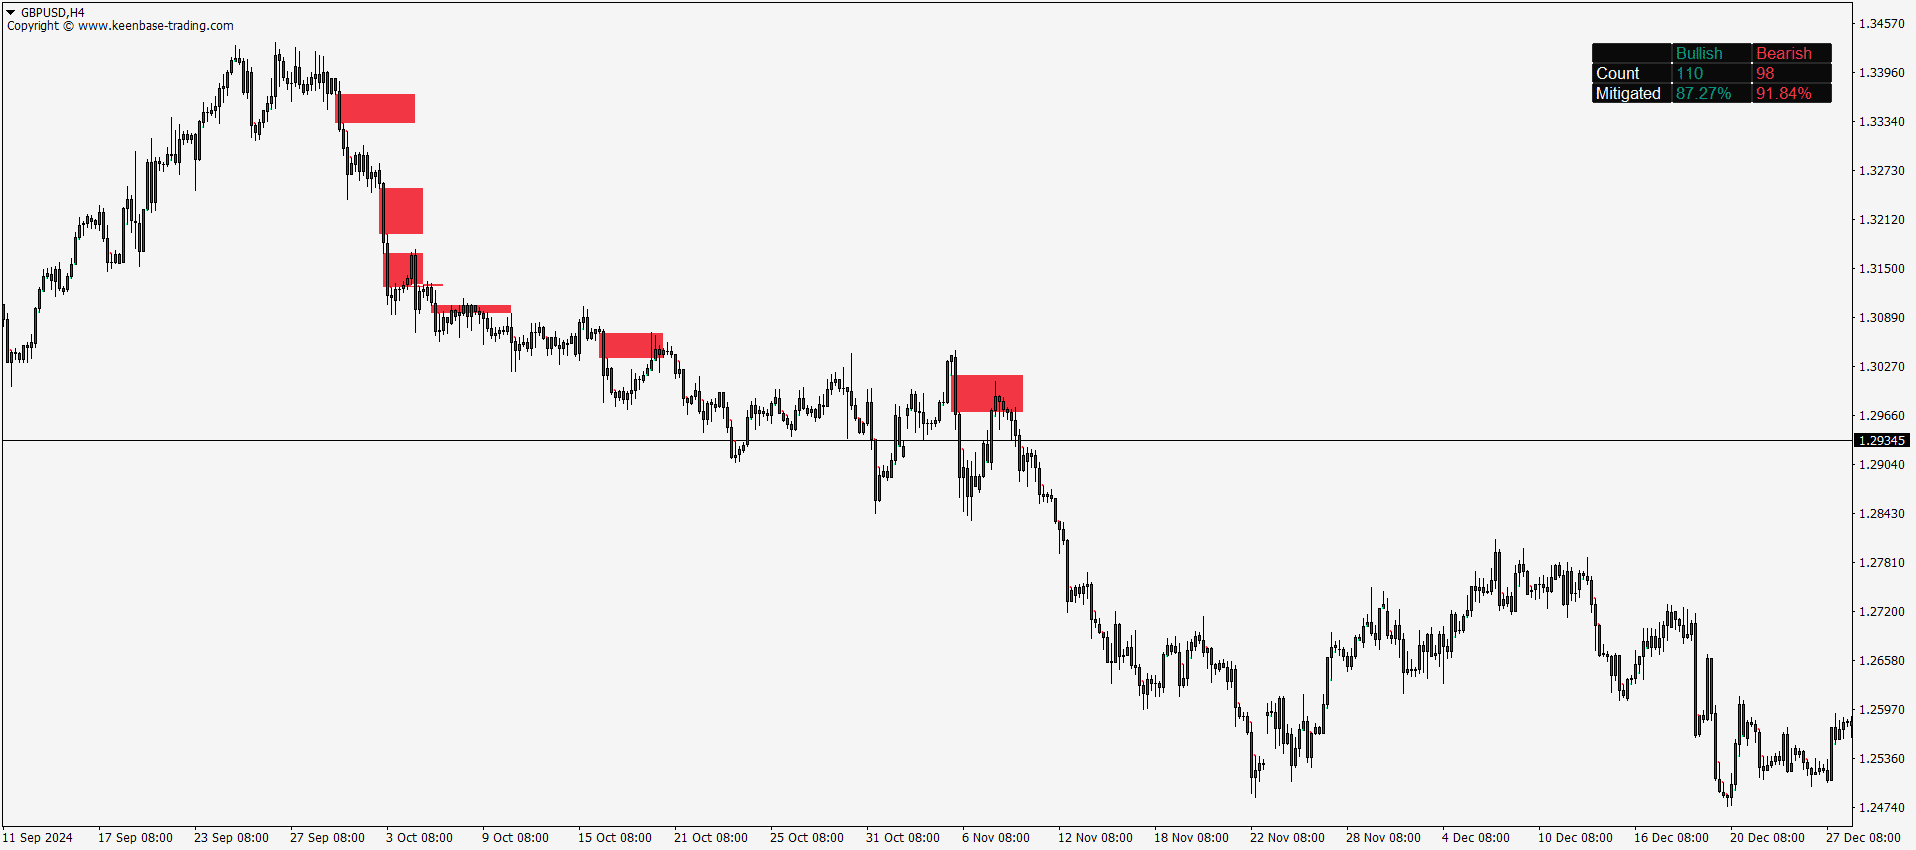
A bearish FVG is recorded when the third candle's high is below the first candle's low and the middle candle closes below the first candle's low. The Threshold % setting must also be exceeded before a zone is drawn.
This rule-based detection explains exactly what appears on the chart. An FVG is a marked price-imbalance zone, not a prediction that price must return, reverse, or continue.
Mitigated and Unmitigated FVGs
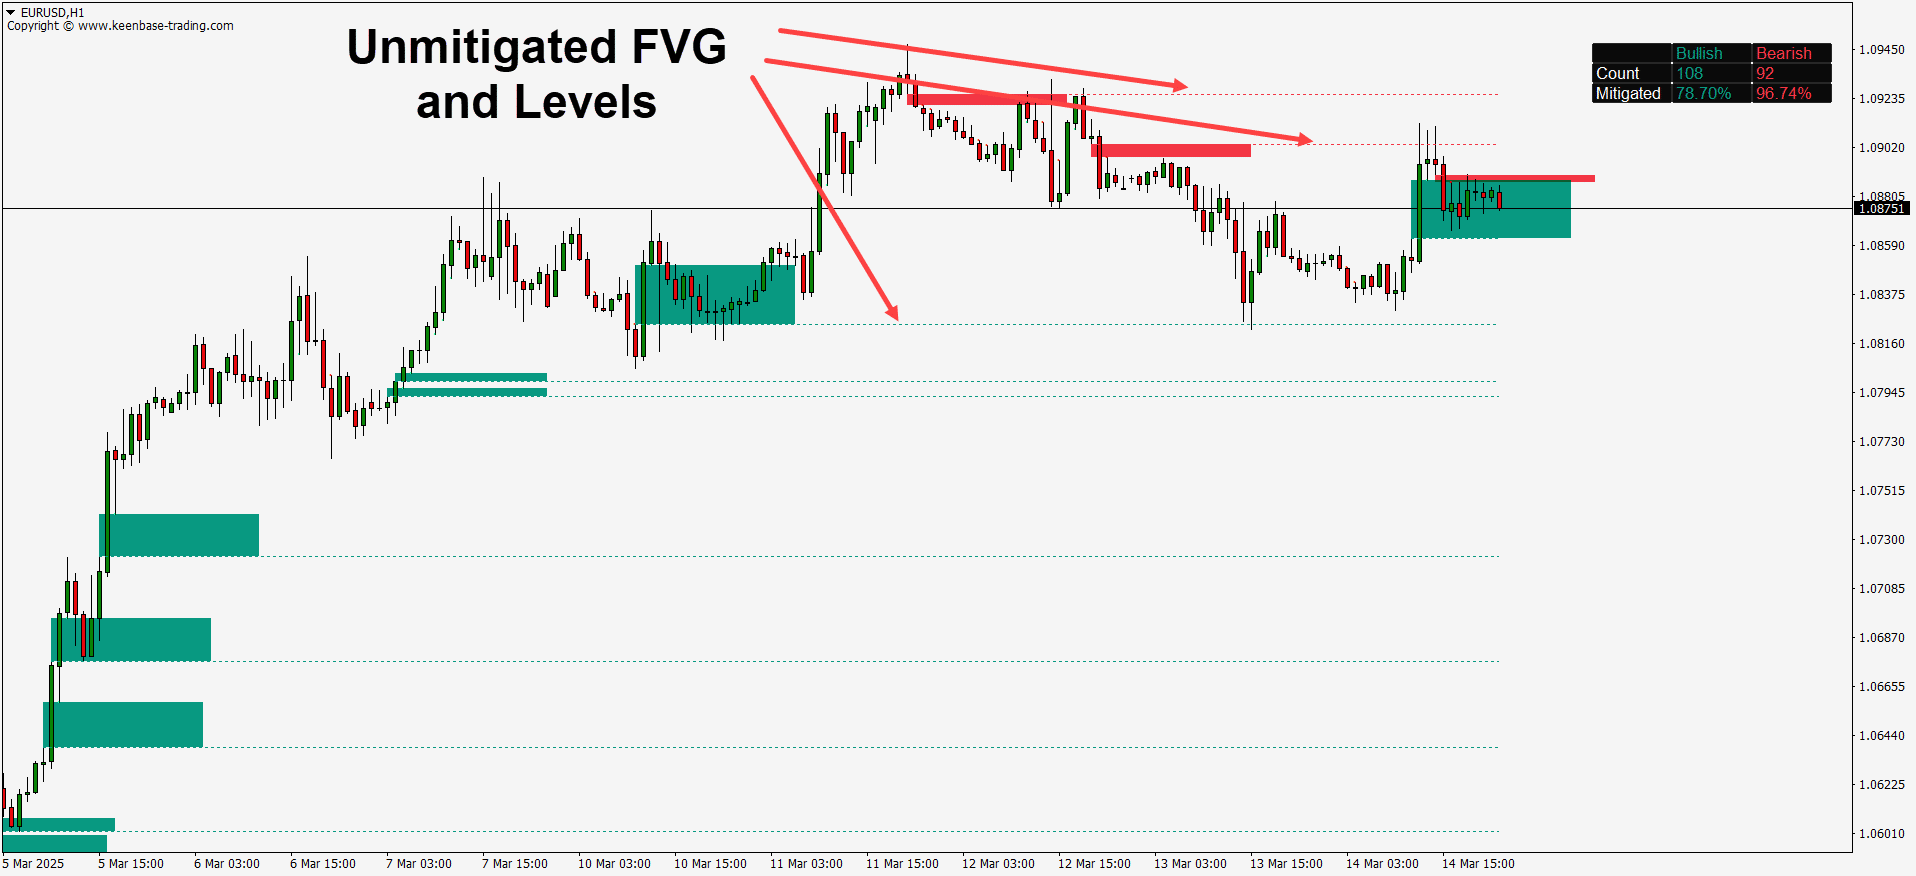
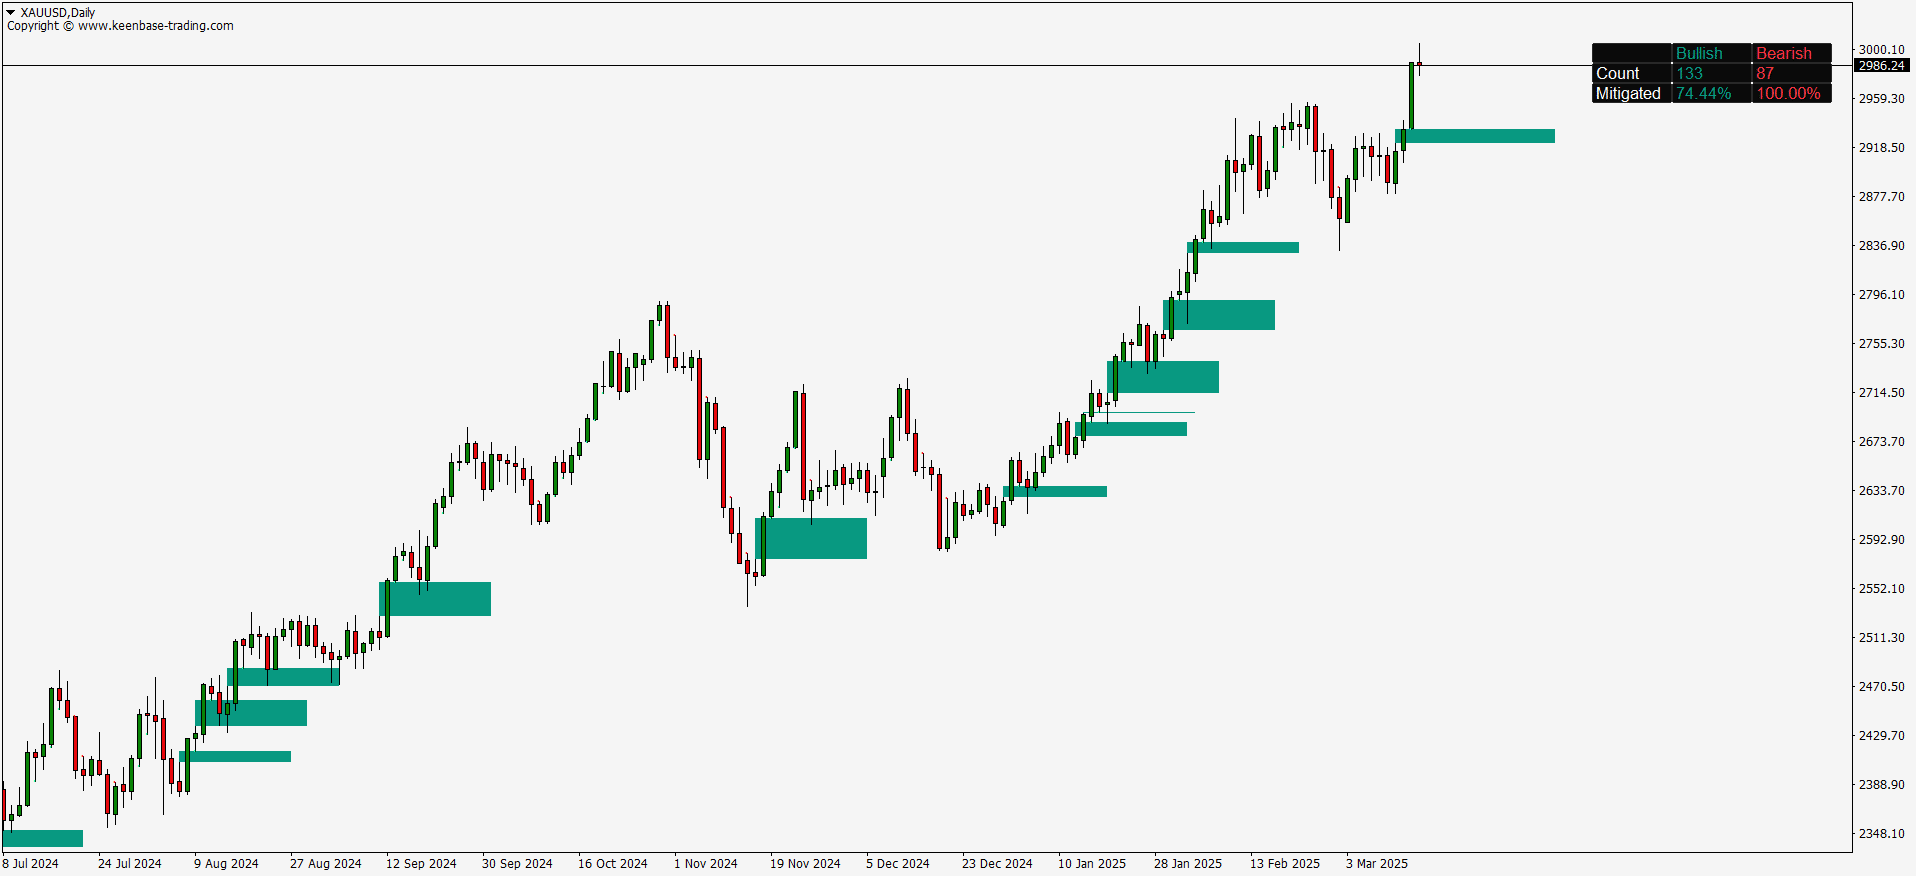
Under this indicator's rules, a bullish FVG remains active until a candle closes below the zone's lower boundary. A bearish FVG remains active until a candle closes above the zone's upper boundary. That closing-price breach removes the active rectangle and counts the gap as mitigated.
Unmitigated Levels can project selected active boundaries as dotted lines. Mitigation Levels can retain dashed boundaries from mitigated zones for additional chart context. These levels describe the indicator's state; they do not measure whether a trade was profitable.
Fair Value Gap Indicator Settings
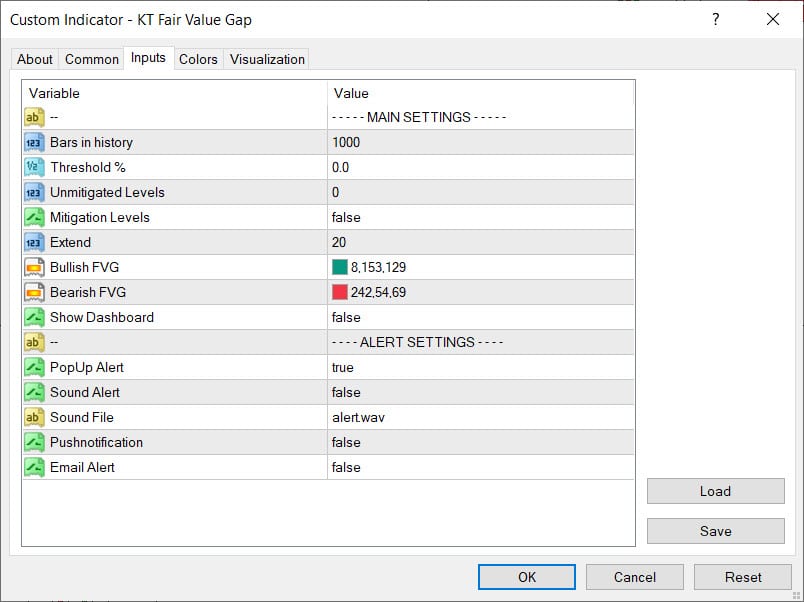
- Bars in History: Controls how many past chart bars the indicator processes.
- Threshold %: Filters out gaps smaller than the selected percentage of price.
- Unmitigated Levels: Controls how many active FVG boundaries are projected on the chart.
- Mitigation Levels: Shows optional dashed boundaries from mitigated gaps.
- Extend: Sets how far each active FVG rectangle extends to the right.
- Bullish and Bearish Colors: Sets the chart colors for each FVG type.
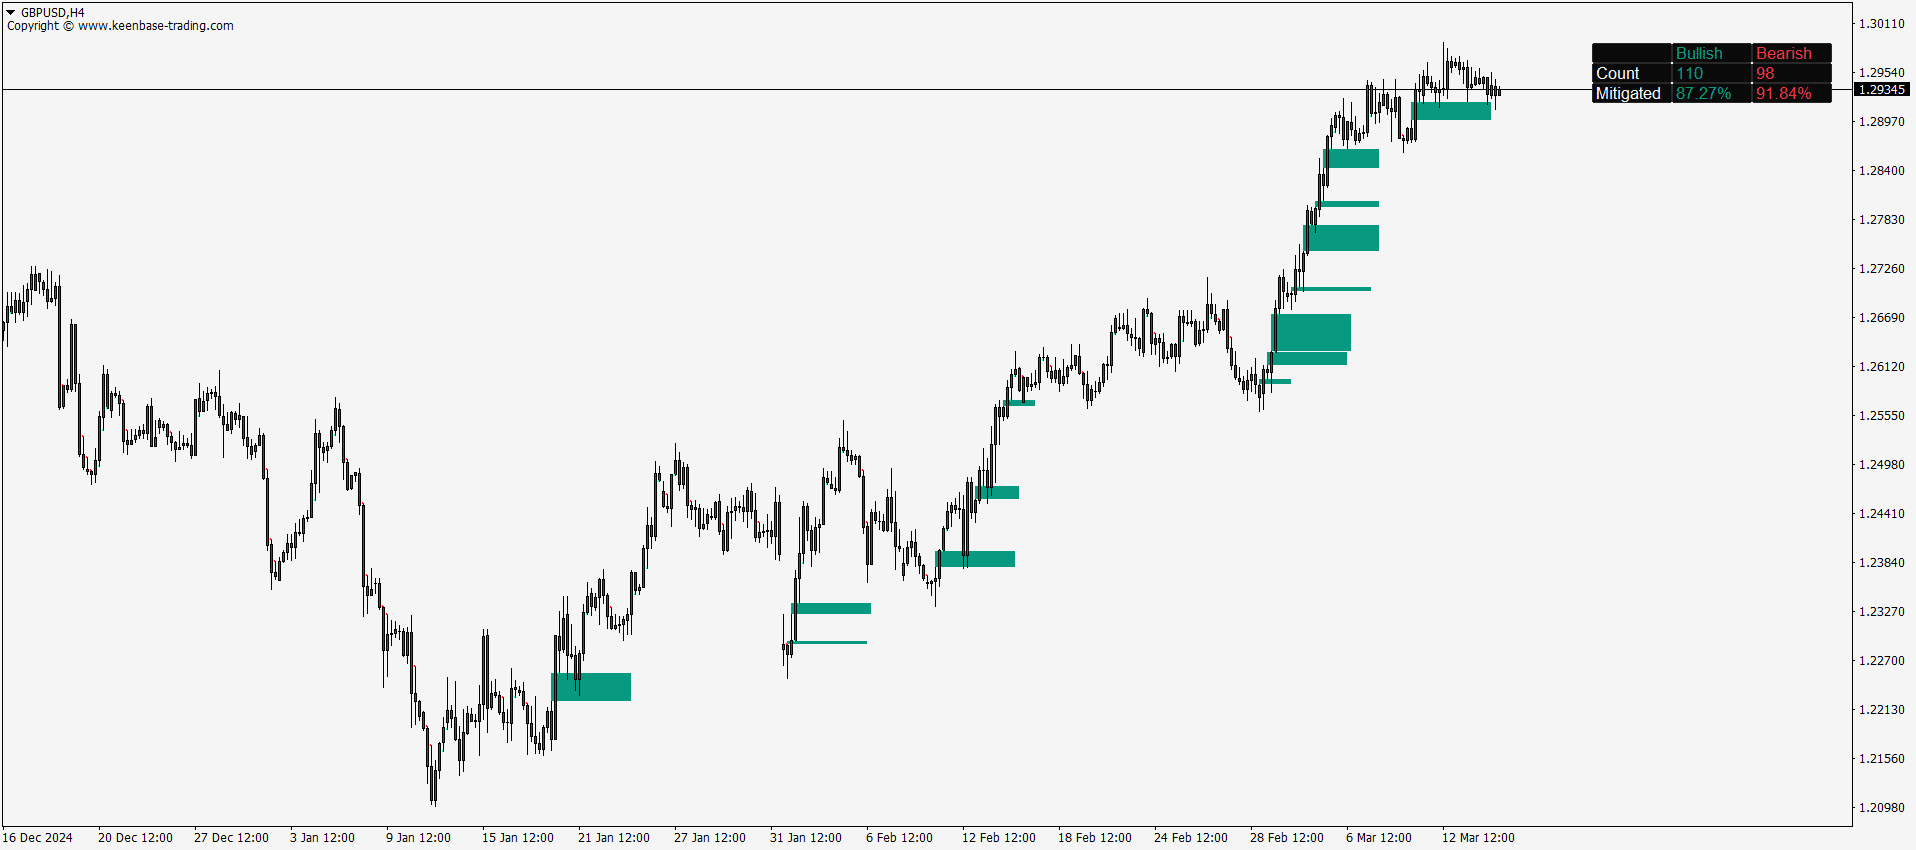
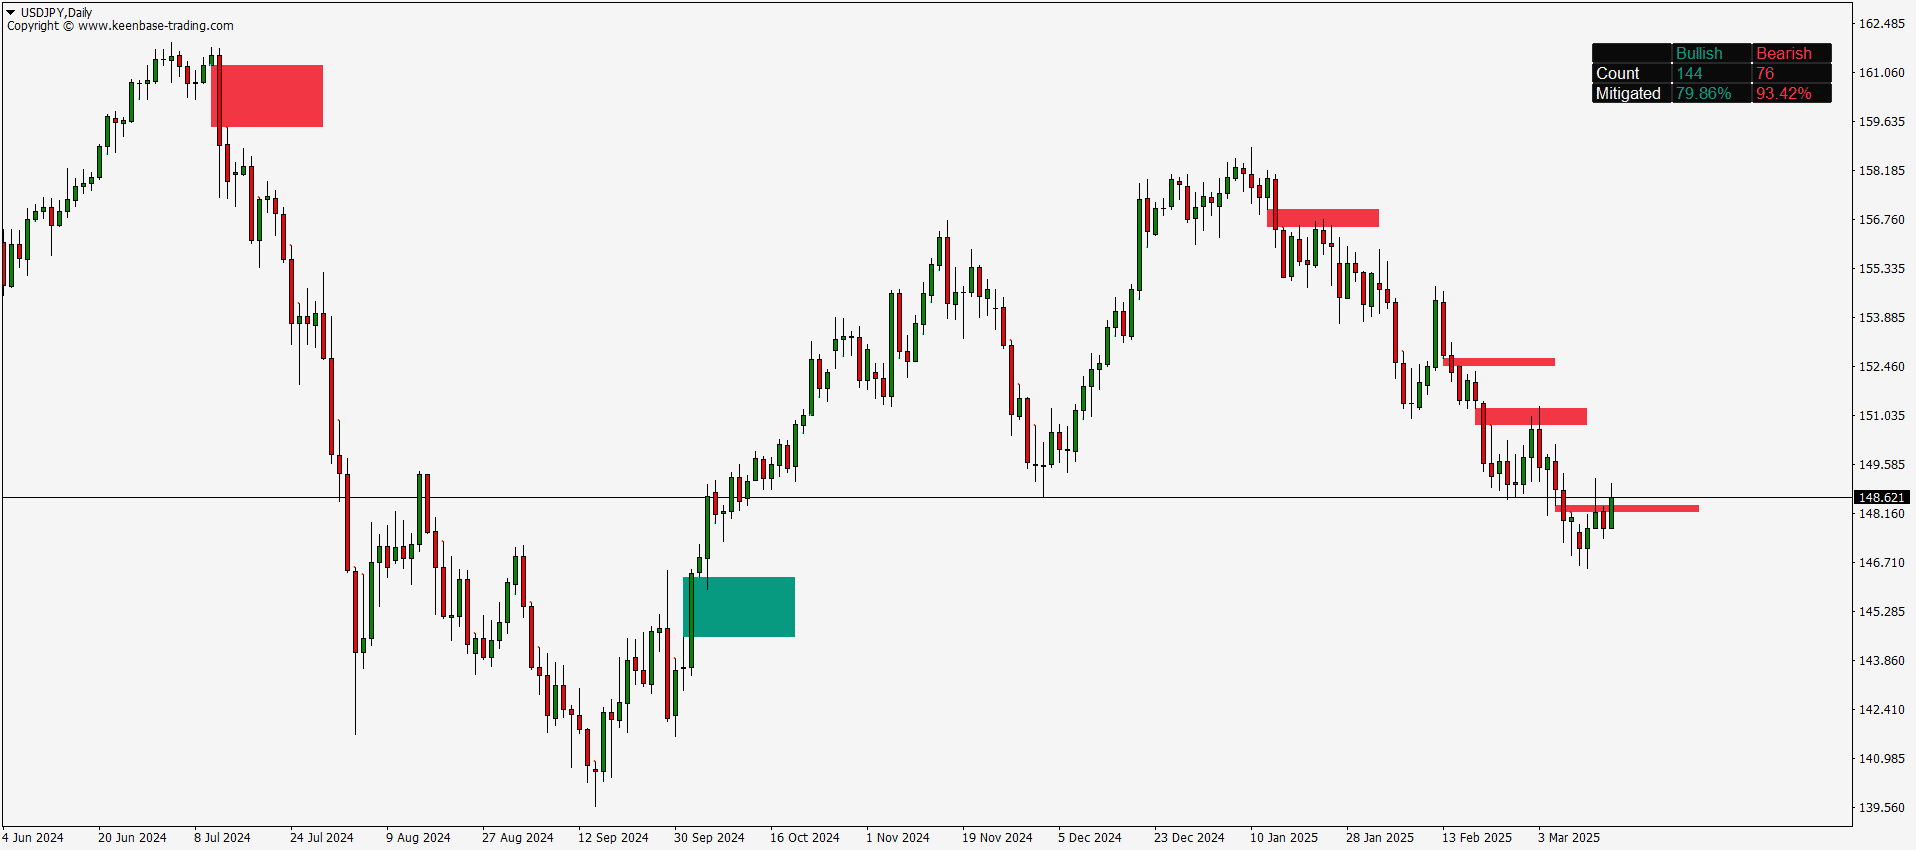
- Show Dashboard: Displays bullish and bearish FVG counts and their mitigation percentages.
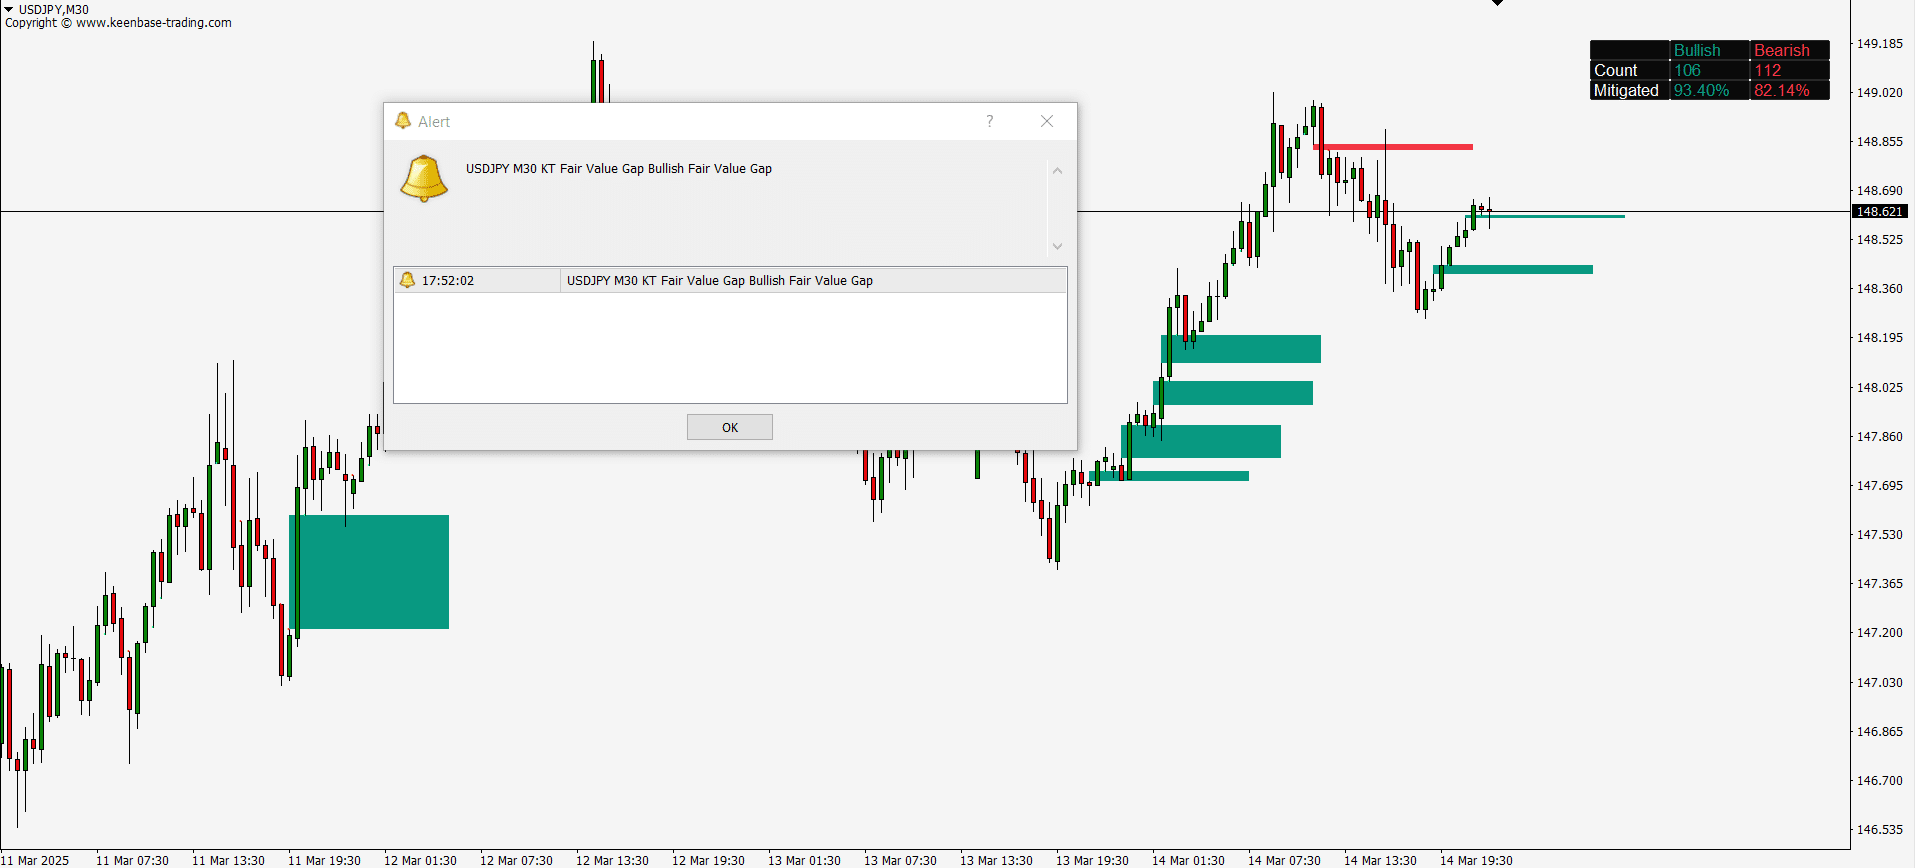
The alert options can notify you when a new bullish or bearish FVG is confirmed on a new bar. A notification identifies a newly detected zone; it is not a recommendation to enter a trade.
How to Use the FVG Indicator on MT4 or MT5
- Install the correct MT4 or MT5 file, restart the platform if required, and attach the indicator from Navigator.
- Select the symbol and timeframe, then set Bars in History, Threshold %, Extend, and the level-display options. There is no single setting that suits every instrument or timeframe.
- Wait for a completed-candle FVG. Check the broader trend, nearby structure, spread, and scheduled news before treating the zone as relevant.
- If price retests the zone, require a separate confirmation rule from your trading plan. The gap itself is not an entry signal.
- Define the invalidation price, protective stop, and position size before entry. Risk only an amount you can afford to lose.
- Demo-test and forward-test the same rules, including spread and slippage, before considering live use.
Bullish and Bearish FVG Retest Rules
For a bullish setup, traders may watch a return into the green zone and require their own bullish confirmation before entry. Under the indicator's definition, a candle close below the lower boundary invalidates the active bullish FVG.
For a bearish setup, traders may watch a return into the red zone and require separate bearish confirmation; a candle close above the upper boundary invalidates the active bearish FVG.
A target should come from a separate, tested rule, such as a prior swing or a fixed risk multiple. Do not assume every FVG will fill or produce a reversal.
Context, Confirmation, and Related Tools
A separate bullish confirmation rule, moving averages, or High volume may provide context, but no added tool guarantees a better result. You can also browse other indicators for strategies that use different rules.
This product is an indicator and does not open trades. FVG traders looking for automated execution can review the separate FVG EA and test its rules independently.
Limitations and Risk
Not every gap is revisited, and a revisit does not guarantee continuation or reversal. A very low Threshold % can show more small gaps and noise, while a higher threshold can omit smaller zones. Results can also differ by symbol, timeframe, and Market volatility.
Spread, slippage, and Economic news can materially change real trade outcomes. Historical mitigation percentages in the dashboard are descriptive statistics, not a win rate or performance guarantee.
Pre-Trade Checklist
- Confirm the correct platform, symbol, and timeframe.
- Record the Threshold % and history settings used in your test.
- Wait for the three-candle pattern to close.
- Require a separate retest and confirmation rule.
- Set the invalidation price, stop, and position size before entry.
- Account for spread, slippage, volatility, and scheduled news.
- Validate the complete method on demo and out-of-sample data.