Support and Resistance EA Features
- Levels with a track record: the EA knows how every level behaved in the past, so a level that broke three times out of four is left alone.
- Every kind of level: monthly to chart timeframe swings, pivots, previous day, week and month prices, order blocks and Smart Zones.
- No indicator needed: the level engine of KT Auto Support Resistance Levels Indicator is built in, with the same levels drawn on the chart.
- A full plan from the first second: stop loss beyond the zone and the wick, take profit at the next opposing level, and setups under twice the risk skipped.
- Closed candles only: a bounce counts only after the candle has closed back outside the level, so a wick that is still forming never opens a trade.
- The same risk on every trade: the lot size comes from the stop loss distance and your Risk Percent per Trade, so each loss costs about the same share of the balance.
- A daily loss limit that follows your risk: after losing 3 times your risk in a day, the chart stops until the next day. At most 3 trades a day, 2 open.
- No grid and no martingale: one trade per level per day, and if a stop loss is ever removed, the EA puts it back or closes the trade.
How the EA Trades a Bounce
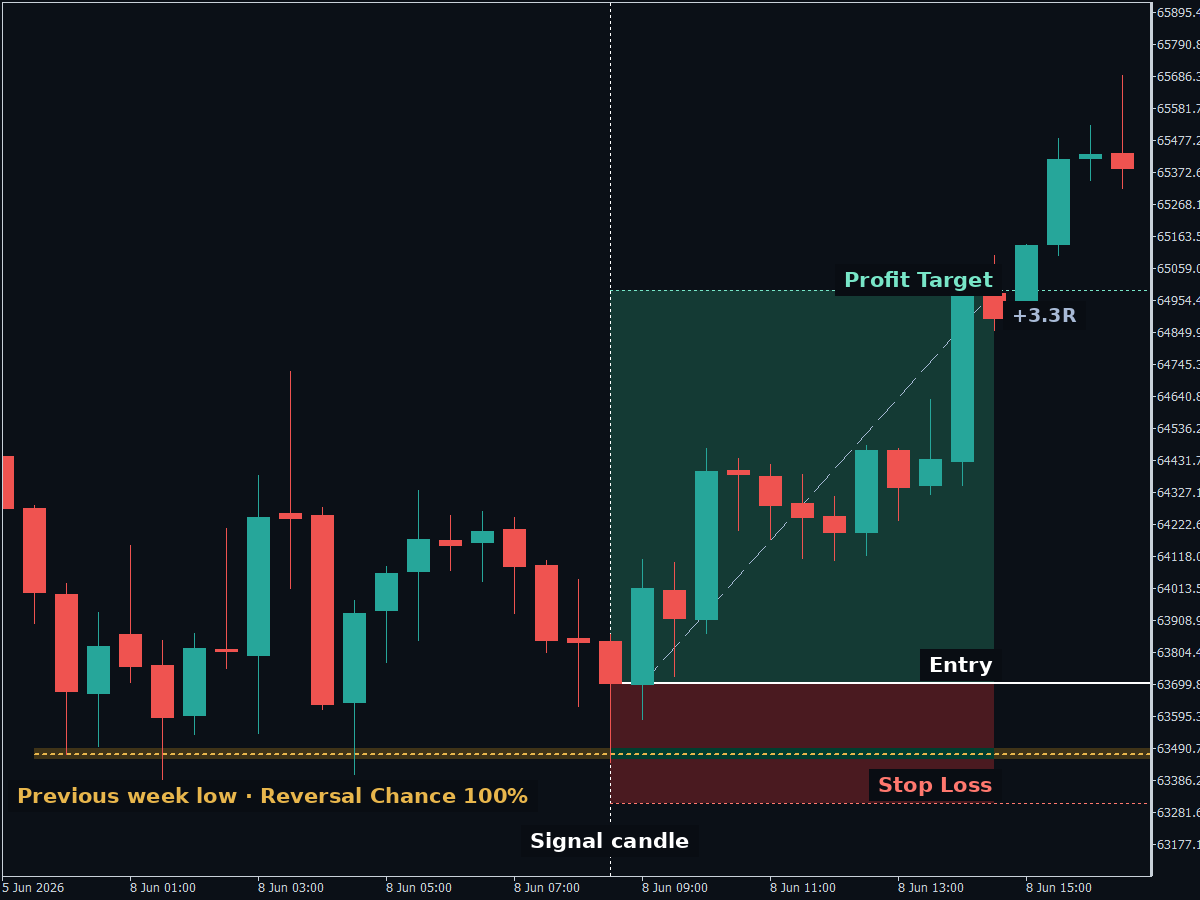
Picture JP225 on the 30 minute chart, falling into a daily support zone with a Reversal Chance of 70%. A candle dips into the zone and closes back above it, which confirms the rejection. The EA buys at that close.
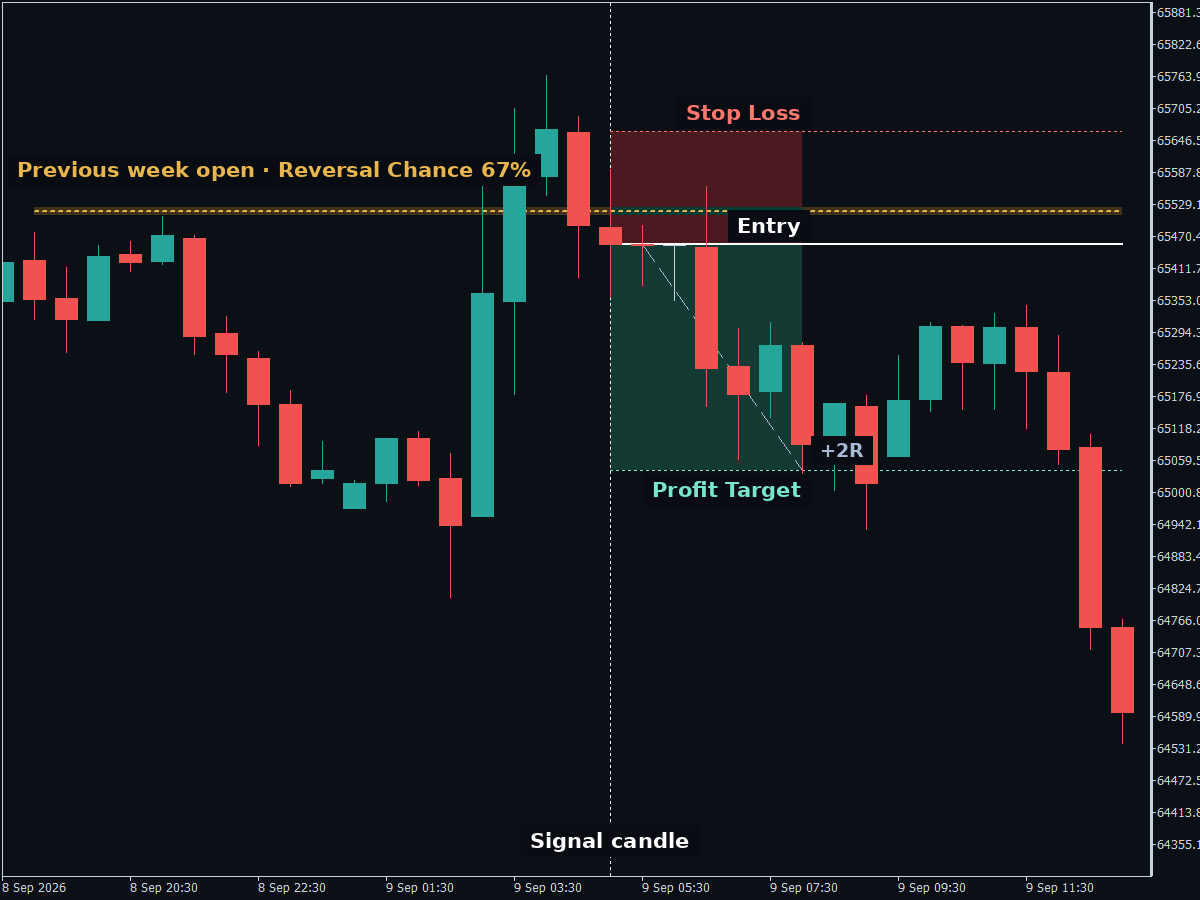
The stop loss goes below the zone and below the wick. The target is the nearest resistance above, as long as it is at least twice the stop loss distance away. When the trade reaches 1 times the risk in profit, the stop loss moves to break even. On the JP225 M30 preset, buys are also taken only while the higher timeframe trend points up.
The panel shows the nearest support and resistance with their Reversal Chance, the state ("Waiting for a signal", "In trade") and a PAUSE button.
Backtest Results for the Five Presets
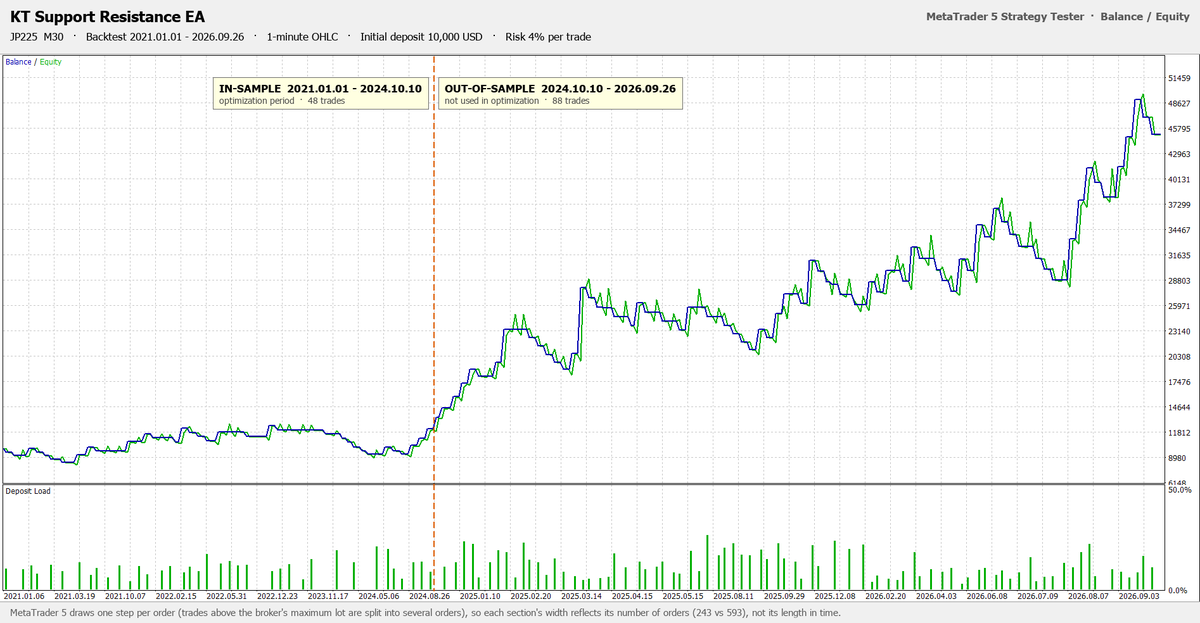
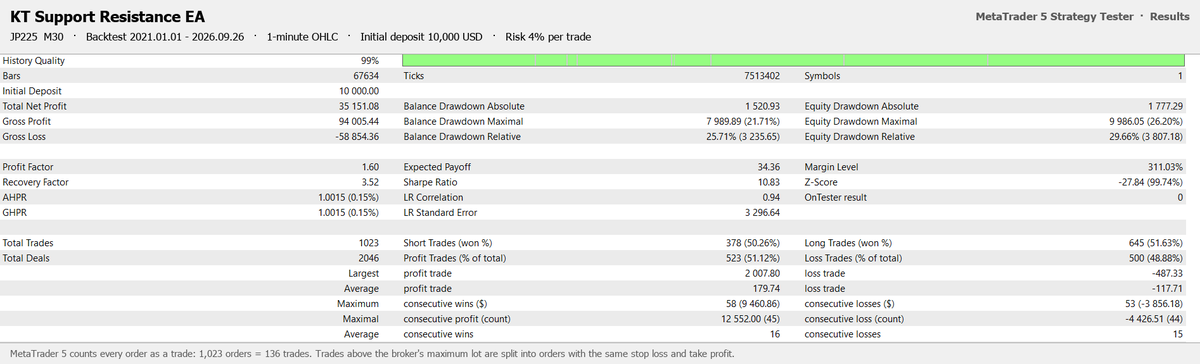
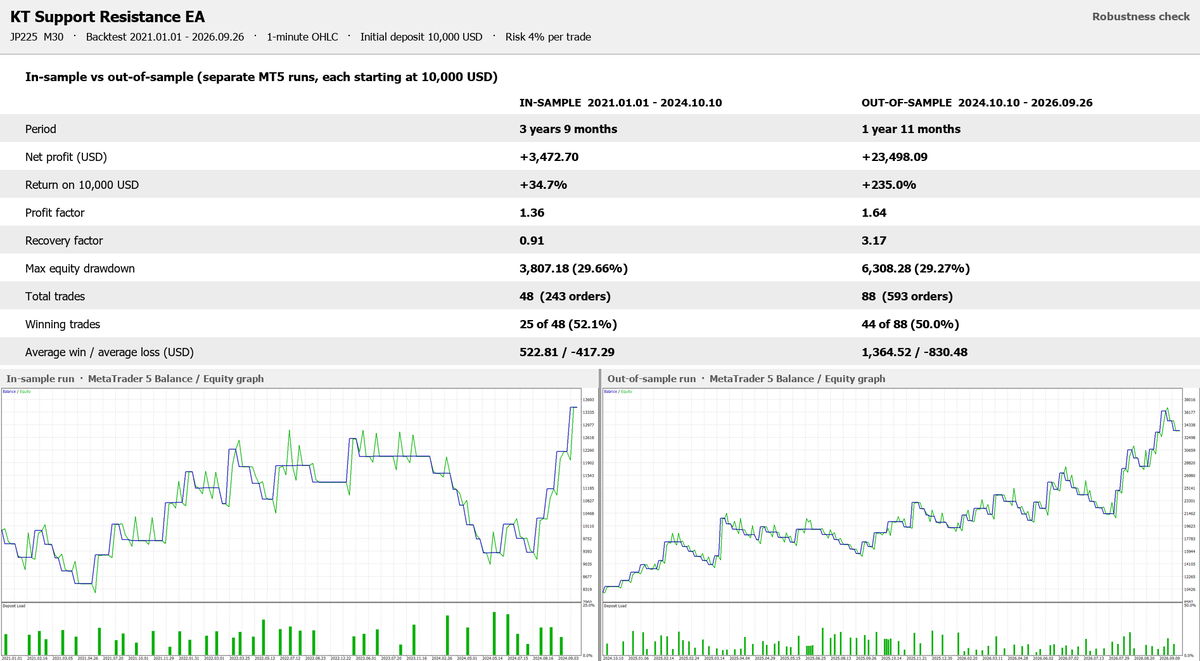
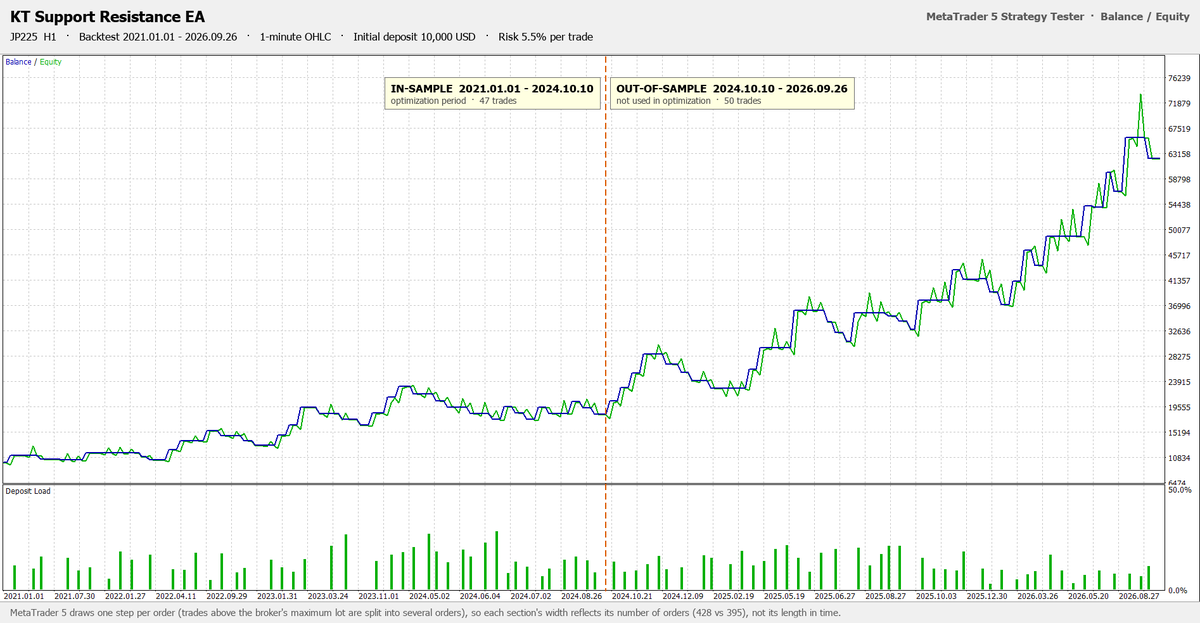
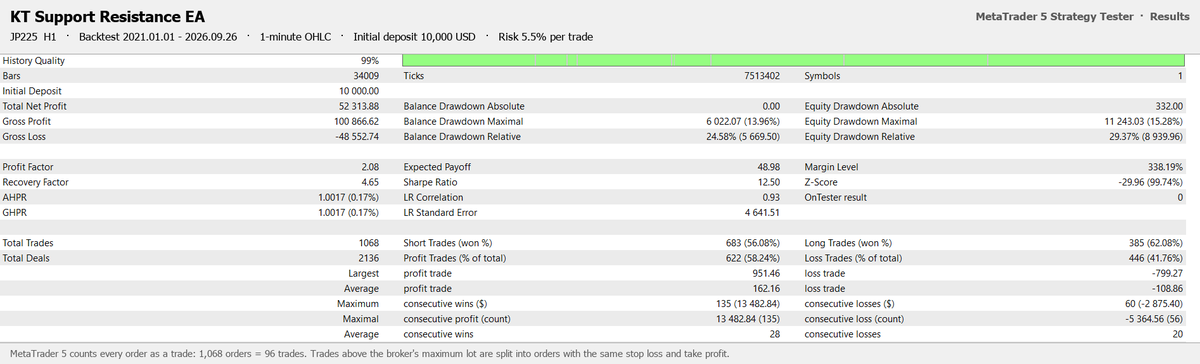
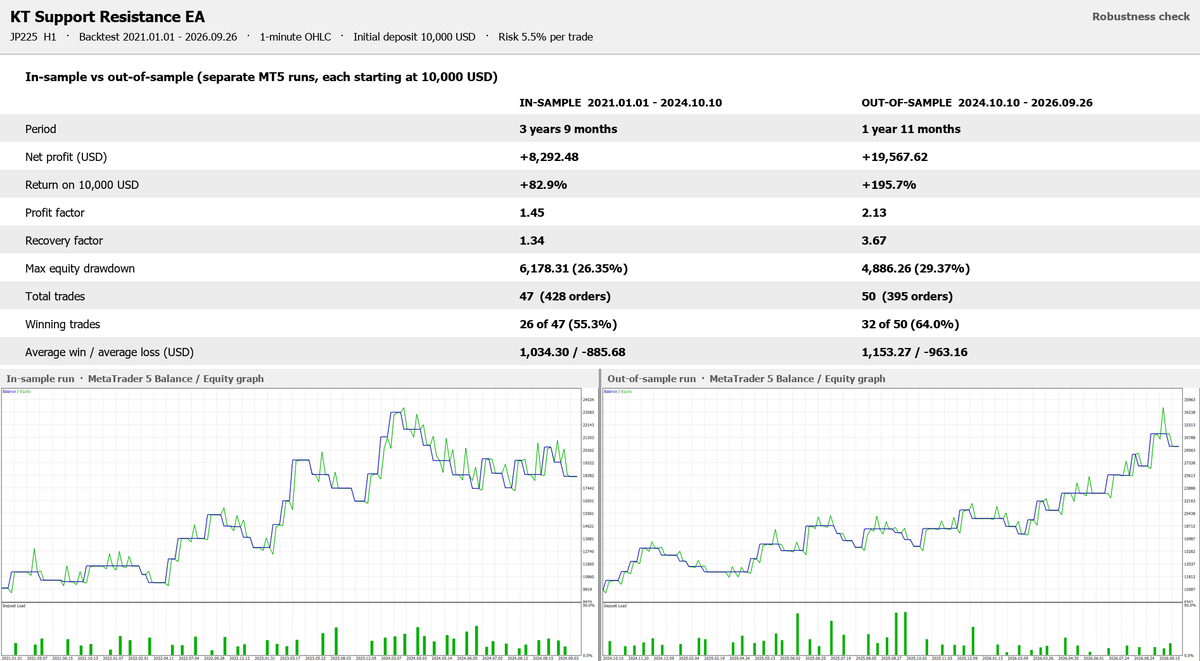
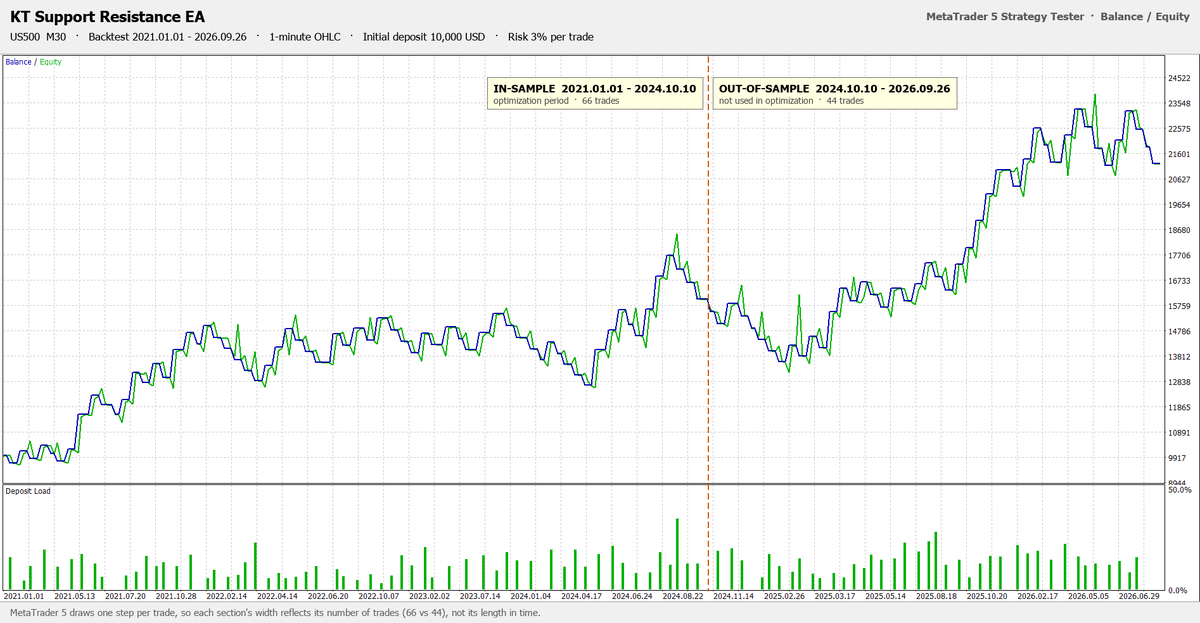
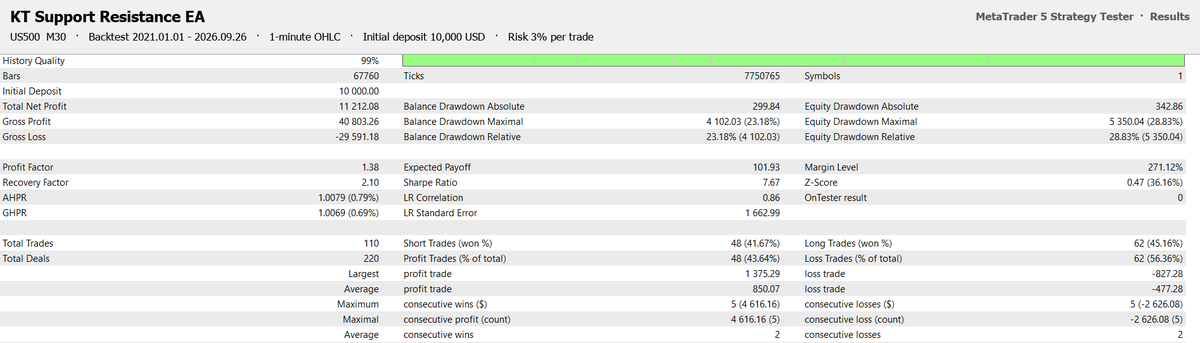
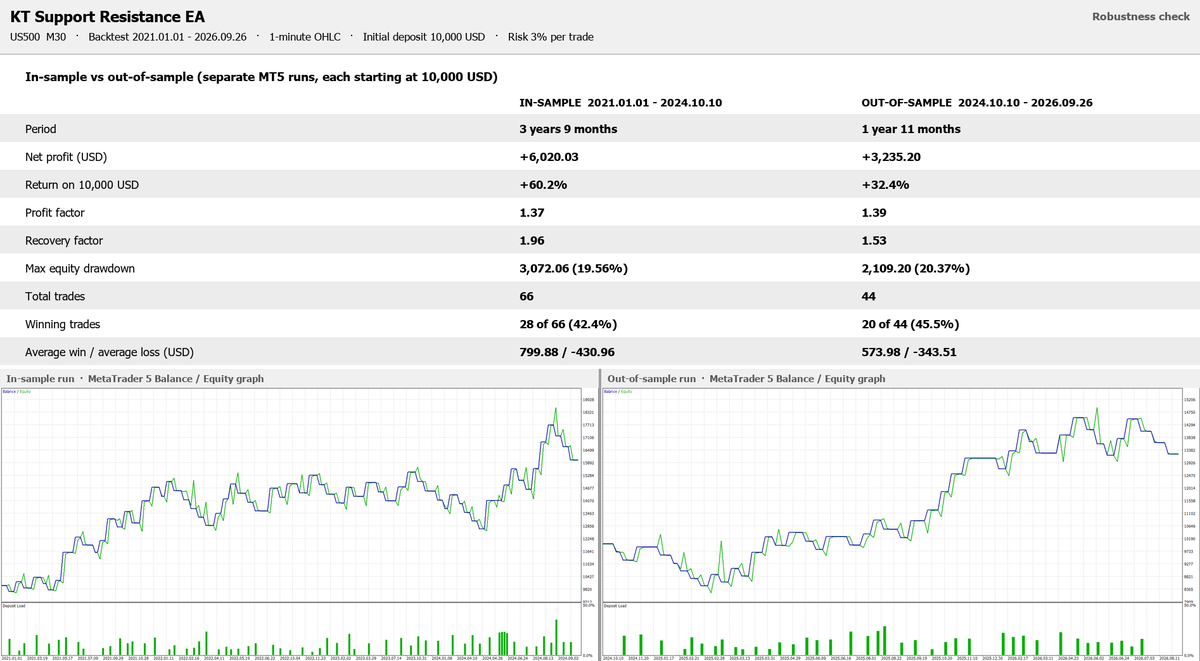
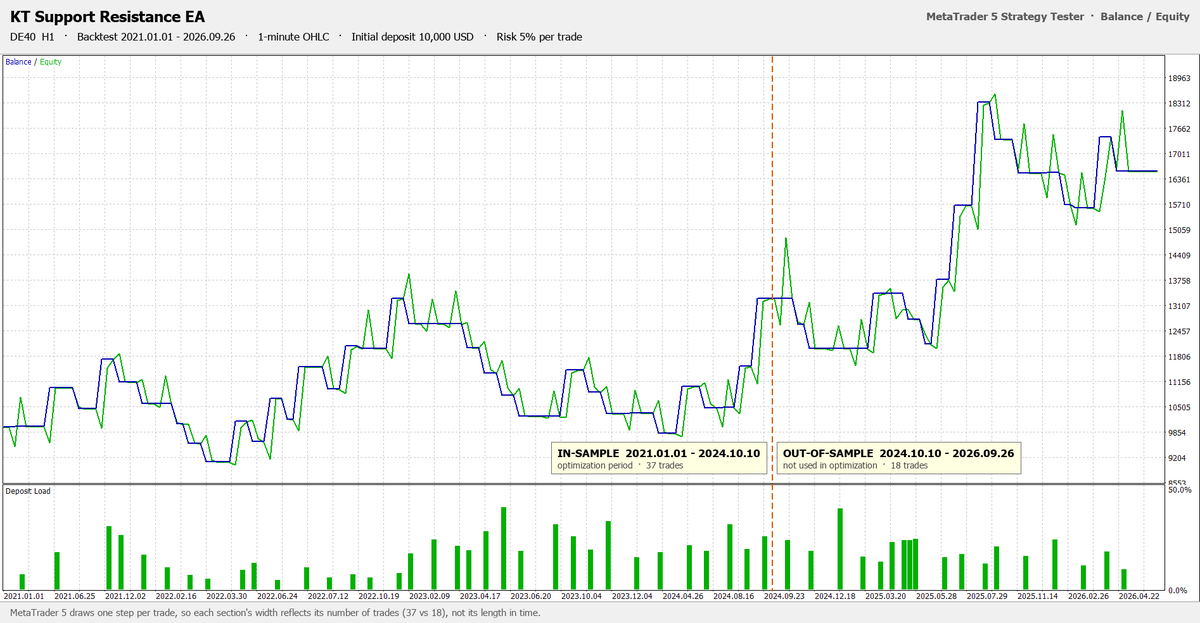
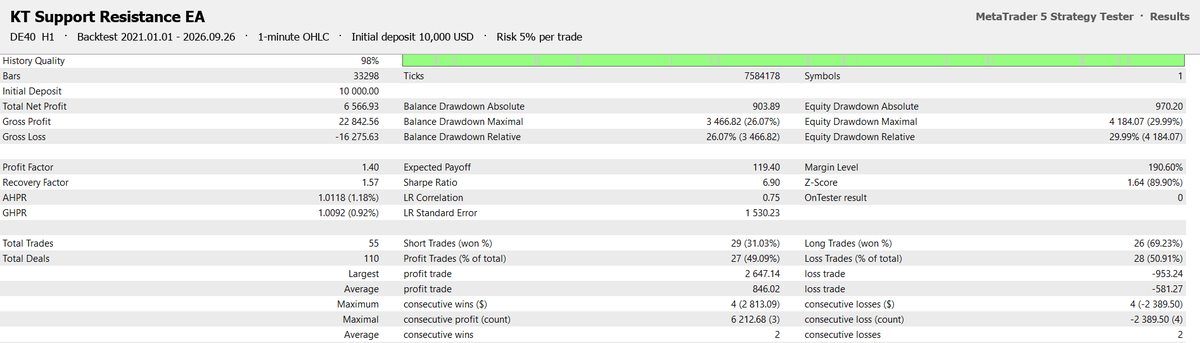
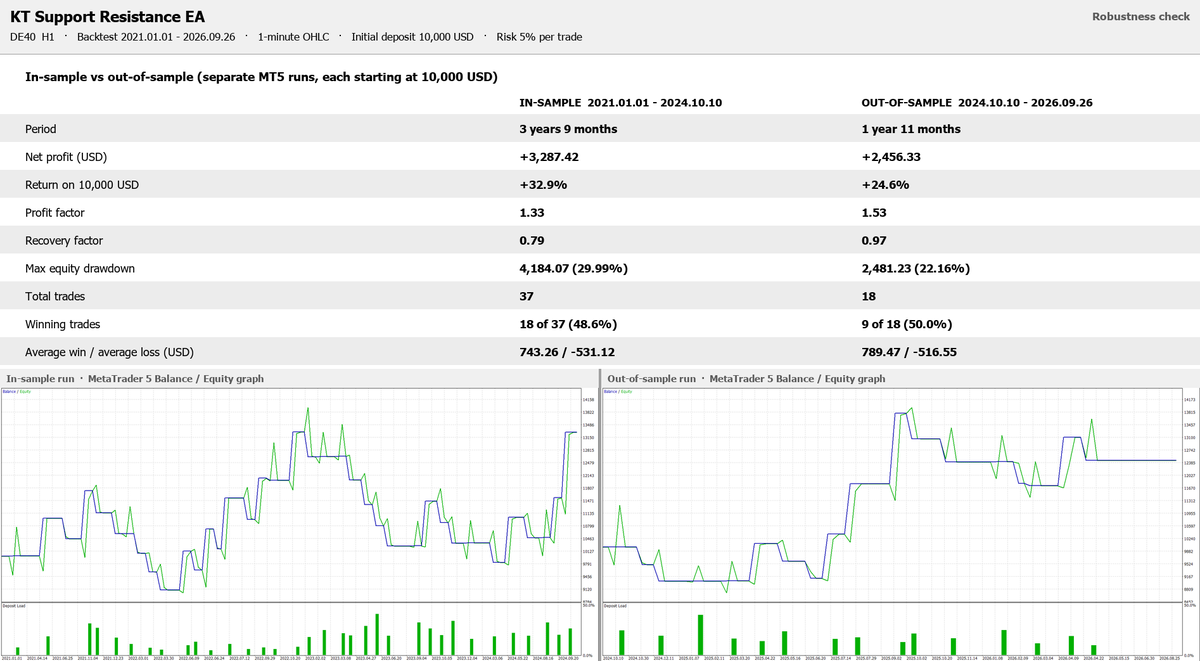
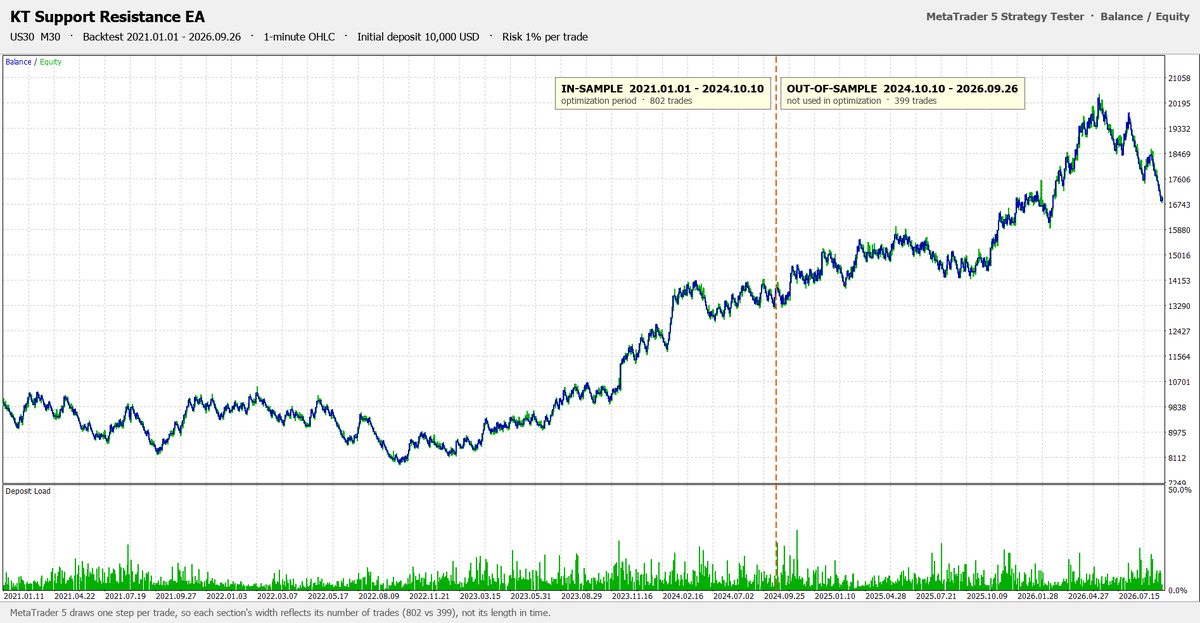
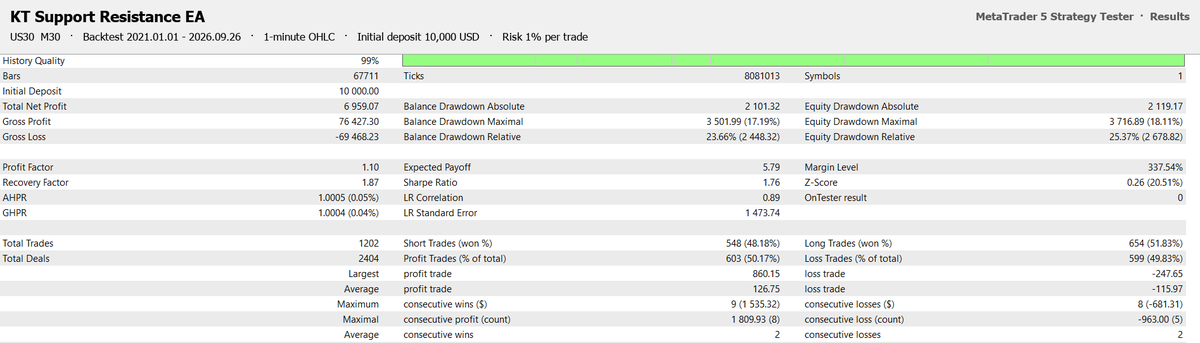
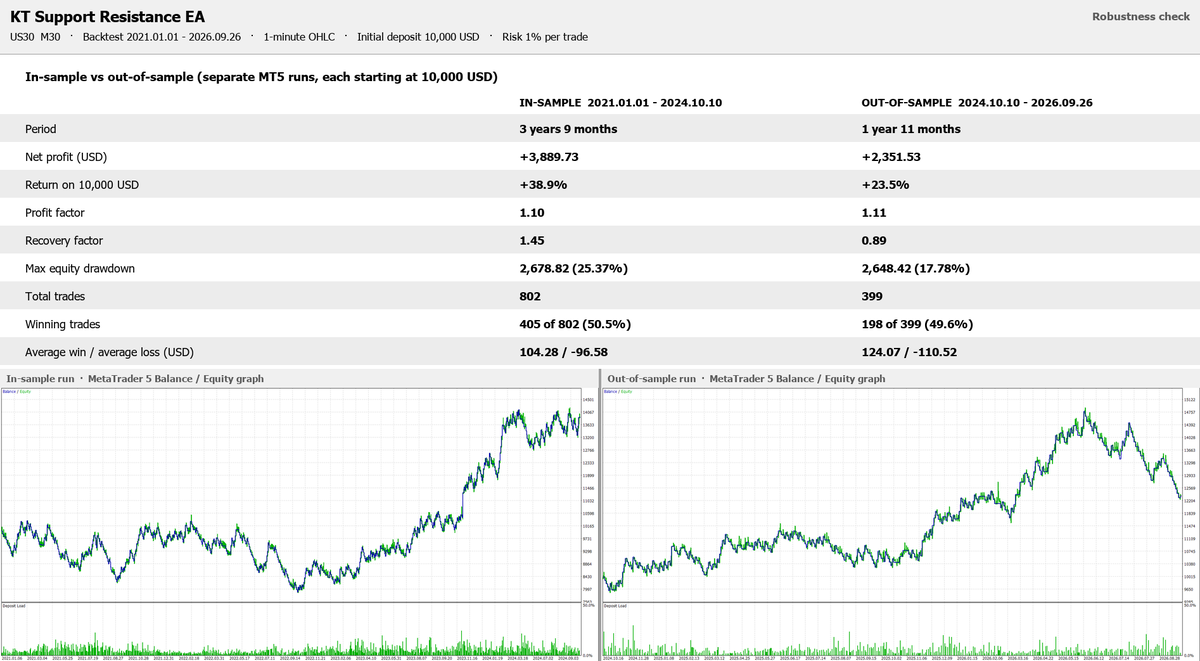
MetaTrader 5 Strategy Tester, January 2021 to September 2026, starting balance 10,000. The screenshots show each preset at the highest risk that kept the drawdown under 30%, printed at the top of every image. These are the figures in the screenshots.
The presets install at 1% risk per trade, and the risk is your choice. At 1%, the same tests made:
Recommendations
- Symbols: JP225, US500, US30 and DE40 (your broker may call them NI225, SPX500, DJ30 or GER40).
- Timeframes: M30 for JP225, US500 and US30; H1 for JP225 and DE40.
- Presets: 5 included, each with its own Magic Number.
- Account: hedging or netting, with 1% risk above the broker's minimum lot.
- Chart history: Max bars in chart set to 100000 or more.
- VPS: recommended, so the EA runs around the clock.
Input Settings
| Input | Default | What it does |
|---|
| Minimum Reversal Chance (%) | 60 | The share of touches a level must have held before it is traded. |
| Minimum Number of Touches | 2 | How many times price must have tested the level. |
| Trade Break and Retest | false | Adds a second entry: a level broken by a close, then retested from the other side. |
| Take Profit Mode | Next opposing level | Or Level ladder (half at the first level, the rest to the second) or Fixed points. |
| Minimum Reward to Risk Ratio | 2.0 | Setups with a smaller reward are skipped. |
| Risk Percent per Trade | 1.0 | The loss at the stop loss, as a percent of the balance. |
| Daily Loss Limit (losses per day x Risk Percent of the day-start balance, this chart, 0 = off) | 3.0 | Stops new trades on the chart for the rest of the day. |
| Move Stop Loss to Break Even at Reward:Risk (0 = off) | 1.0 | Protects the trade once it is 1 times the risk in profit. |
| Higher Timeframe Trend Filter | true | Buys only while the higher timeframe trend points up, sells only while it points down. |
Pro Tip
Run JP225 M30 and JP225 H1 side by side on the same account. They read the same market on two timeframes, each preset already has its own Magic Number, and together they give you about 40 trades a year instead of 20. The daily loss limit still guards each chart on its own.
Support and Resistance EA FAQ
How do I match a screenshot?
Each image names its preset and prints its risk at the top. Load that preset, set Risk Percent per Trade to the risk in the image, and run the same dates in the MT5 Strategy Tester. Your broker's price data decides the exact levels, so expect close figures.
How often does it trade?
About 24 trades a year on JP225 M30, 10 to 20 on the H1 presets, and about 200 on US30 M30. It waits for levels with a record, so quiet weeks are part of the plan.
What account size do I need?
Any balance where 1% covers the broker's minimum lot at the preset's stop loss distance. When it does not, the EA skips the trade instead of risking more than you set.
MT4 or MT5?
Both trade the same rules and come with their own five preset files. Every download also includes a step by step user guide.
Is It the Right EA for You?
If you want an EA that trades every line on the chart, on every market you can open, this is not it. If you want one that trades only the support and resistance levels with a record of holding, with a stop loss and a target on every trade, KT Support Resistance EA is the one.