Equal highs are where buy-side liquidity tends to sit, above the highs, where breakout buyers pile in, and short sellers park their stops. Equal lows are the sell-side mirror. These are the pools price so often reach before it turns.
Where most free EQH/EQL indicators stop at drawing a line, this one keeps working. It scores every pool from 0 to 100 so you can tell at a glance which levels actually hold meaningful liquidity and which are just noise, and it tracks each level in real time so you know whether it's still active, has been swept, or has been broken outright.
It works on both MetaTrader 4 and MetaTrader 5, on any symbol and any timeframe, and it's built around closed-bar confirmation, so the levels it shows you are real structure, not a line that repaints the moment the next candle prints.
What Are Equal Highs and Equal Lows?
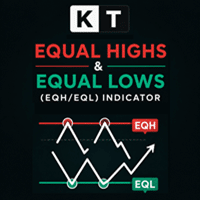
Equal highs form when the price pushes up to roughly the same level two or more times and gets rejected each time. Equal lows are the opposite: price drops to about the same level more than once and holds. On the chart, they look like a row of highs or lows lined up at the same price, and traders shorten them to EQH and EQL.
Here's why they matter. When price stalls at the same high repeatedly, traders start to expect that level to hold, so short sellers place their stops just above it, and breakout buyers queue their orders there too.
All of that sits above the highs as buy-side liquidity, a pool of resting orders waiting to be triggered. Equal lows work the same way in reverse, with stops and breakout sells stacking up below the lows as sell-side liquidity.
Big players need that liquidity to fill their size, and price has a habit of reaching for it. That's why you'll so often see a market run just past an obvious equal high or equal low, trigger the stops resting there, and then reverse hard.
It looks like a failed breakout, but it's really the market collecting orders before moving where it actually wanted to go. Once you start seeing equal highs and equal lows as liquidity rather than plain support and resistance, a lot of those "fakeout" moves stop looking random.
What the Indicator Does
The KT Equal Highs & Equal Lows indicator watches your chart and marks these liquidity pools as they form. It starts by finding confirmed swing highs and swing lows, the genuine turning points in price, not every little bump.
Then it checks whether any of those swings line up at the same level. The moment two or more of them match, it draws that area on your chart as an equal high or equal low.
A couple of things make its detection worth trusting rather than just cluttering your screen:
- It waits for confirmation. A swing point isn't marked until enough candles have closed on both sides of it to prove it's a real pivot. Nothing appears on the current, still-forming candle, so the levels don't shift around or repaint on you.
- It adapts to the market. Two highs are rarely exactly equal, so the indicator allows a small tolerance based on ATR. When the market is volatile, that window widens; when it's quiet, it tightens. The same settings behave sensibly whether you're on gold, a quiet forex pair, or an index.
- It treats a cluster as one pool, not a mess of lines. When several swings land in the same area, the indicator groups them into a single liquidity pool and draws one clean level at their average price. It also filters out clusters that are too loosely spread to count as genuinely equal, so you get tidy pools instead of a tangle of overlapping lines.
- It checks whether the level is still meaningful. Before it accepts a match, it looks at the price it traded at in between. If a candle has already closed decisively through the area, that pool has already been used up and won't be marked as fresh liquidity. Wicks through the level are fine, that's just price probing, but a real close-through means the level is spent.
The result is a clean chart that shows where liquidity is actually resting, updated once per closed candle, so it stays stable while you're reading.
The Liquidity Strength Score: Know Which Pools Actually Matter
This is where the indicator does something the other free EQH/EQL indicators don't. Finding equal highs and equal lows is the easy part. The real question, once you've got half a dozen of them on your chart, is which ones are worth watching.
A level price tapped twice three weeks ago is not the same as a tight, fresh level price that has been hit four times, but most indicators draw them identically and leave you to sort it out.
KT Equal Highs & Equal Lows scores every pool from 0 to 100 and tags it, so your eye goes straight to the liquidity that counts. Each level gets a plain-language label right on the chart:
- weak (below 40)
- moderate (40 to 59)
- strong (60 to 79)
- MAJOR POOL (80 and above)
The score isn't a black box. It's built from four things you'd weigh yourself if you had the time, and you can see exactly what goes into it:
- Touch count: how many times the price has respected the level. More touches mean more stops stacked up there, so this carries the most weight. A level hit four times is a bigger pool than one hit twice.
- Tightness: how cleanly the touches line up. Three highs sitting within a couple of points is a denser, more reliable pool than three smeared across a wider band.
- Recency: how fresh the level is. A pool touched recently is more likely to be on the market's radar than one that's been sitting untouched for a long stretch, so older levels fade in the score.
- Prominence: how significant the swings are. Big, clear pivots leave more resting orders behind them than tiny local wiggles, so a level built from meaningful swings ranks higher.
Put together, that gives you an instant read on the chart. Instead of staring at a wall of equal highs and lows, wondering which one price is hunting, you can see at a glance that the level tagged MAJOR POOL is the one to respect, and the weak two-touch level from last week probably isn't.
And if you want an even cleaner chart, there's a minimum score filter. Set it, and anything below your threshold simply won't be drawn, leaving only the pools strong enough to bother with.
Active, Swept, or Broken: Every Level Tells You Its Status
Drawing a level is one thing. Knowing what price actually did when it got there is what you trade on. This indicator tracks the life of every pool and changes how it looks the moment its status changes, so a glance tells you where things stand.
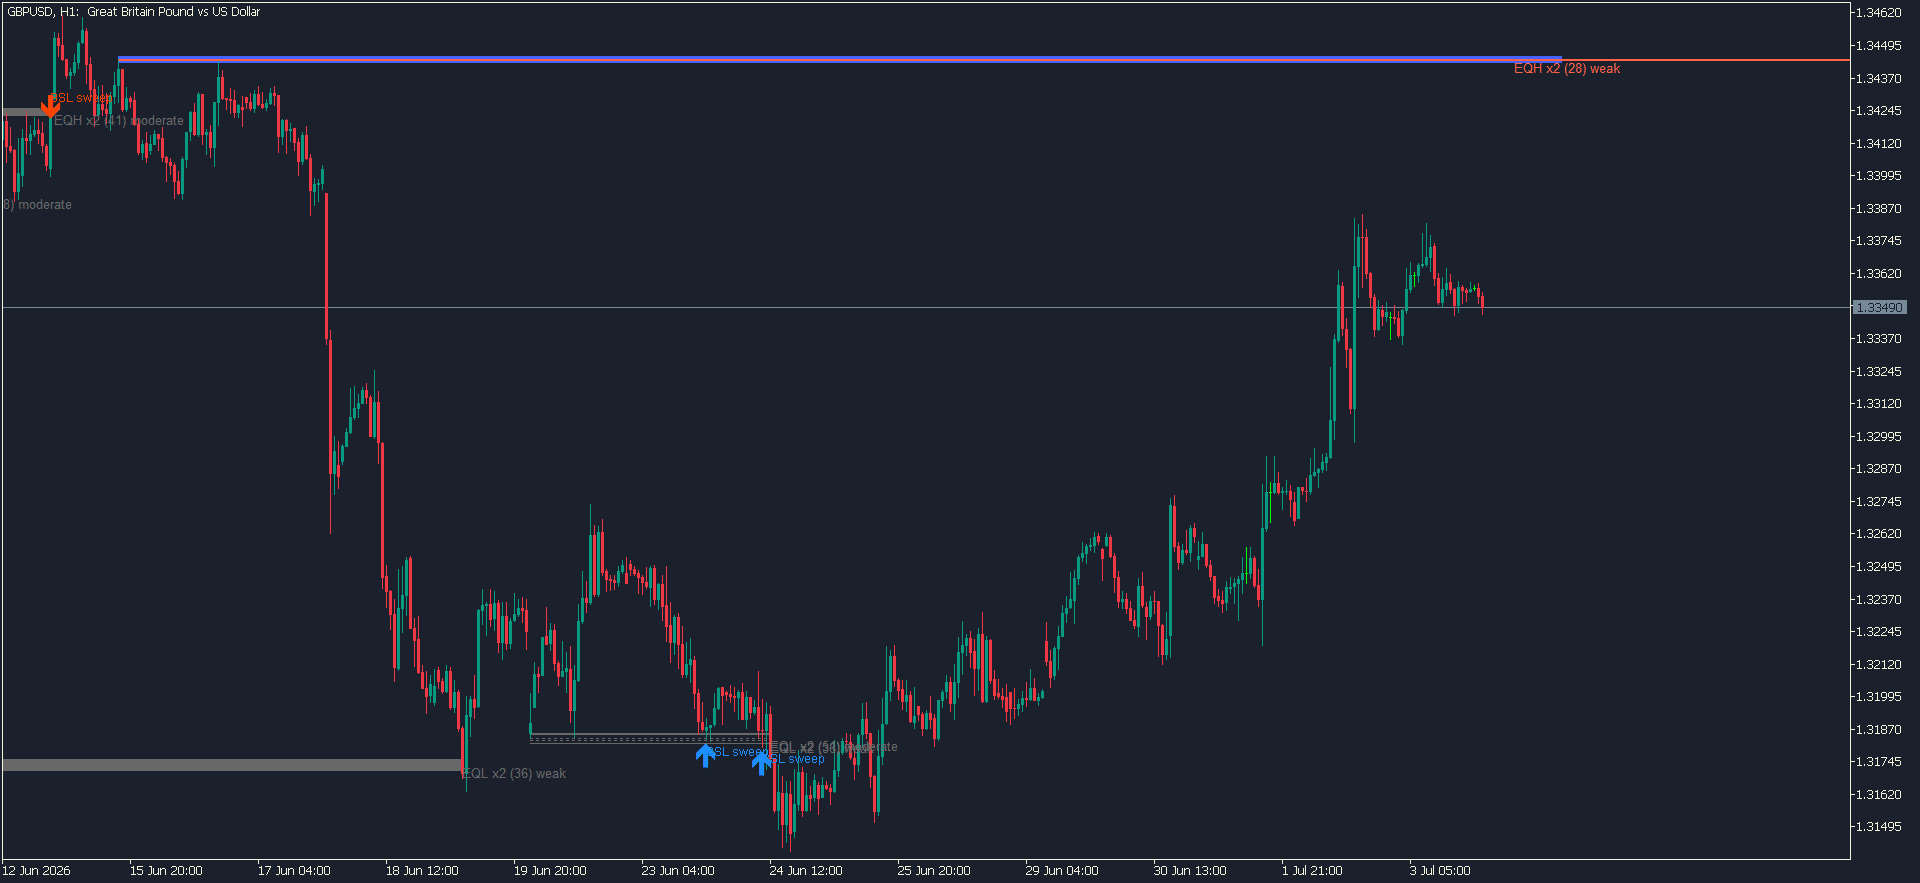
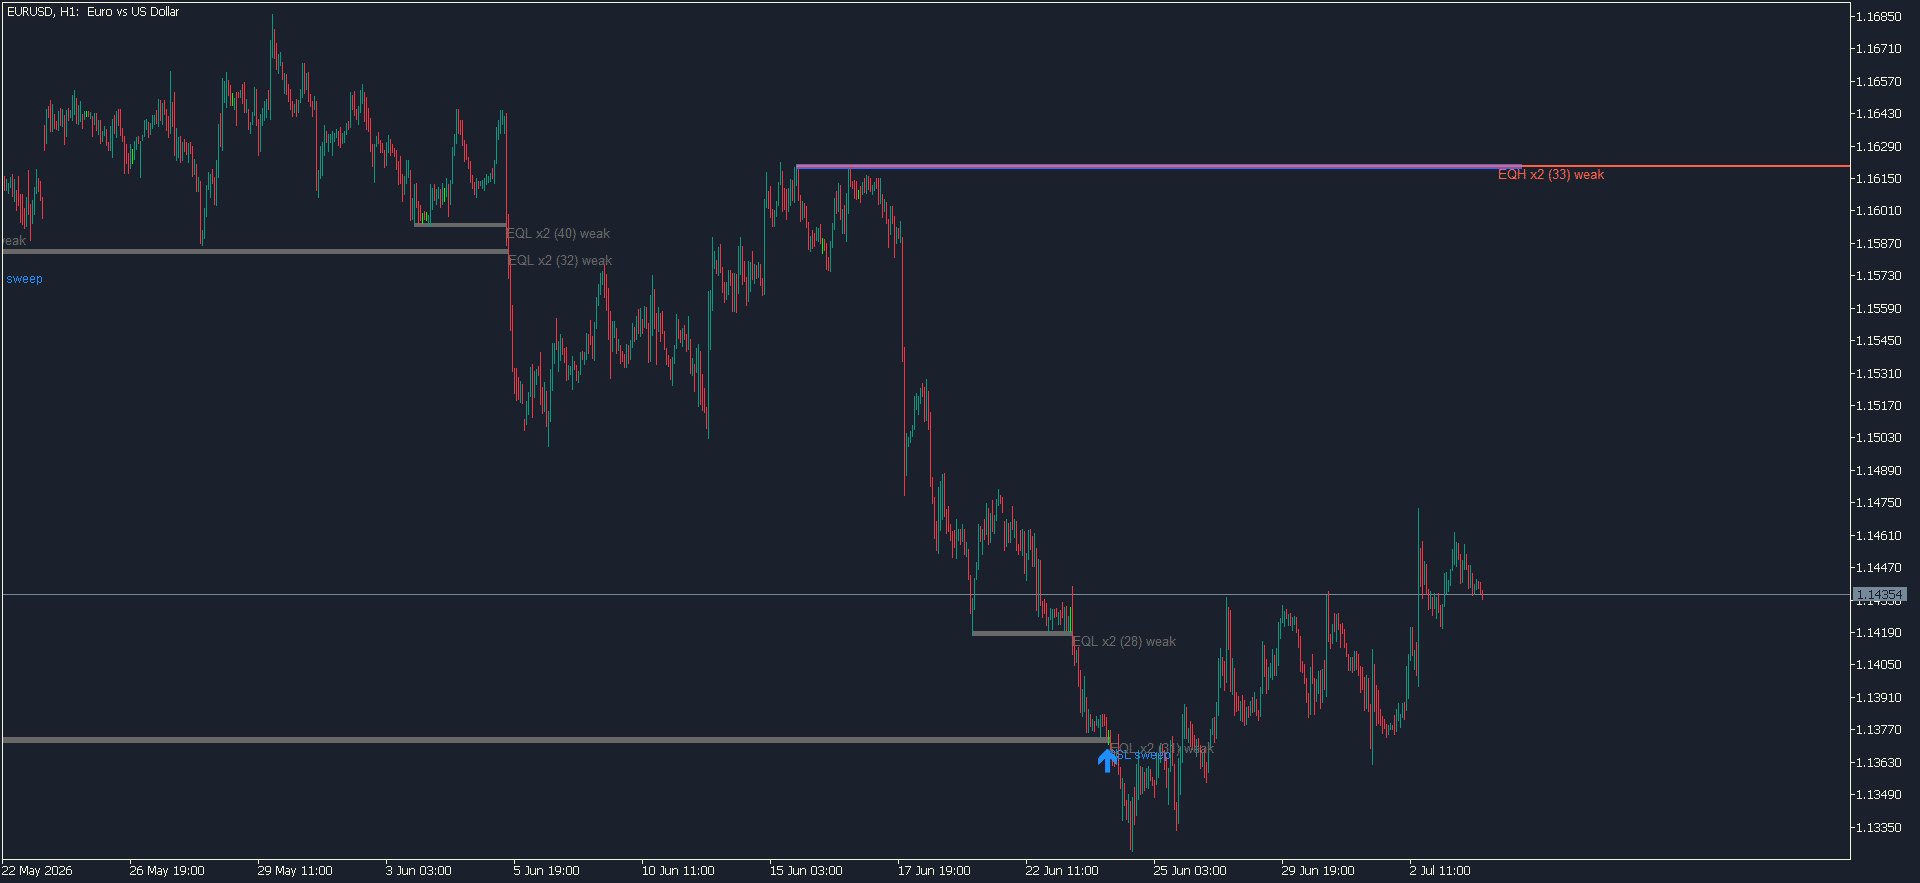
Active: A fresh, untouched pool shows as a solid line extending to the right. This is resting liquidity that hasn't been tapped yet. Equal highs use one colour, equal lows another, so buy-side and sell-side read apart instantly.
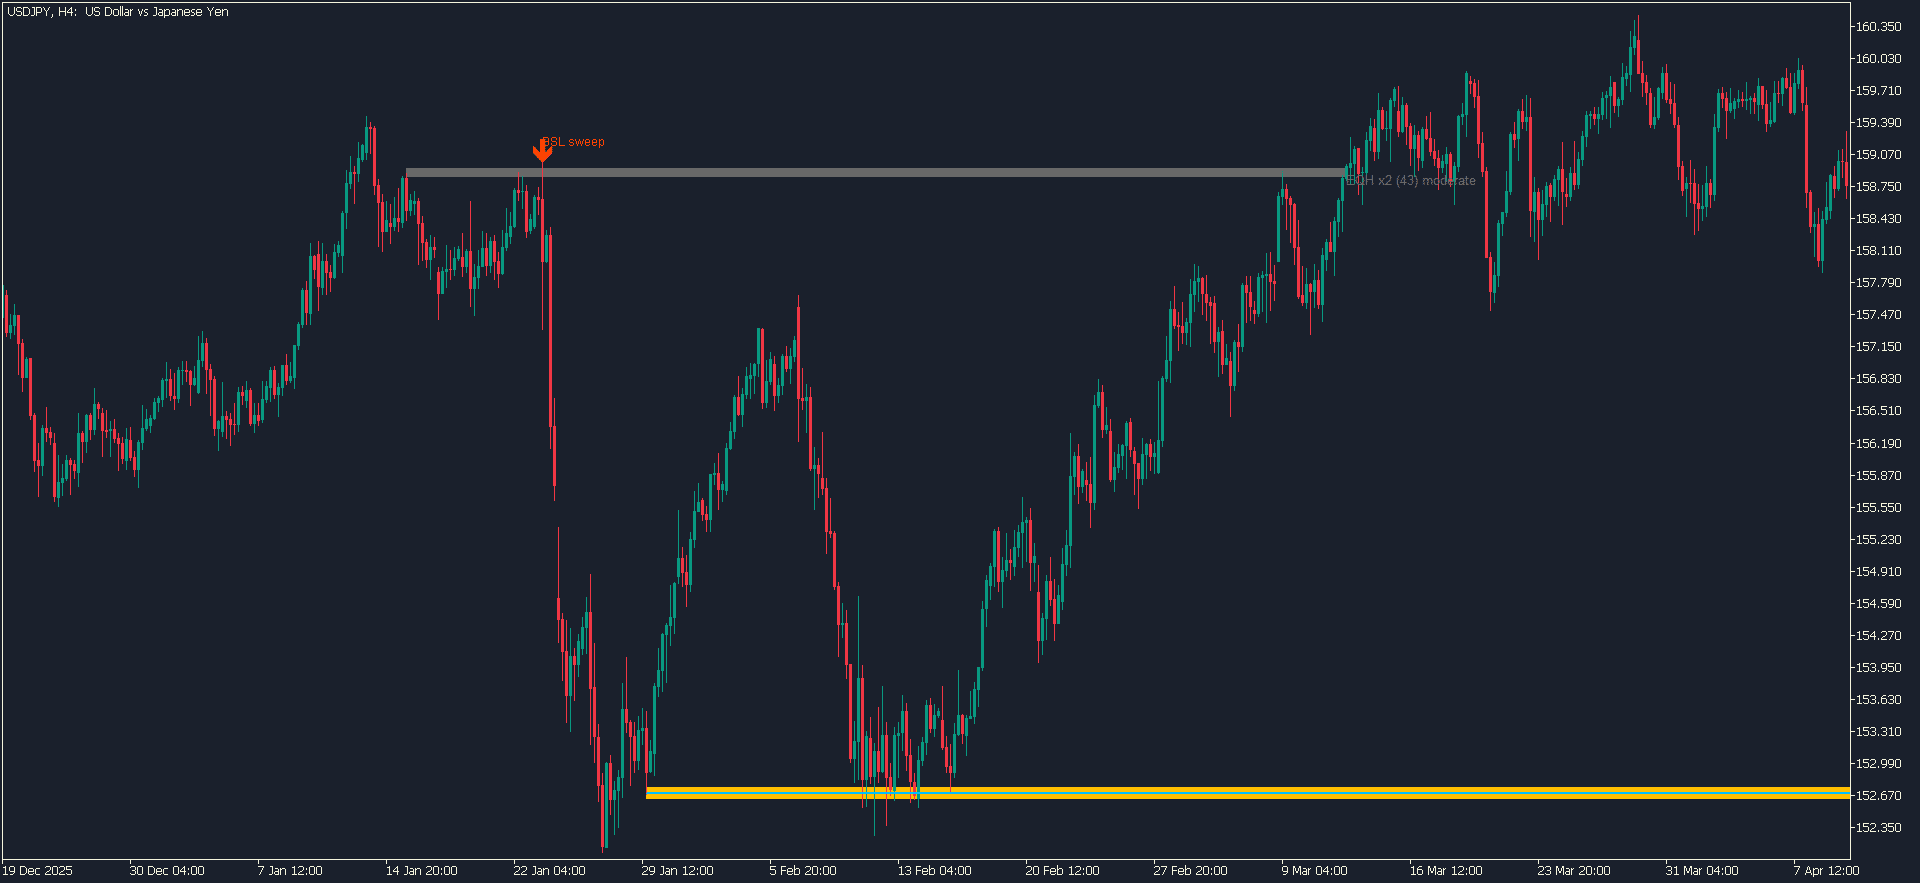
Swept: This is the moment most liquidity traders are waiting for. A sweep happens when the price wicks past the level, but the candle closes back on the original side, running the stops beyond an equal high or equal low without actually accepting up there.
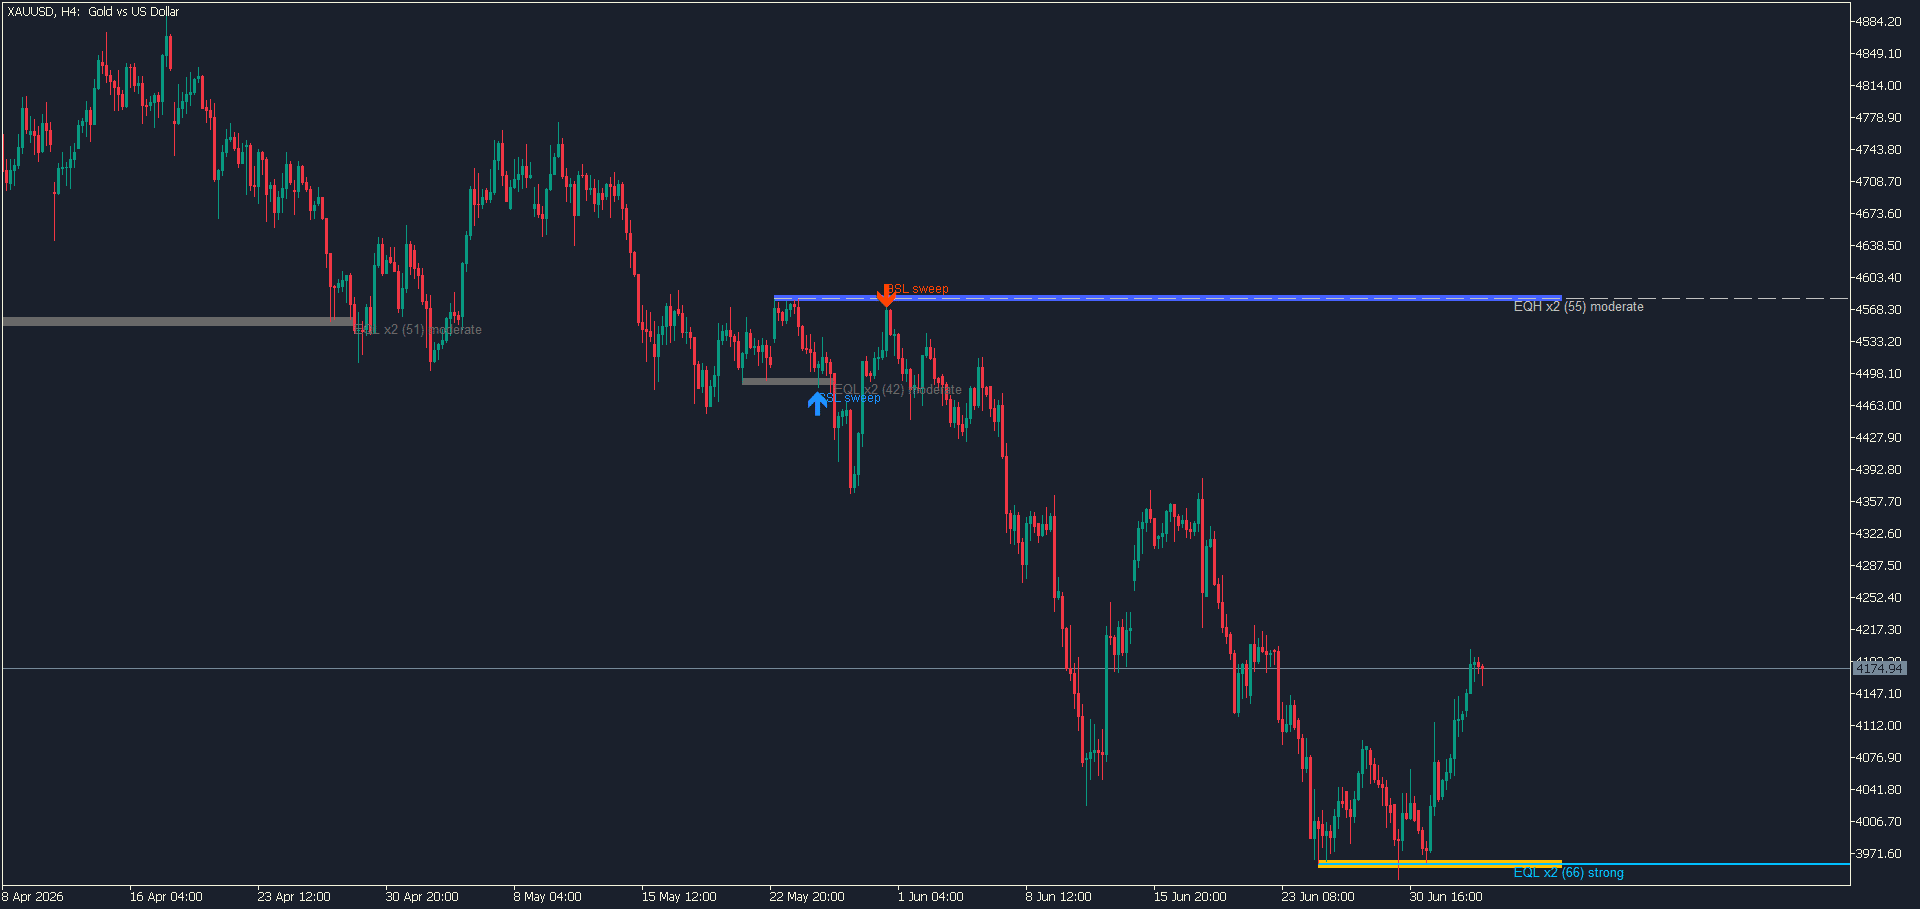
The classic liquidity grab. When it happens, the line turns silver and dashed, and a marker drops at the sweep. Equal-high sweeps are tagged BSL sweep (buy-side liquidity taken), equal-low sweeps are SSL sweep (sell-side liquidity taken).
A wick sweep that closes back inside is what a lot of traders watch for as a possible reversal or displacement cue, especially at a higher-timeframe level of interest.
Broken: A break is a different animal from a sweep, and the indicator is careful not to confuse the two. A level is only broken when a candle closes decisively through it, not when a wick pokes past.
That's price acceptance beyond the liquidity, so the old pool is spent. The line turns grey and dotted and stops extending forward, marking it as history rather than something live.
That distinction between a wick sweep and a real close-through is the whole game with liquidity, and it's baked into how the indicator behaves. A wick past the level that snaps back means the liquidity got taken without acceptance, often the tell before a turn.
A close beyond it means the market genuinely wanted through. Seeing the two treated differently automatically saves you from mistaking one for the other in the heat of a move.
Liquidity Zones and On-Chart Labels
Liquidity rarely gets respected at one exact price. Sweeps and reactions tend to happen around a small band, not a single tick, so trading off one hairline level sets you up to get shaken out by a few points of noise. The indicator handles this by drawing a shaded zone around each pool instead of just a bare line.
The zone gives you an area to watch rather than a price to obsess over. Its width is based on the tolerance of the touches that formed the pool, so tight, clean levels get a tight band and looser ones get a slightly wider one.
The shading sits low and soft in the background, marking the region without taking over your chart. If you prefer the bare lines, you can switch the zones off entirely.
Each pool also carries a label that packs its whole story into a few characters:
- EQH x2 (64) strong: An equal high, touched twice, scoring 64, rated strong
- EQL x3 (81) MAJOR POOL: An equal low, touched three times, scoring 81, a major pool
So the label tells you what kind of level it is, how many times the price has respected it, its 0-to-100 score, and its strength tag all at once. You don't have to count touches or judge quality yourself; it's right there next to the level. And like the zones, the labels toggle off if you'd rather keep things minimal.
Between the colour-coded lines, the shaded zones, and the labels, the chart reads at a glance: what's active, what's been swept, what's been broken, and which pools are worth your attention.
Alerts So You Don't Have to Watch Every Chart
Nobody can sit on every pair and every timeframe waiting for a level to form or a sweep to hit. The indicator watches for you and speaks up when something worth seeing happens, so you can step away and still catch the moments that matter.
It alerts on two events:
- A new liquidity pool. The moment a fresh equal high or equal low gets confirmed, you know a new pool of liquidity has appeared on that chart.
- A liquidity sweep. When price runs an existing pool and closes back inside, you get told right away. This is usually the setup traders actually care about, so you're not scrolling back later wishing you'd seen it live.
How to Trade With It
The indicator maps liquidity. What you do with that map is where your own read of the market comes in, but here's the shape of how most traders put it to work.
Start by letting it show you where the liquidity is sitting. Equal highs above price are buy-side pools, targets that the price may reach. Equal lows below are sell-side pools it may reach down for.
Straight away, you've got a sense of what the market might be hunting in either direction, and the scores tell you which of those pools are worth taking seriously. A MAJOR POOL is a far more likely magnet than a weak two-touch level, so let the strong tags guide where your attention goes.
The moments that tend to matter most are when price returns to one of these pools and shows its hand:
- A sweep back inside. Price wicks past an equal high or equal low, takes the stops resting there, then closes back on the original side. The liquidity was taken without acceptance beyond the level. Many traders watch this as a possible reversal cue, most of all when it lines up with a higher-timeframe level of interest, and they'll look for their own confirmation, a shift in structure, a strong candle back through, before acting rather than trading the sweep blind.
- A decisive close through. Price closes cleanly beyond the level instead of rejecting from it. That's acceptance, the market genuinely wanted it, and the old pool is spent. Depending on your approach, that can be a continuation read or simply a sign to stop treating that level as live.
A couple of habits make it work better. Higher timeframes usually give the cleanest equal highs and equal lows, so a sweep on the 4-hour or daily tends to carry more weight than one on the 1-minute. And the tool is at its best as one layer of confluence, not a standalone trigger.
Line a swept pool up with your market structure, your session timing, an order block, or a fair value gap, and you've got a real setup. On its own, it's telling you where the fuel is, not when to pull the trigger.
Settings
The defaults are tuned to work sensibly out of the box, so you can attach the indicator and start reading your chart right away. When you want to fine-tune it, here's what each setting does.
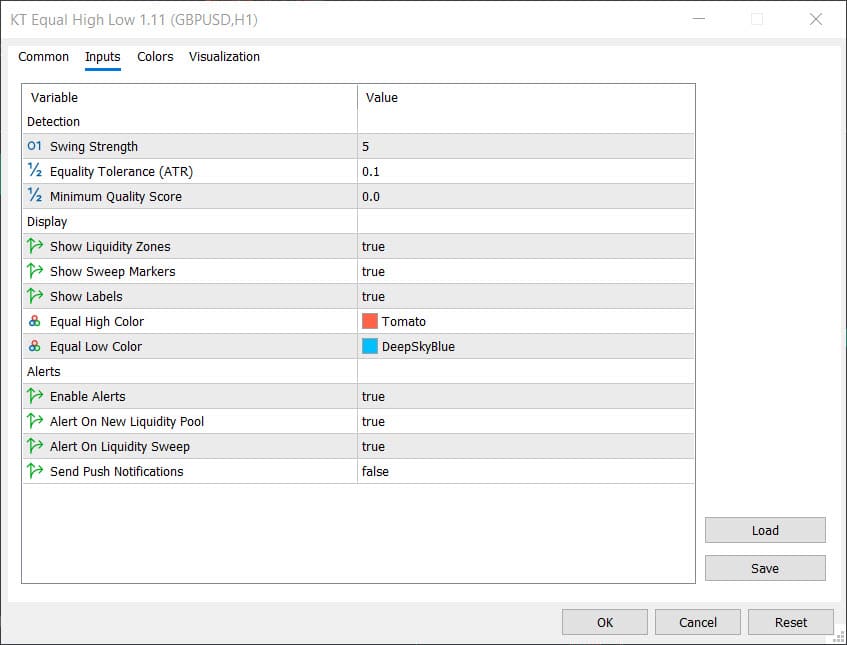
Detection
- Swing Strength: how strict the swing detection is. Higher values give you fewer but more significant pivots; lower values pick up more frequent, smaller ones. Default suits most charts.
- Equality Tolerance (ATR): how close two highs or two lows must be to count as equal. Raise it to catch looser structures and more pools, lower it to demand cleaner equality.
- Minimum Quality Score: hides any pool scoring below the number you set. Leave it at zero to see everything, or raise it to keep only the stronger levels on screen.
Display
- Show Liquidity Zones: turns the shaded band around each pool on or off.
- Show Sweep Markers: shows or hides the sweep arrows and their labels.
- Show Labels: shows or hides the text labels with touch count, score, and strength.
- Equal High Colour / Equal Low Colour: set the colours for active EQH and EQL levels to match your chart.
Alerts
- Enable Alerts: the master switch for everything below.
- Alert On New Liquidity Pool: pings you when a fresh pool is confirmed.
- Alert On Liquidity Sweep: pings you when a pool gets swept.
- Send Push Notifications: sends the same alerts to your phone, once you've set up push notifications in MetaTrader.
Most traders never need to touch more than the tolerance and the minimum score. Those two alone let you swing between a busy chart showing every pool and a clean one showing only the heavy hitters.
What This Indicator Is, and What It Isn't
Worth being straight about this, because plenty of tools in this space aren't. KT Equal Highs & Equal Lows is a liquidity-mapping tool. It shows you where resting liquidity is likely sitting and tracks what price does when it gets there. It is not a buy or sell signal, and it won't tell you when to enter a trade.
The traders who get the most out of this are the ones who fold it into their existing read, higher-timeframe bias, market structure, session timing, order blocks, fair value gaps, support and resistance, rather than treating any single sweep as a setup by itself.
A few things worth knowing so nothing surprises you:
- Levels appear after confirmation, not instantly. Because swings need candles to close on both sides before they're confirmed, a new level shows up a few bars after the actual high or low. That's deliberate. It's the trade-off that keeps the indicator from repainting and drawing levels that vanish on the next candle.
- The same settings behave differently across markets. Since the tolerance adapts to ATR, a setup that looks one way on a quiet forex pair will look different on gold or an index. That's a feature, it's adapting to volatility, but it's why it's worth a quick look at how it reads on each symbol you trade.
- The score is a guide, not a guarantee. It ranks pools by qualities that tend to matter, touches, tightness, freshness, and prominence, so you can prioritise. It's a way to sort your chart, not a probability that any given level will hold.
Used the way it's meant to be, as a clean, honest map of liquidity structure, it does one job well: it shows you where the fuel is, so you can bring your own read to when it gets lit.
Map Your Liquidity, Free
If you trade equal highs and equal lows, or you want to start, this puts the whole picture on your chart without the manual work.
Confirmed EQH and EQL pools, a 0-to-100 score so you know which ones matter, live tracking of what's active, swept, or broken, and alerts so you catch the moves you'd otherwise miss. On both MT4 and MT5, any symbol, any timeframe.
It's free to download and yours to keep. Add it to your charts, let it map the liquidity, and see how much cleaner your read gets when you can see exactly where price is likely reaching next.