Key Takeaways
- Order blocks are price zones where buying or selling previously produced a notable reaction; traders often watch them as possible support or resistance.
- The KT Order Block Indicator automatically plots bullish and bearish zones on MT4 and MT5 across the current chart timeframe and two selectable timeframes.
- Use the zones with current price action, technical indicators, and established support and resistance levels. No zone guarantees a reversal.
Understanding Order Blocks
Order blocks are chart areas associated with a strong move away from a price range. When price returns, traders watch the zone for evidence of support, resistance, continuation, or failure.
The indicator does not identify the intentions of specific institutions. It organizes historical price structure into visible zones so traders can evaluate the next reaction more consistently.
Defining Order Blocks
A bullish order block is a potential demand zone formed before a strong upward move. A bearish order block is a potential supply zone formed before a strong downward move. The zone remains a candidate, not a prediction, until current price action confirms or rejects it.
The Role of Order Blocks in Market Structure
Within market structure, order blocks can mark areas where price previously accelerated. Their usefulness depends on context such as trend direction, nearby swing points, freshness of the zone, and what happens when price revisits it.
Impact on Price Action
When price returns to a plotted zone, it may:
- Reject the boundary or midpoint and move away.
- Pause or consolidate inside the zone.
- Break through the zone, weakening or invalidating the setup.
These are observation areas. Define the entry, invalidation point, target, and position size before acting.
Key Features in Detail
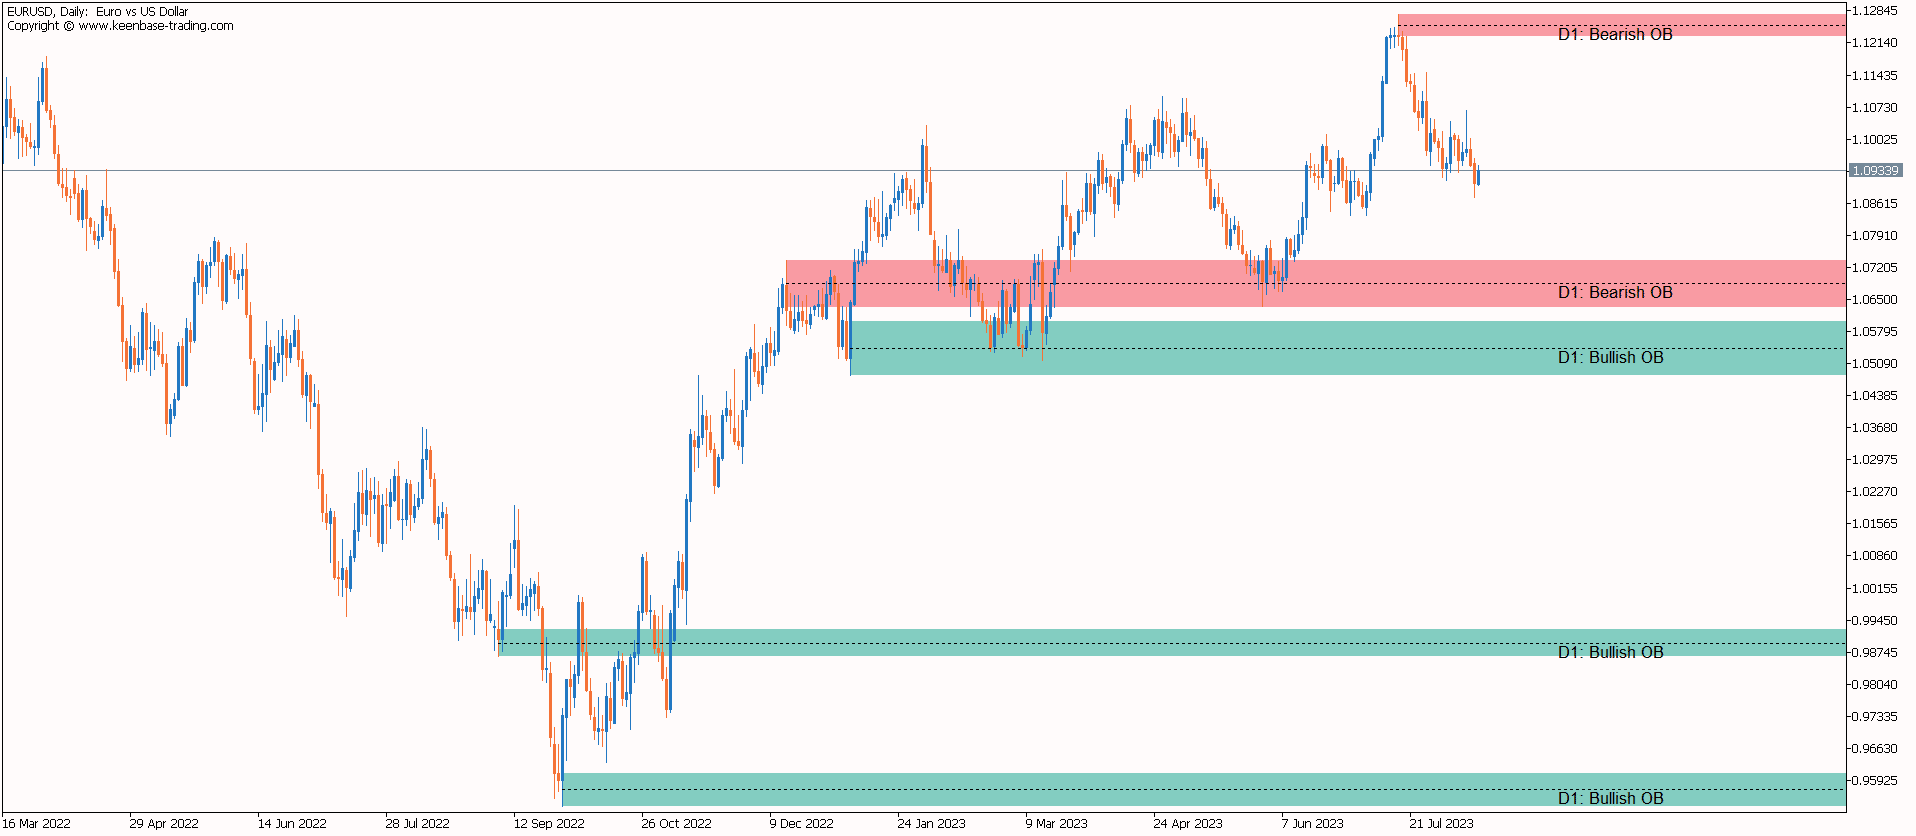
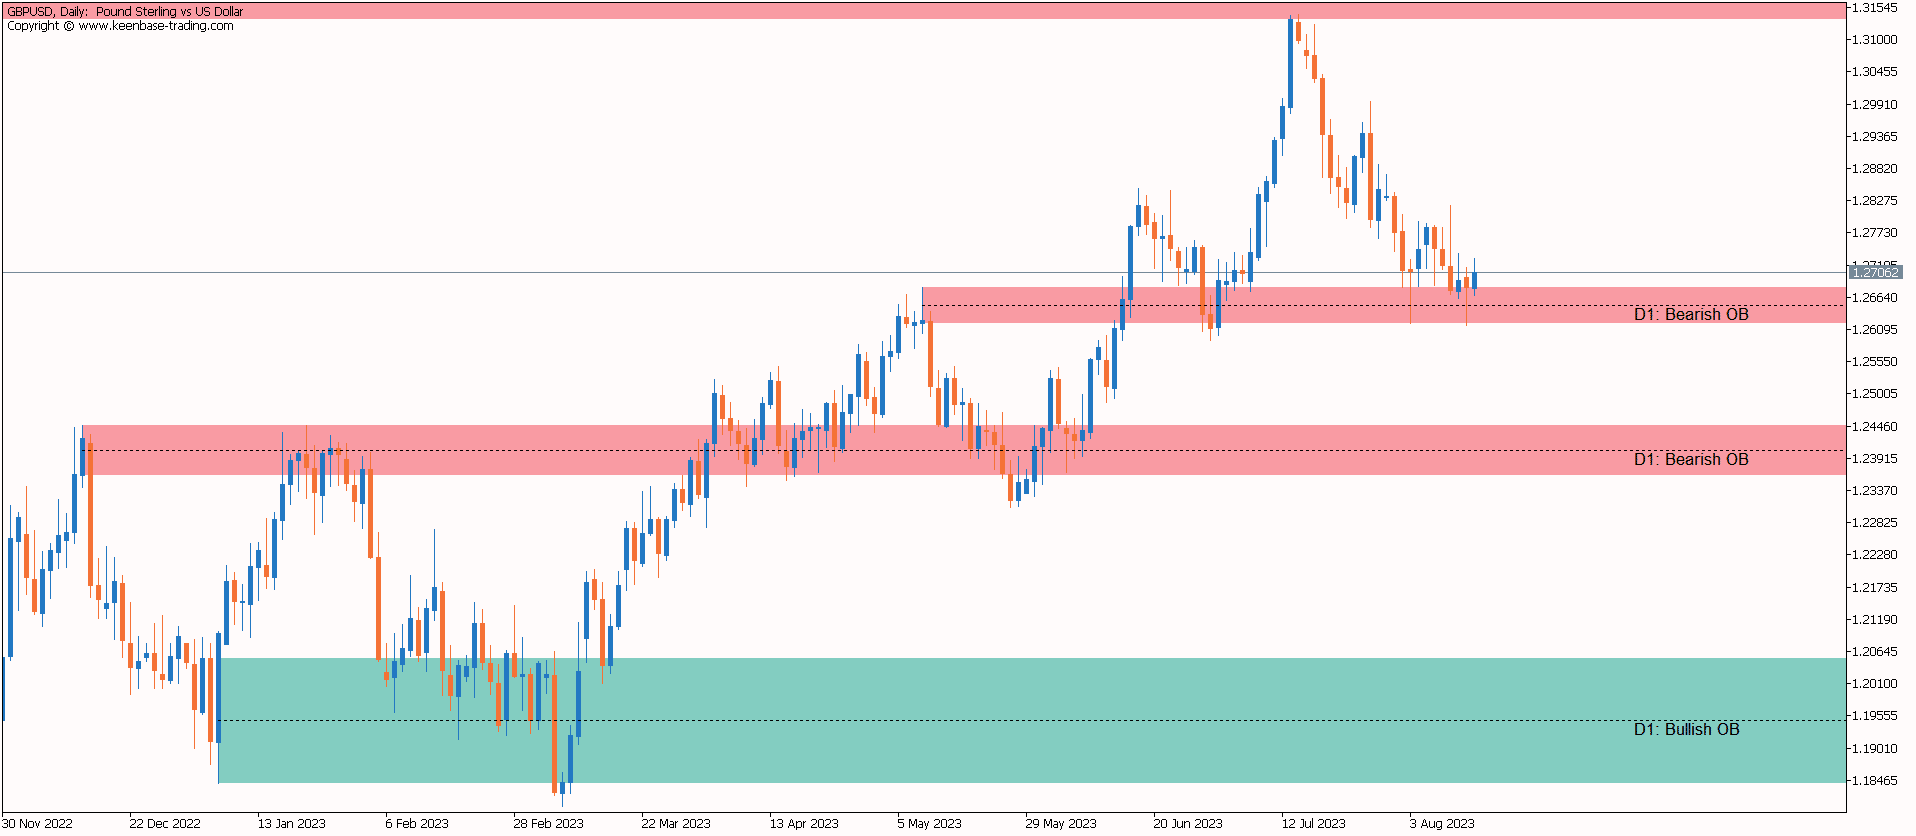
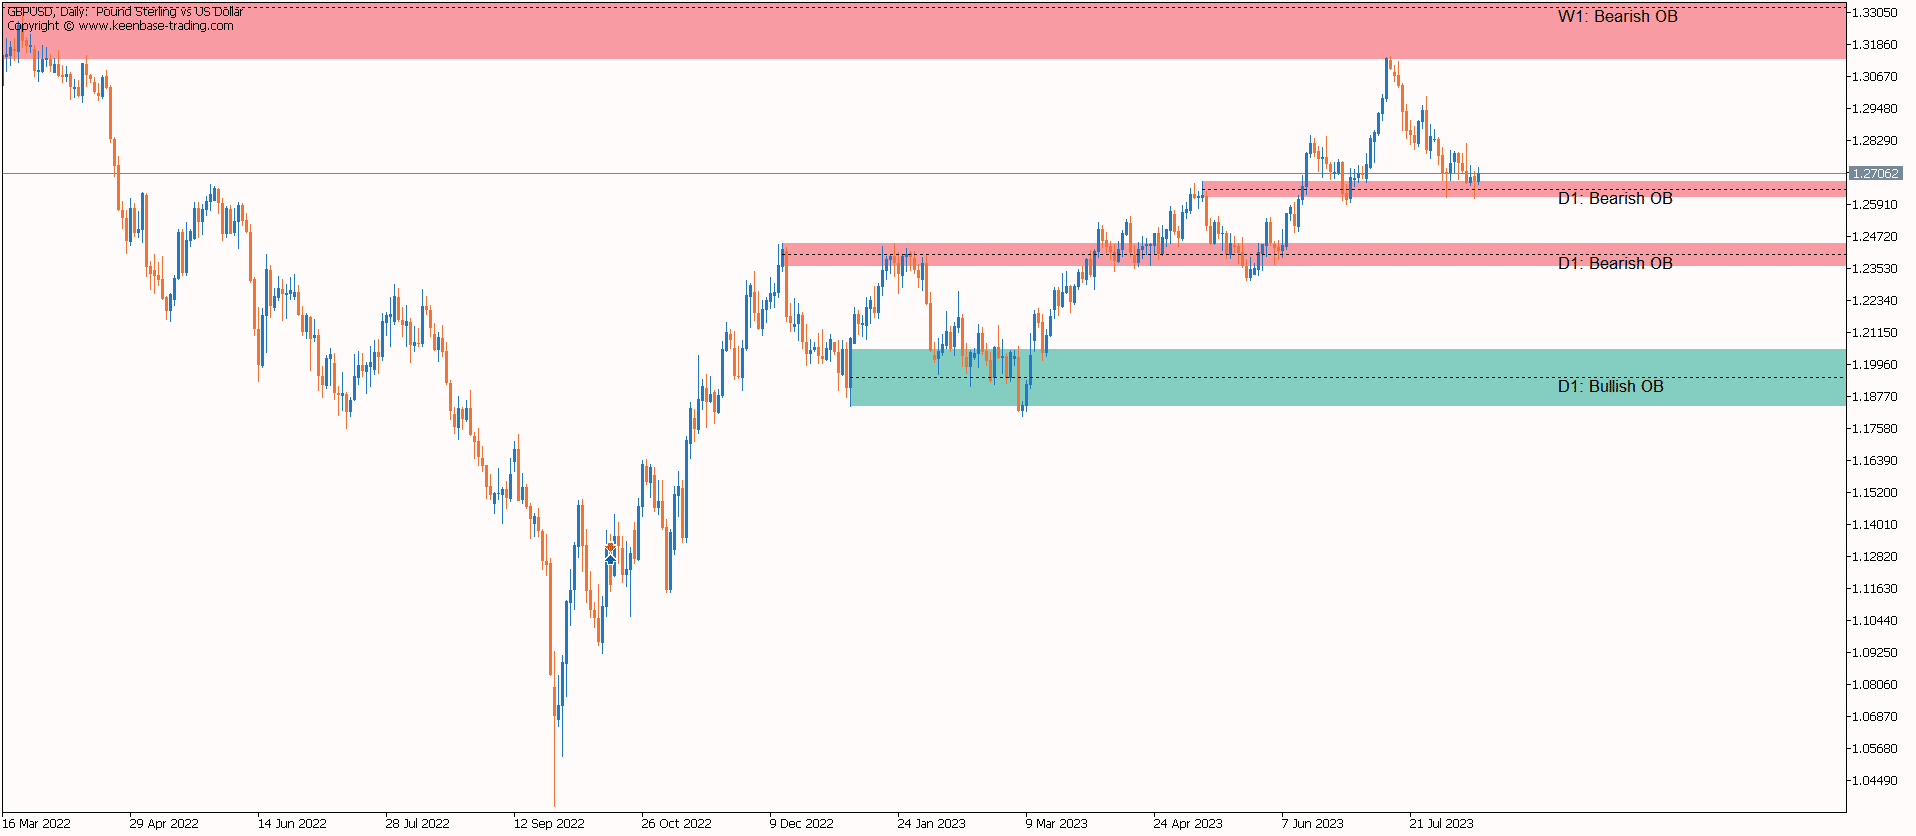
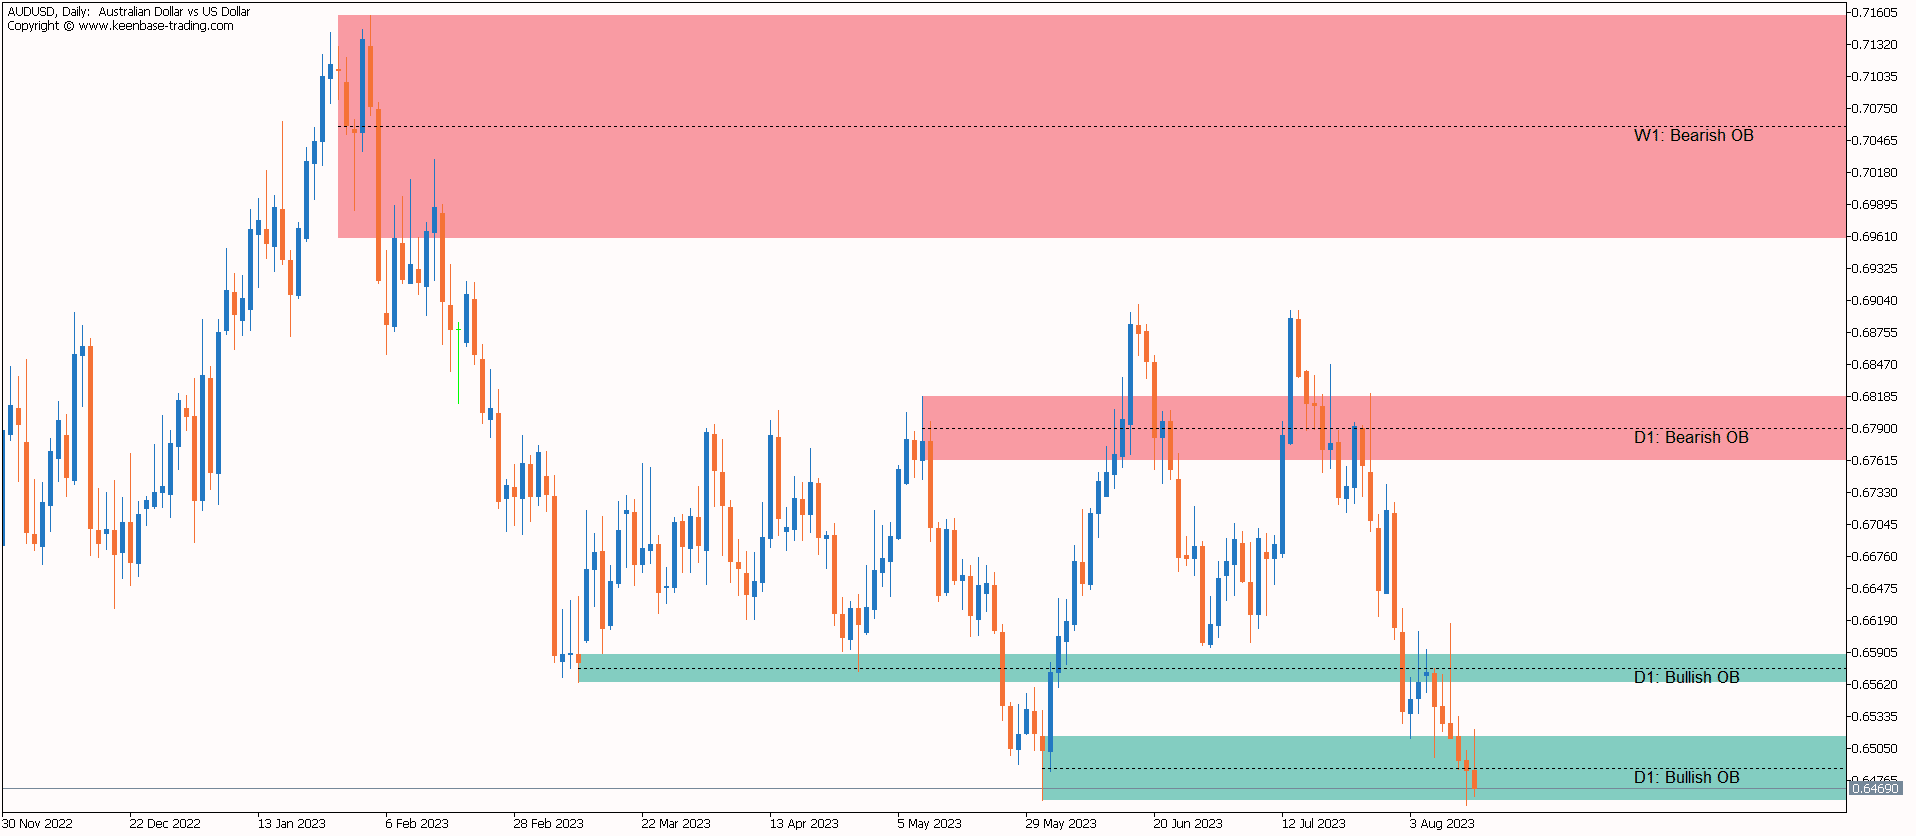
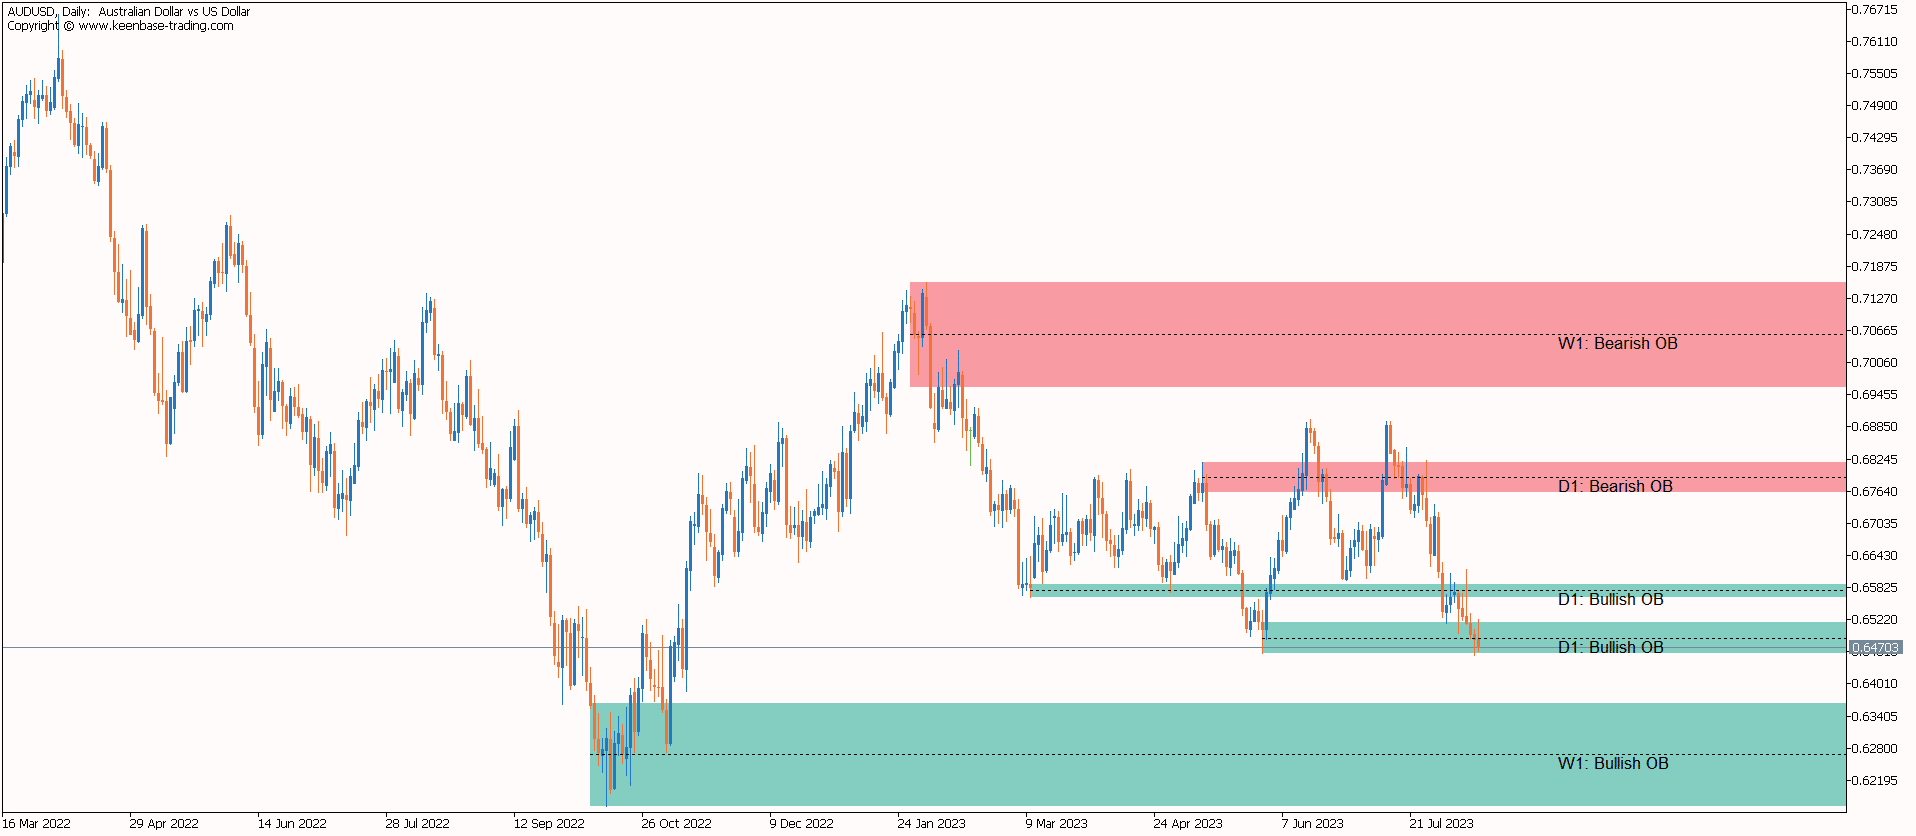
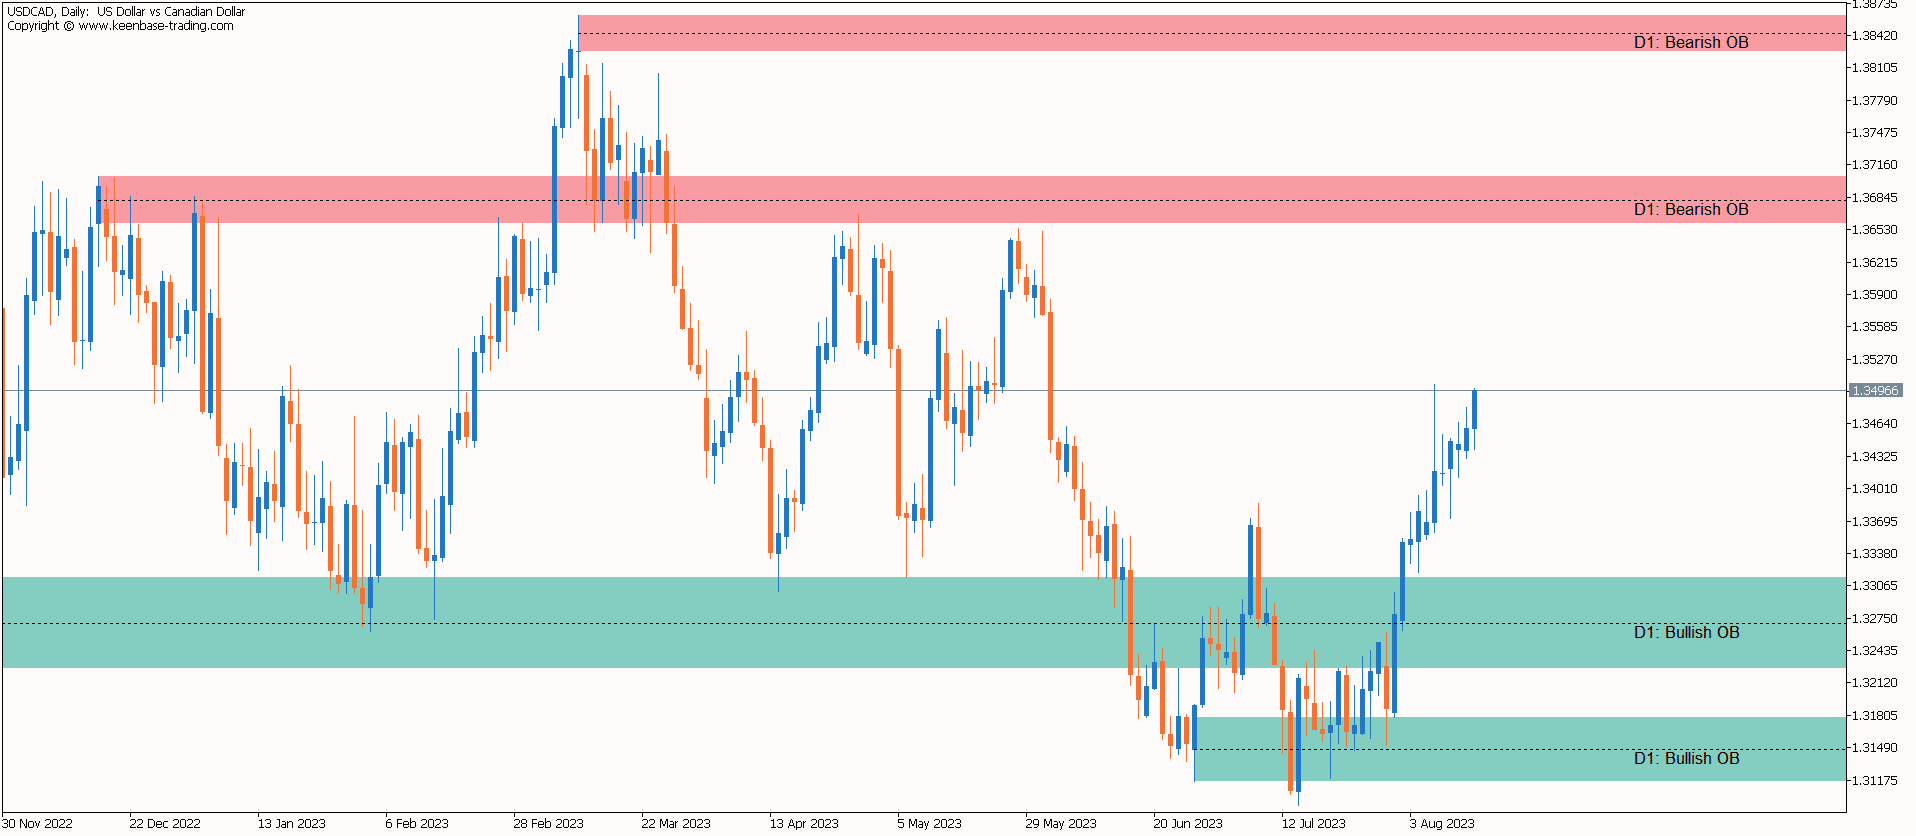
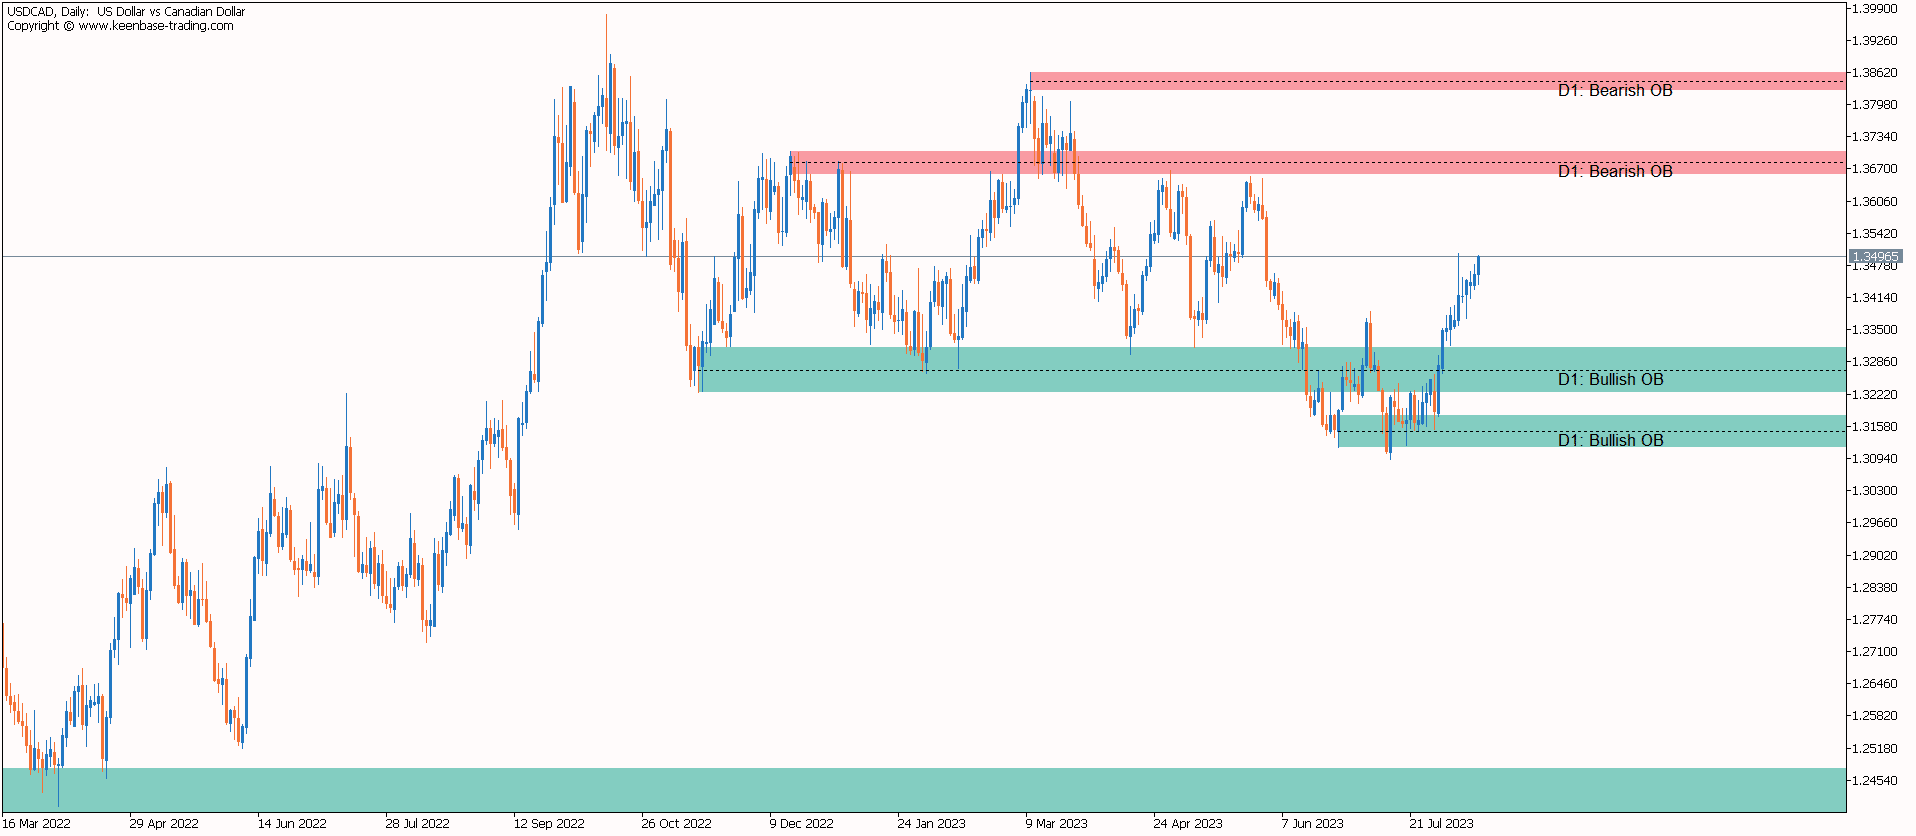
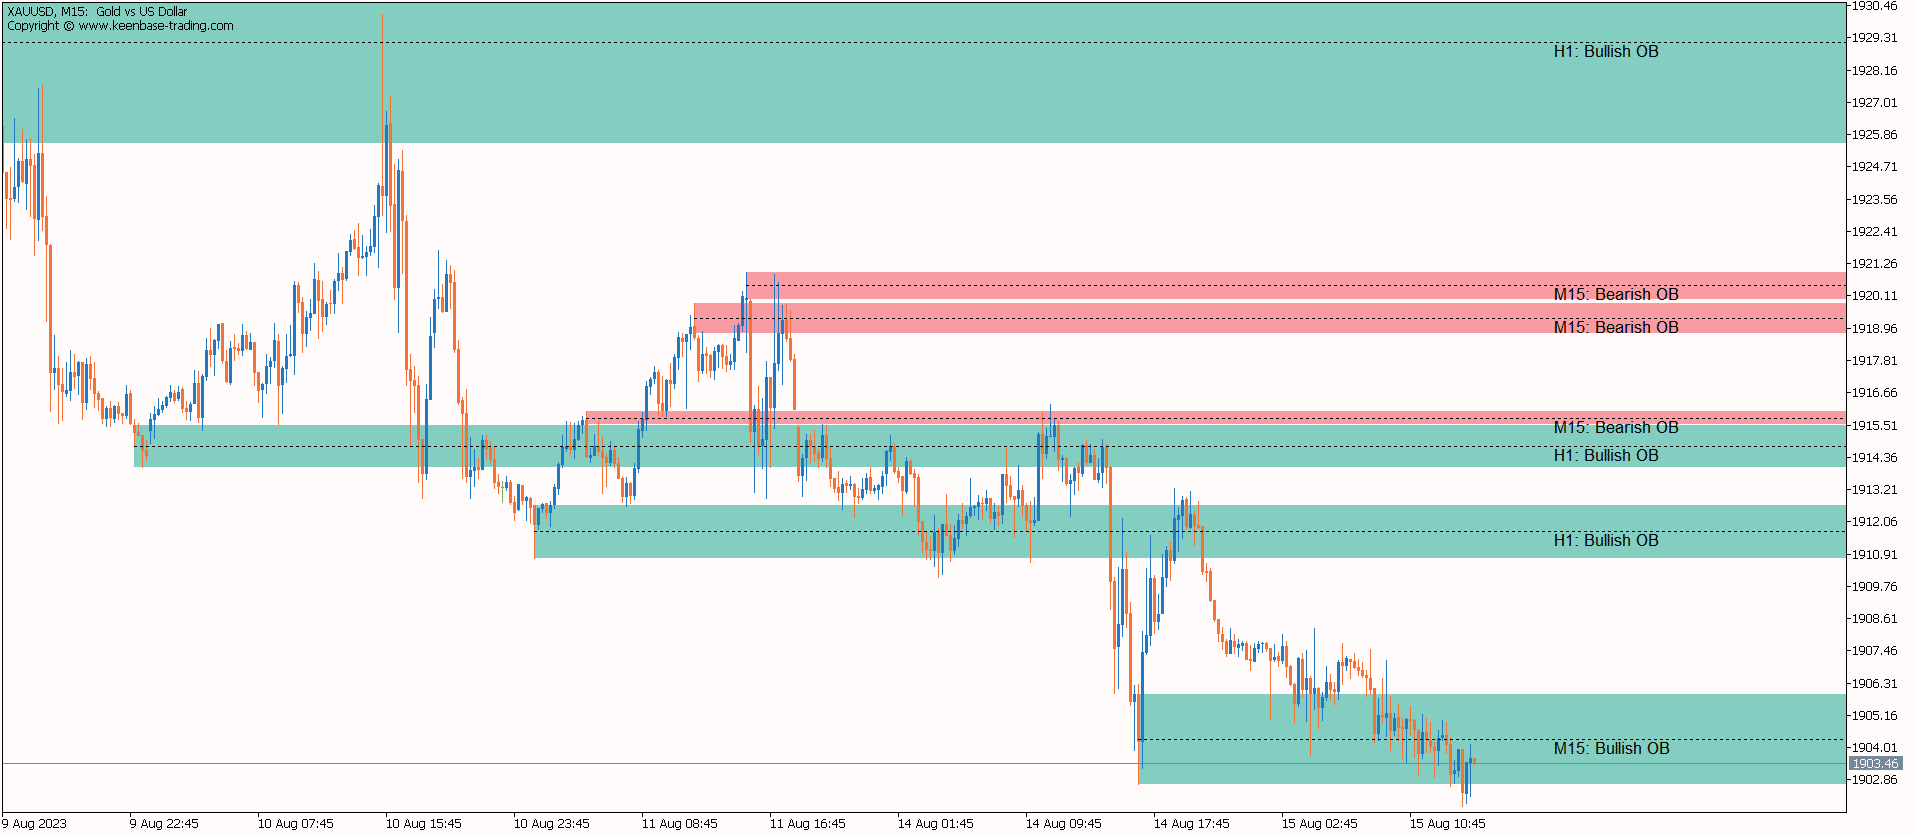
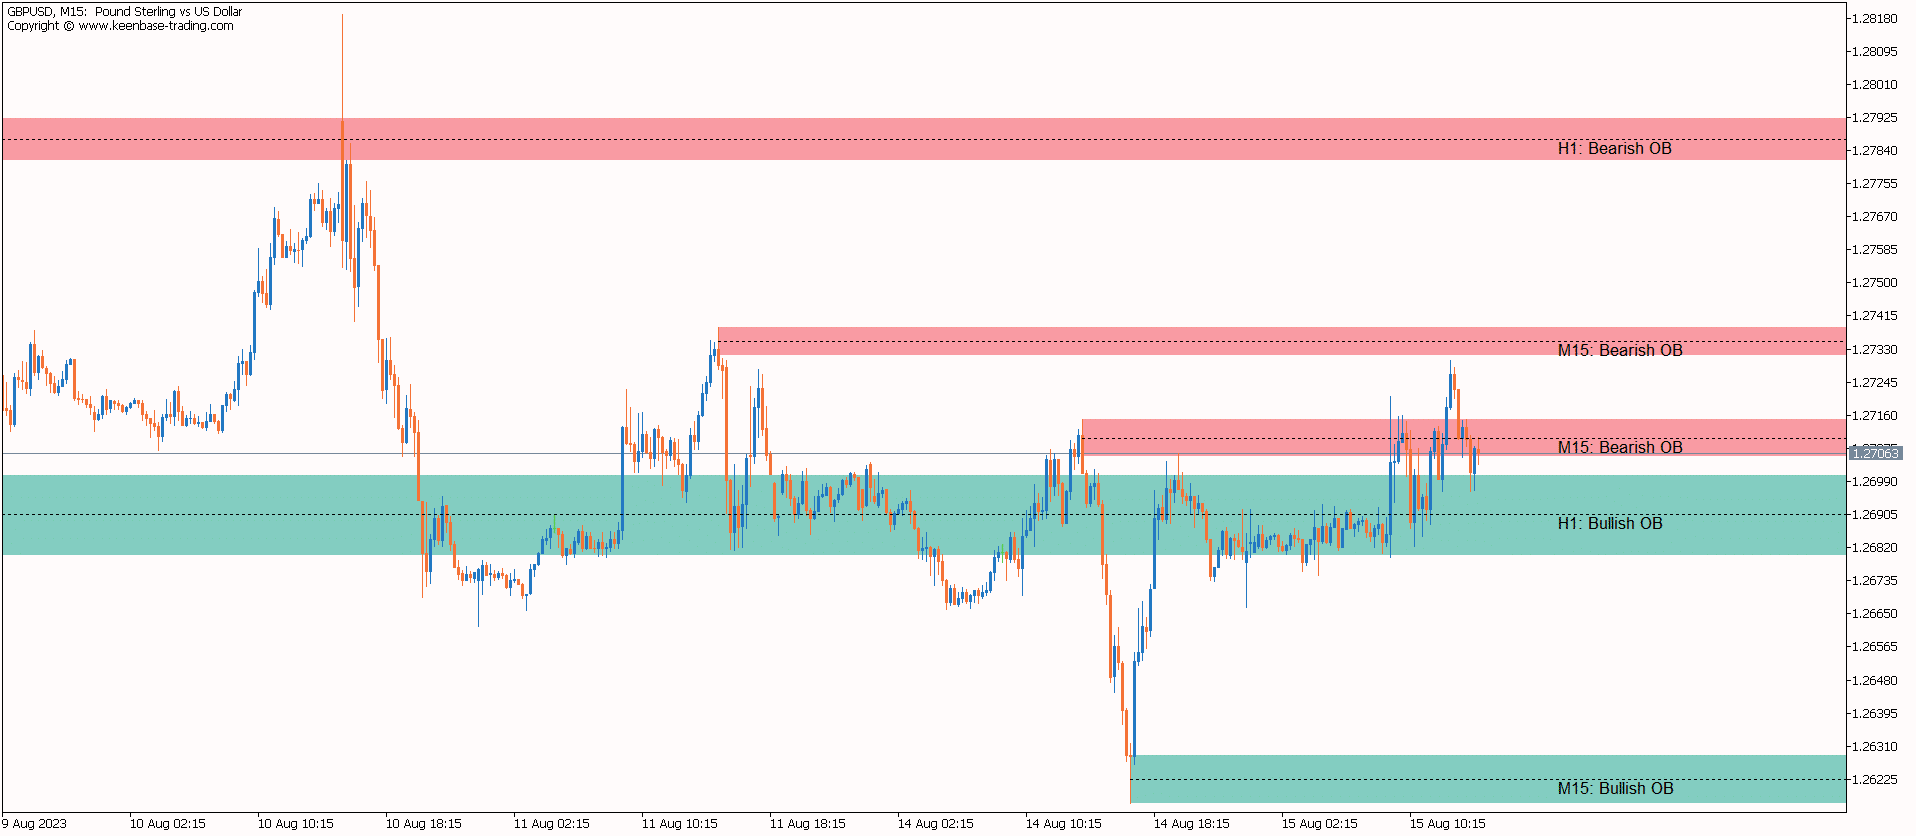
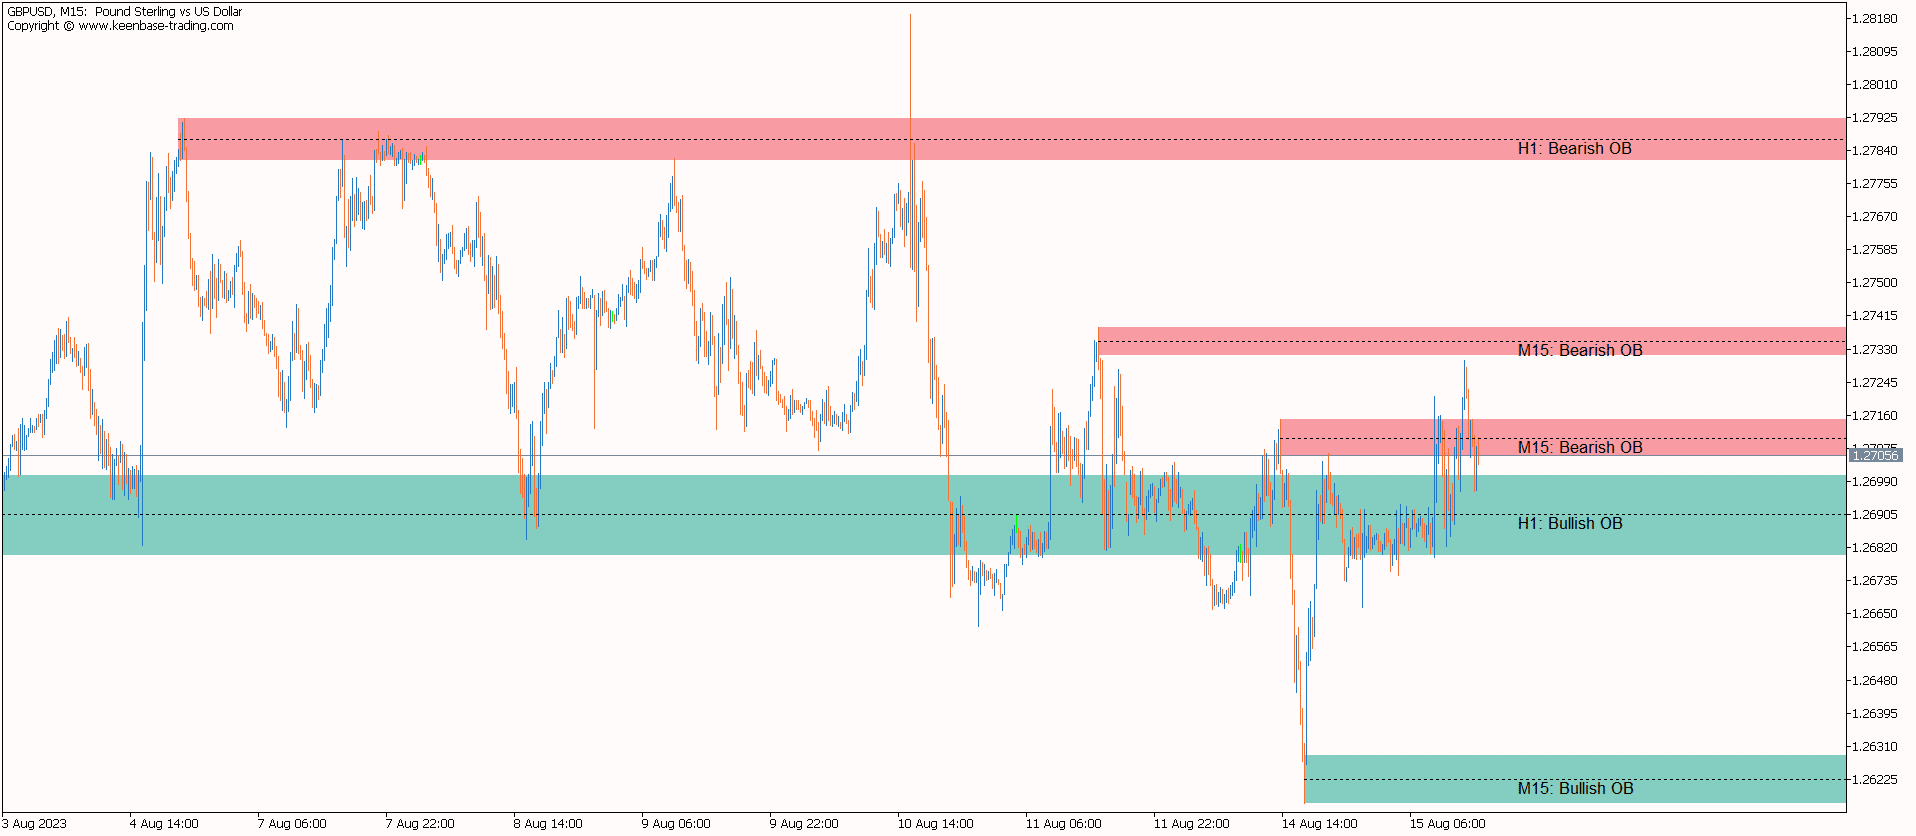
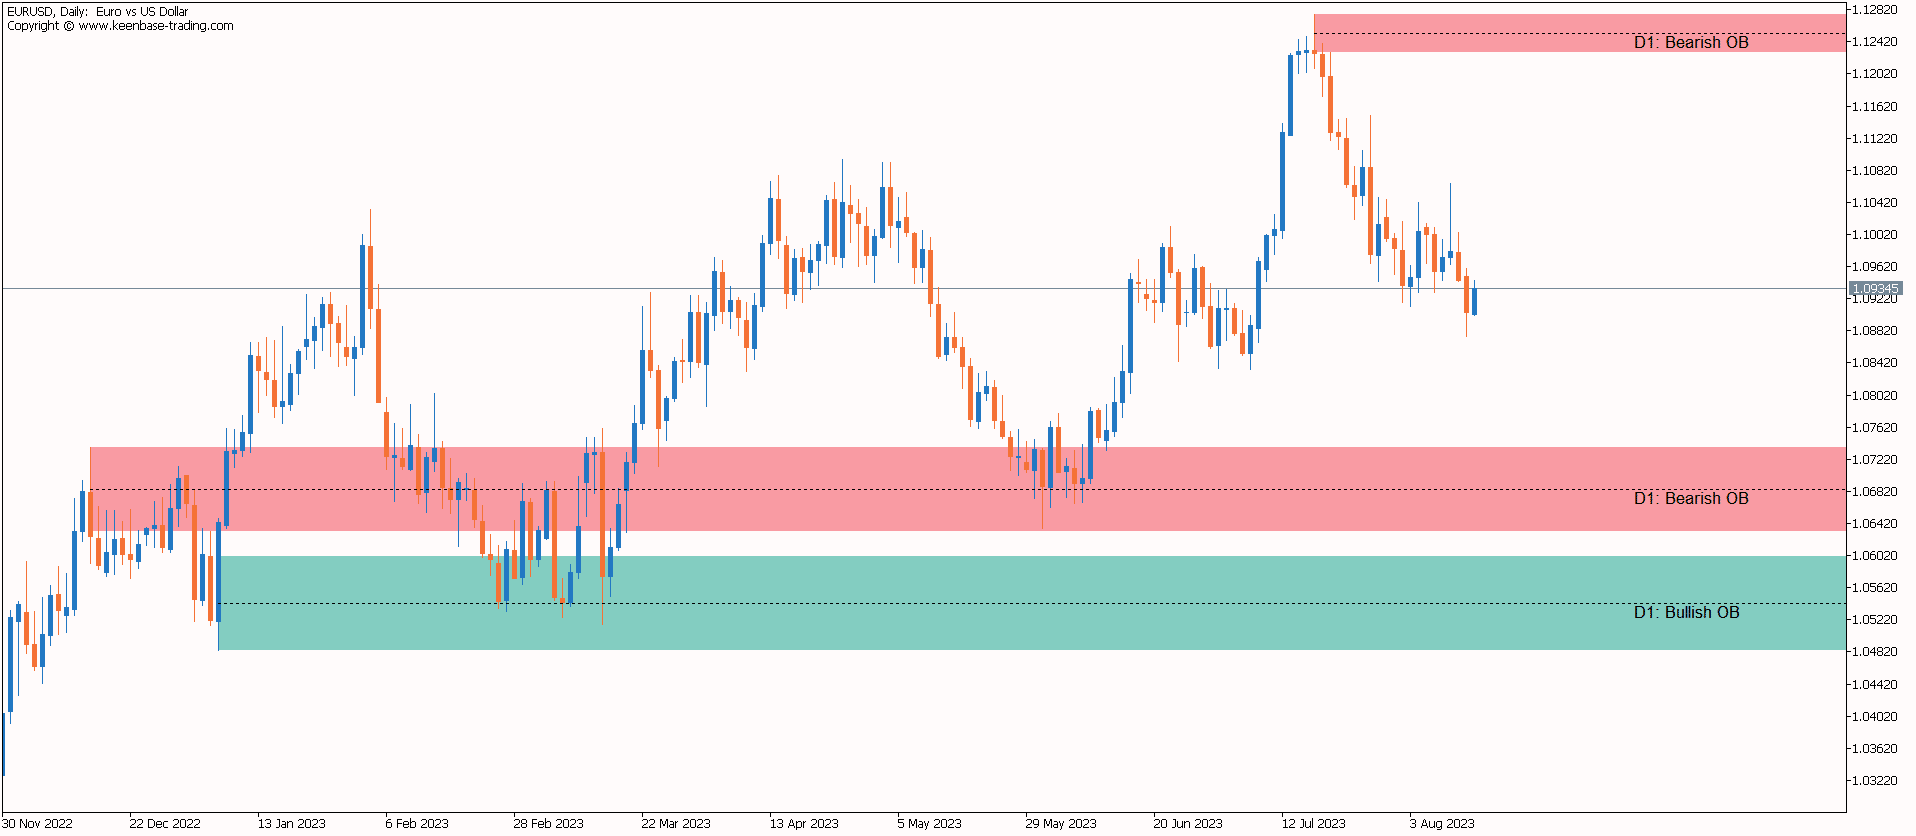
The KT Order Block Indicator plots bullish and bearish order-block zones as color-coded rectangles on MT4 and MT5. It can display the current chart timeframe plus two user-selected timeframes, for three timeframes in total.
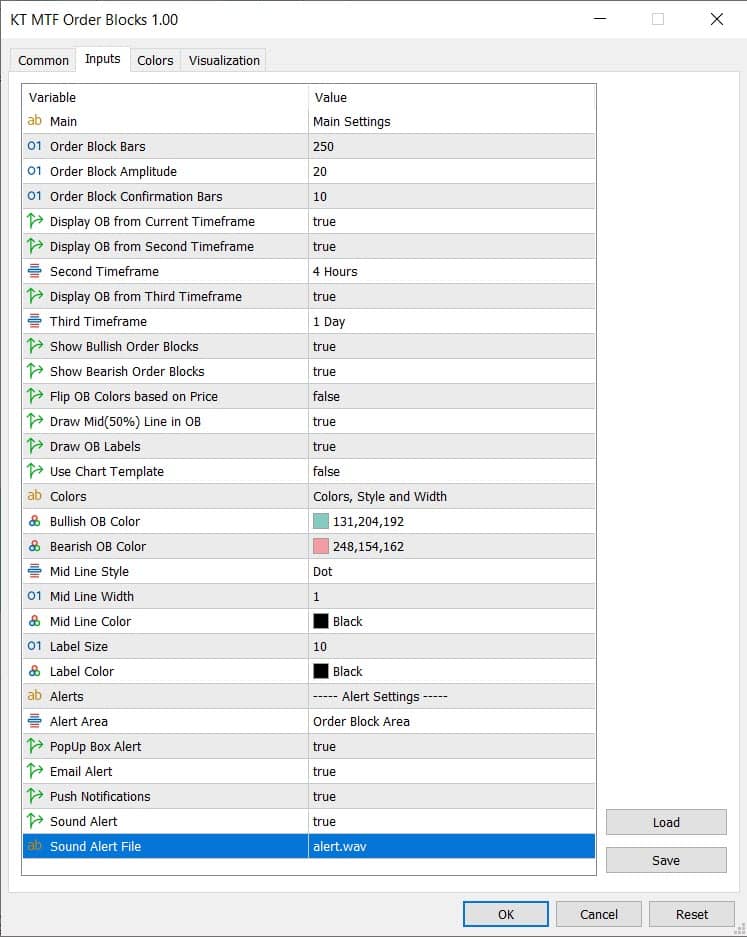
Each zone can include an optional 50% midpoint line and timeframe label. Users can show or hide bullish and bearish zones, choose colors and line styles, and optionally flip zone colors based on current price.
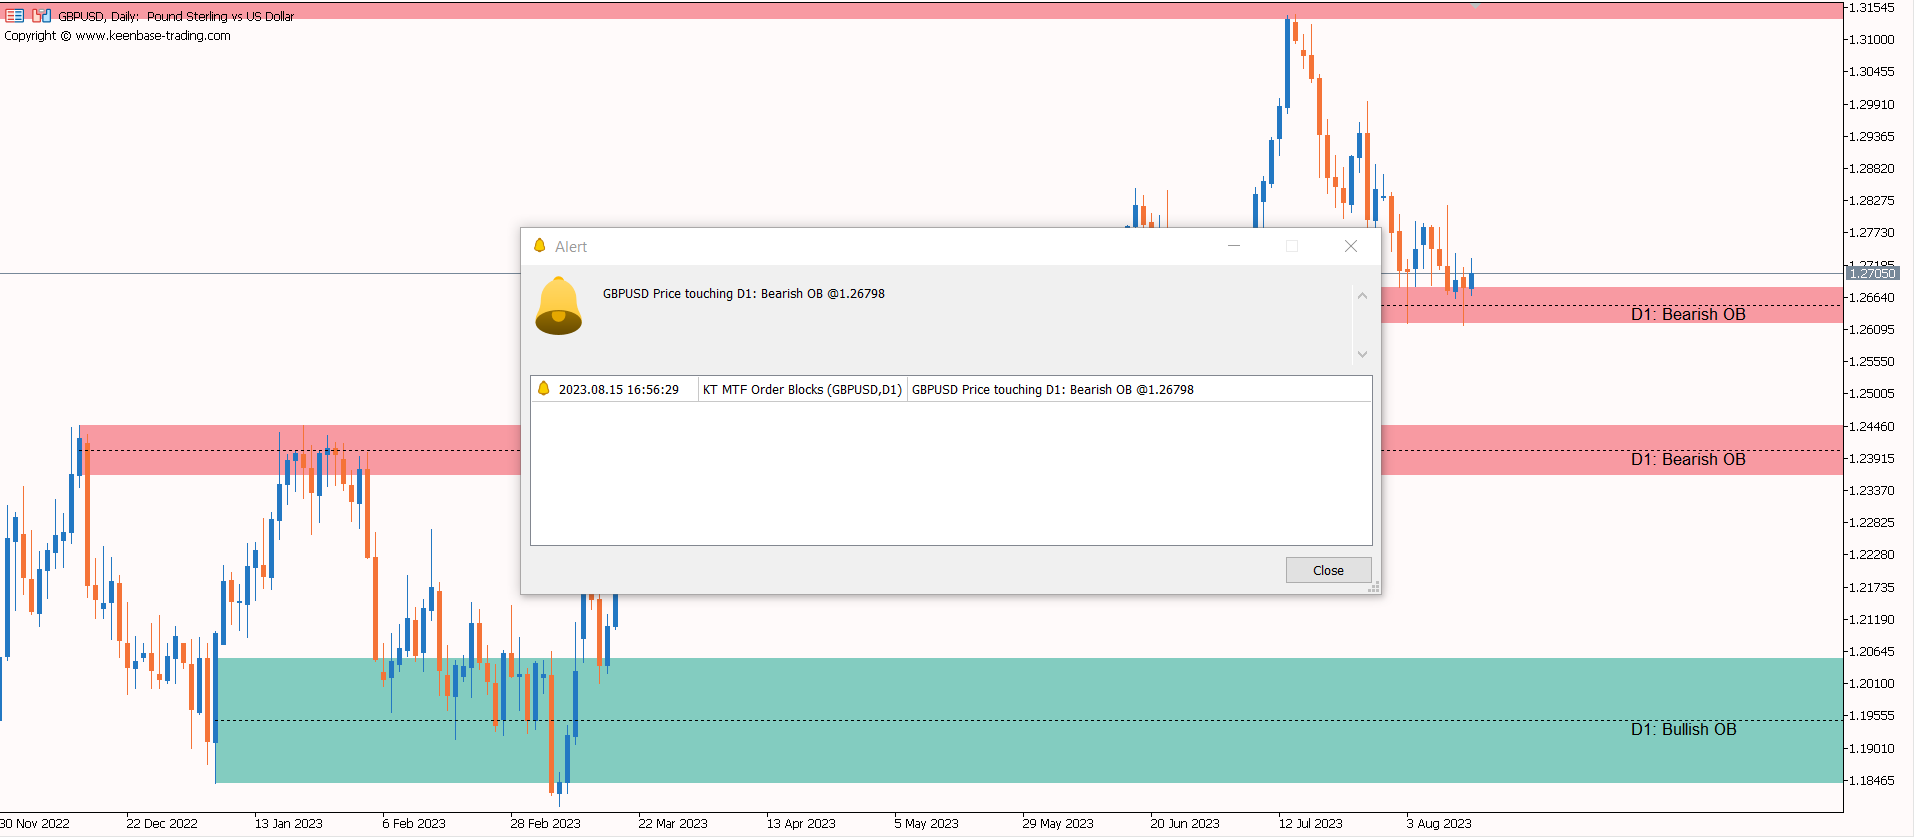
Alerts can trigger at a zone boundary or its midpoint. Popup, sound, email, and push channels can be enabled or disabled in the indicator inputs.
Identifying Bullish and Bearish Order Blocks
Bullish zones are drawn around price structures that preceded an upward move, while bearish zones are drawn around structures that preceded a downward move. The rectangles highlight candidates for review; they do not by themselves confirm a future reversal or continuation.
In a decline, a bullish order-block zone marks a price structure that preceded a strong upward move. Traders watch a return to that zone for current evidence of demand.
In a rise, a bearish order-block zone marks a structure that preceded a strong downward move. Traders watch a return for current evidence of supply.
Recognizing Bullish Order Blocks
The indicator draws bullish candidates as rectangles using the selected bullish-zone color. That color is customizable; it is not fixed to navy blue. A reaction at the boundary or optional midpoint may support a setup, while a decisive break can invalidate it.
Recognizing Bearish Order Blocks
The indicator draws bearish candidates as rectangles using the selected bearish-zone color. When reviewing a bearish zone, look for:
- A clear move down after the source price structure.
- Alignment with the broader timeframe and nearby resistance.
- Current rejection or failure when price revisits the zone.
Treat the rectangle as an analysis area rather than a guaranteed turning point.
Integrating Our Order Block Indicator into Your Trading Strategy
Use the zones to organize a trading plan: define what confirms the setup, where it becomes invalid, where profit may be taken, and how much capital is at risk.
The MT4 and MT5 versions use the same core workflow: review the plotted zones, compare the selected timeframes, and wait for current price action to confirm or reject a setup.
Determining Trend Direction
Order blocks do not determine trend direction by themselves. Compare bullish and bearish zones with swing structure, momentum, and the higher-timeframe context. A zone that repeatedly fails should not be treated as valid support or resistance.
Fine-Tuning Entry and Exit Points
Use a zone boundary, midpoint, or confirmed reaction as a reference for planning. The alert is a prompt to inspect the chart, not an instruction to trade. Place entries and exits only after defining the setup and its invalidation conditions.
Managing Risk-Reward Ratio
Set the protective stop where the trade idea becomes invalid, not at an arbitrary distance. Then compare that risk with a realistic target and size the position so a failed setup remains within the account's risk limit.
Combining with Other Indicators
Additional tools can provide a different view of context. For example, traders may compare an order-block reaction with RSI, MACD, or Supertrend. Agreement does not guarantee a result, and conflicting evidence is a reason to reassess the setup.
To refine trading strategies further:
- Compare the current chart with one or two relevant higher timeframes.
- Wait for an observable price reaction instead of assuming every touch will reverse.
- Use volume, momentum, or market-structure tools only when they add independent evidence.
Applications of KT MTF Order Block Indicator
- Map Candidate Reaction Zones: Plot bullish and bearish rectangles consistently.
- Compare Three Timeframes: Review the current chart timeframe plus two selected timeframes in one view.
- Support and Resistance Context: Compare zones with nearby support and resistance.
- Boundary or Midpoint Alerts: Receive a notification when price reaches the selected alert area.
- Chart Customization: Control colors, line styles, labels, visibility, and the optional template.
- Risk Planning: Use the plotted area to define confirmation, invalidation, and position risk before a trade.
Installing and Using the Order Block Indicator
The indicator can be used on MT4 or MT5 charts for instruments and timeframes supported by the trading platform. It plots price zones for analysis; it does not provide automatic trade execution.
This page covers the KT Order Block Indicator. Keenbase also offers a separate Smart Money Concepts Indicator with its own features. An Order Block Breaker version is not included with this product.
Installation Process
Use the supplied platform file: .ex4 for MT4 or .ex5 for MT5. The indicator does not require AutoTrading or DLL imports.
- In MT4 or MT5, choose File > Open Data Folder.
- Copy the file into MQL4/Indicators for MT4 or MQL5/Indicators for MT5.
- Restart the terminal, or right-click Indicators in the Navigator and choose Refresh.
- Drag the KT Order Block Indicator from the Navigator onto a chart.
- Enter the supplied license key, choose the timeframes, display options, and alerts, then click OK.
The available display controls cover bullish and bearish zones, colors, midpoint line style and width, timeframe labels, color flipping, and the optional chart template. There is no chart-button size or placement control.
For alerts, choose the zone boundary or midpoint as the alert area, then enable or disable popup, email, push, and sound channels as required.
Common Mistakes to Avoid When Using Order Block Indicators
A plotted zone is historical evidence, not a guaranteed trade signal. Review current price action, the wider market structure, nearby levels, and the chosen timeframes before making a decision.
Relying Solely on Order Blocks
Relying solely on order blocks can hide conflicting evidence. Use the zones as one part of a defined method that includes confirmation, invalidation, and risk limits.
Ignoring Support and Resistance Levels
Nearby support and resistance may strengthen, weaken, or conflict with an order-block setup. A clean break through a zone can invalidate it or change how the area behaves on a later retest.
Overlooking Time Frame Considerations
Choose timeframes that match the holding period and trading plan. The indicator can show three timeframes in total, but adding context is useful only when each selected timeframe has a clear purpose.
Summary
The KT Order Block Indicator plots customizable bullish and bearish rectangles on MT4 and MT5 across the current chart timeframe and two selectable timeframes. Optional midpoint lines, labels, templates, and multi-channel alerts help users review those zones consistently.
The indicator is an analysis aid, not a prediction engine. Combine its zones with current price action and a defined risk plan.
Frequently Asked Questions
What are order block indicators?
Order block indicators automatically plot price zones associated with a strong move away from a prior structure. Traders review those zones as possible areas of future support, resistance, continuation, or failure.
How do you predict order blocks?
Order blocks are not known in advance with certainty. Traders identify candidates from historical price structure, then watch how price behaves when it returns. This indicator automates the plotting, while confirmation still comes from current price action.
How do you know which order block is right?
No order block is guaranteed to be right. Give more weight to clearly defined, recent zones that fit the higher-timeframe context, then require a reaction and abandon the setup if its invalidation condition occurs.
What are bullish and bearish order blocks?
A bullish order block is a potential demand zone that preceded an upward move. A bearish order block is a potential supply zone that preceded a downward move. Either zone can fail, so the next price reaction matters.
How can I install and use the Order Block Indicator?
Place the supplied .ex4 or .ex5 file in the correct Indicators folder, refresh or restart the terminal, and attach the indicator from the Navigator. Enter the license key, configure the display and alert inputs, and click OK. AutoTrading and DLL imports are not required.