Mean Reversion Entries
If an instrument tends to revert to its average price after extreme movements, you can use the dynamic overbought and oversold zones identified by the indicator to enter trades precisely. This approach helps you catch short-term price swings and quickly lock in profits.
Trend Following Entries
If an instrument typically moves in strong trends, you can use these dynamic overbought and oversold zones to enter trades in the direction of the trend. This allows you to confidently ride price movements for bigger potential gains.
Features
- The indicator works equally well for trend-following and mean-reversion strategies, helping you pinpoint accurate entries and exits in any market condition.
- The machine learning module runs efficiently, providing smart insights without consuming excessive CPU resources.
- If you often find it challenging to determine the ideal overbought and oversold levels on the traditional RSI, this machine learning RSI will simplify your trading decisions.
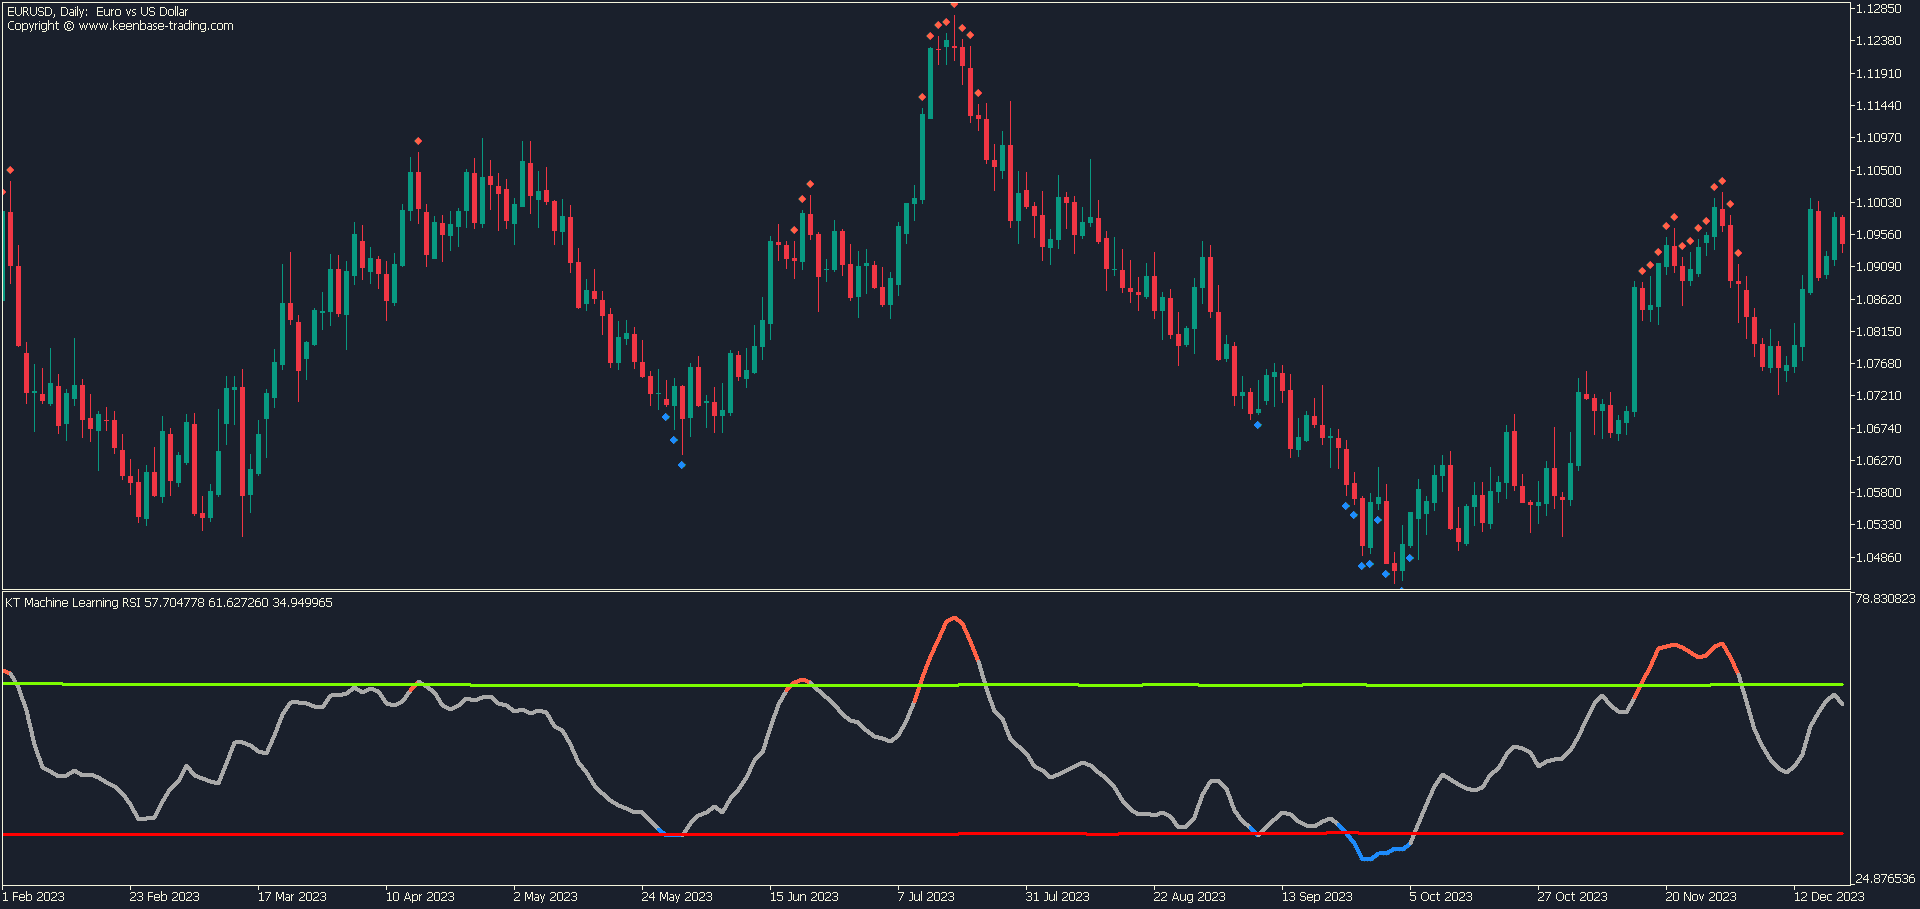
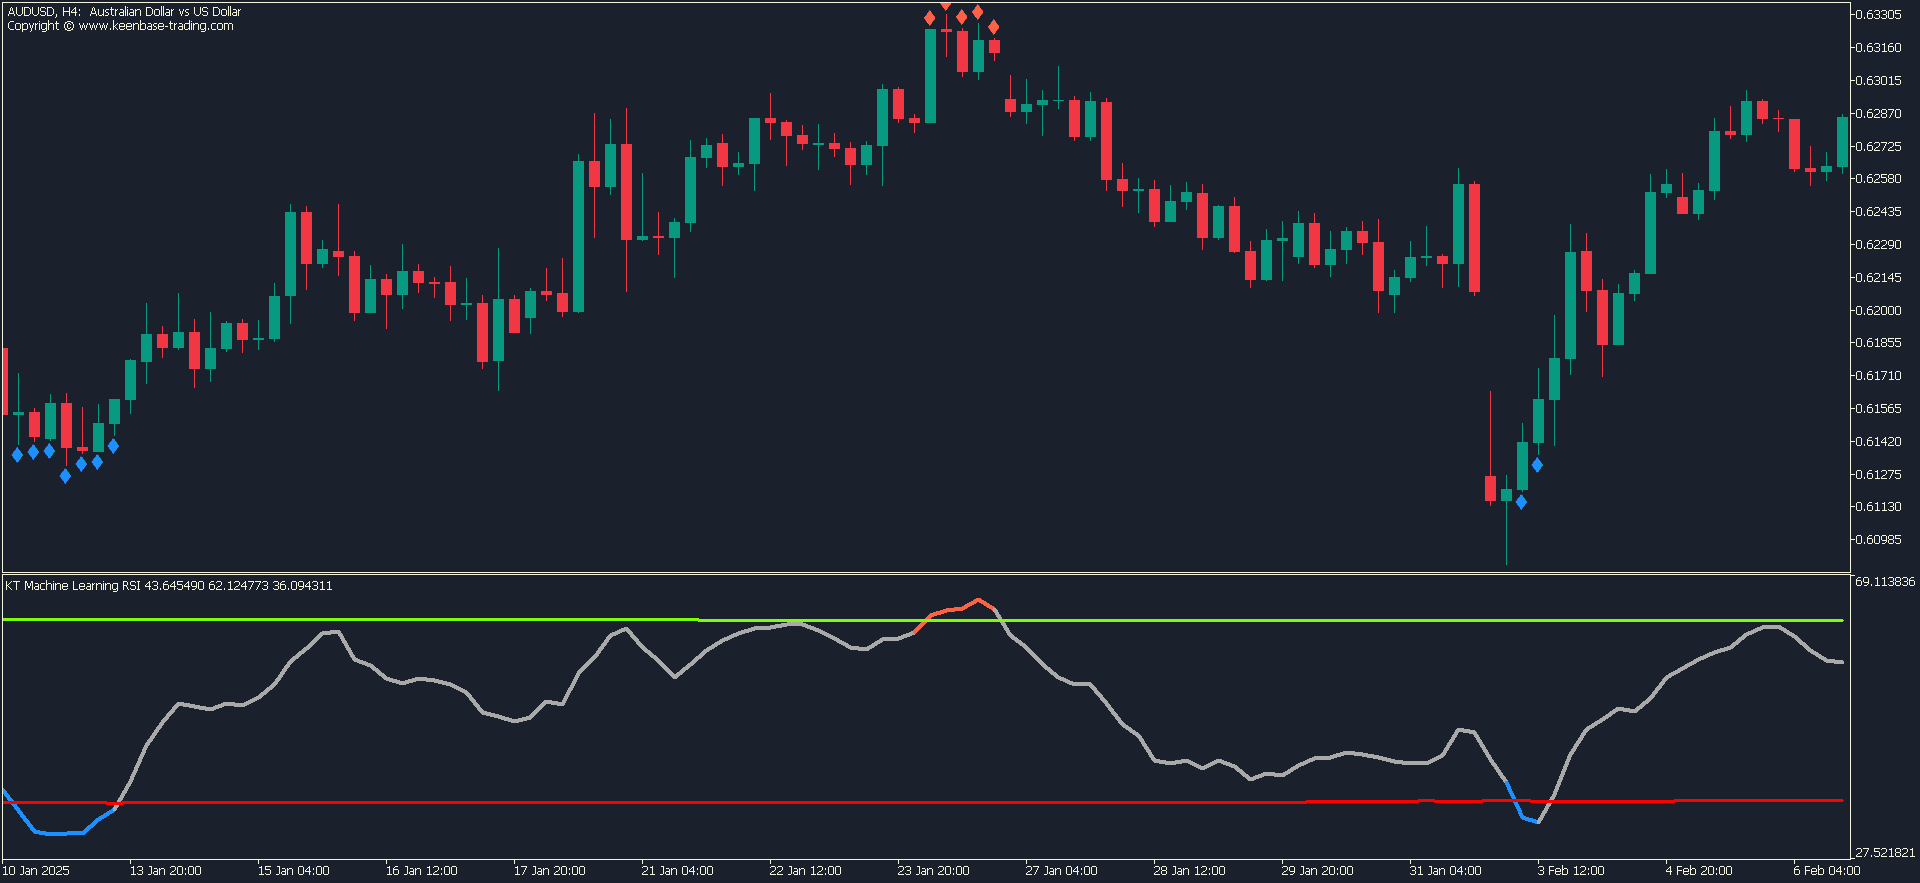
- The indicator clearly highlights the overbought and oversold zones with distinct colors and marks the corresponding candles directly on the chart. This visual approach makes it easy and straightforward to identify entry and exit points.
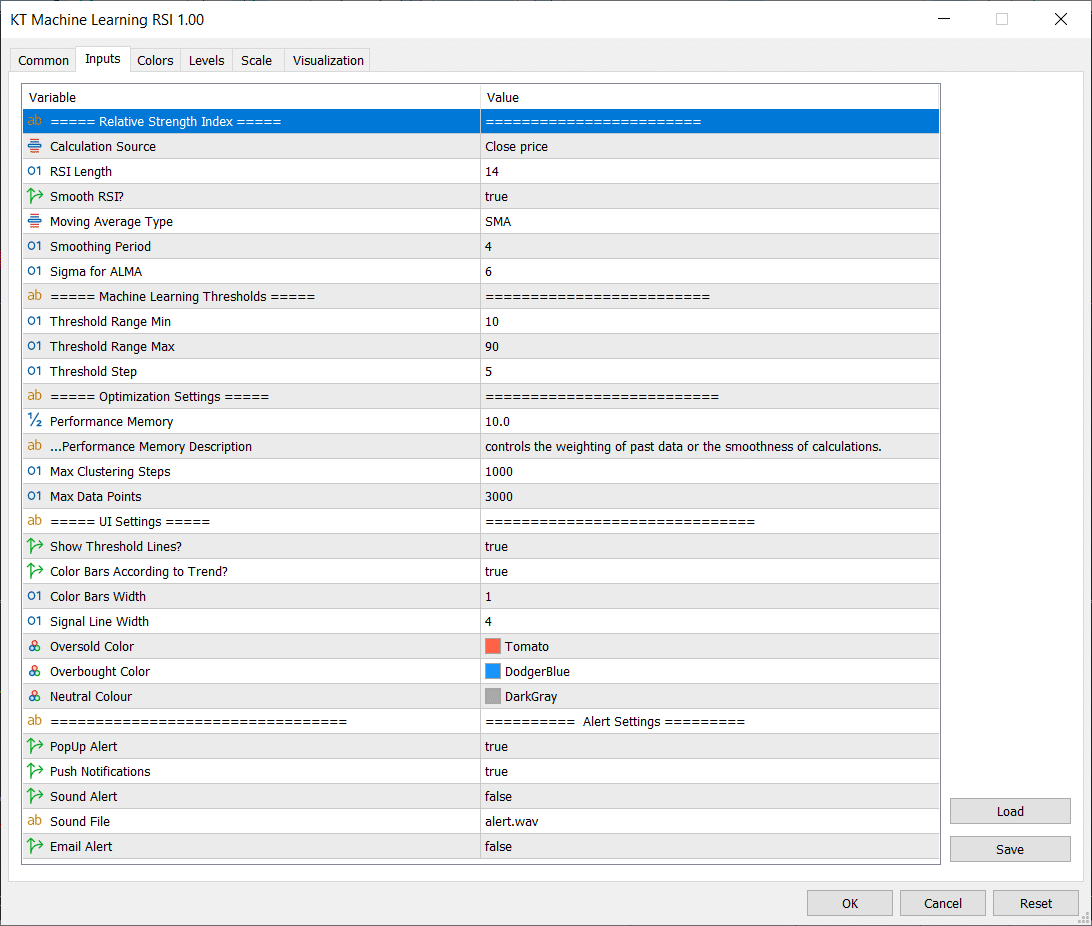
- You can fully customize the base RSI settings, from the moving average type to smoothing methods, to precisely feed the machine learning engine with the data you prefer.
- You can customize clustering steps and data points, giving you full control over how much weight the indicator gives to past data and how smoothly it calculates new signals.
- Receive instant alerts whenever the RSI enters the dynamically identified overbought or oversold zones, ensuring you never miss timely trade opportunities.
Inputs
Understanding the Relative Strength Index (RSI)
The Relative Strength Index, or RSI, is a popular momentum oscillator that tracks how fast and how far prices move, oscillating between 0 and 100. Traders often treat readings above 70 as overbought and below 30 as oversold, but fixed levels can miss shifts in today’s markets.
This indicator takes classic RSI and adds a machine-learning layer to set thresholds that adapt to each instrument’s history and current context. Instead of one-size-fits-all levels, it finds the optimal overbought and oversold zones based on how RSI has behaved in the past, helping you respond to real market conditions.
Optimize Your Backtest Time Frames
While most traders default to daily charts, shorter time frames, like 5- or 15-minute bars, often reveal how your dynamic thresholds perform in fast-moving markets. Try running your backtests on these intraday charts to see where the Machine Learning RSI really shines, then compare results across multiple time frames.
You might find that what looks like noise on a daily chart becomes a consistent edge on a 15-minute chart.
Conclusion
KT Machine Learning RSI indicator turns the old 70/30 rule on its head, using real historical data to set thresholds that move with today’s market. All the complex clustering happens under the hood, so you stay focused on executing trades with confidence.
Whether you’re riding trends or capturing quick reversals, this indicator adapts to your instrument and pinpoints high-probability entries and exits. Combine it with other indicators to add it to your strategy and experience momentum analysis that truly reflects current market behavior.