
KT NWOG NDOG Opening Gaps Indicator
MT4/MT5 [Free Download]

- Description
KT NWOG NDOG Opening Gaps indicator finds the price gap between one session's close and the next session's open, then draws it on your chart as a zone you can actually trade around.
There are two gaps it tracks. The New Week Opening Gap (NWOG) is the space between Friday's close and the new week's open.
The New Day Opening Gap (NDOG) is the space between yesterday's close and today's open. Both are areas where no trading took place, which is exactly why the price tends to come back and interact with them later.
Read More
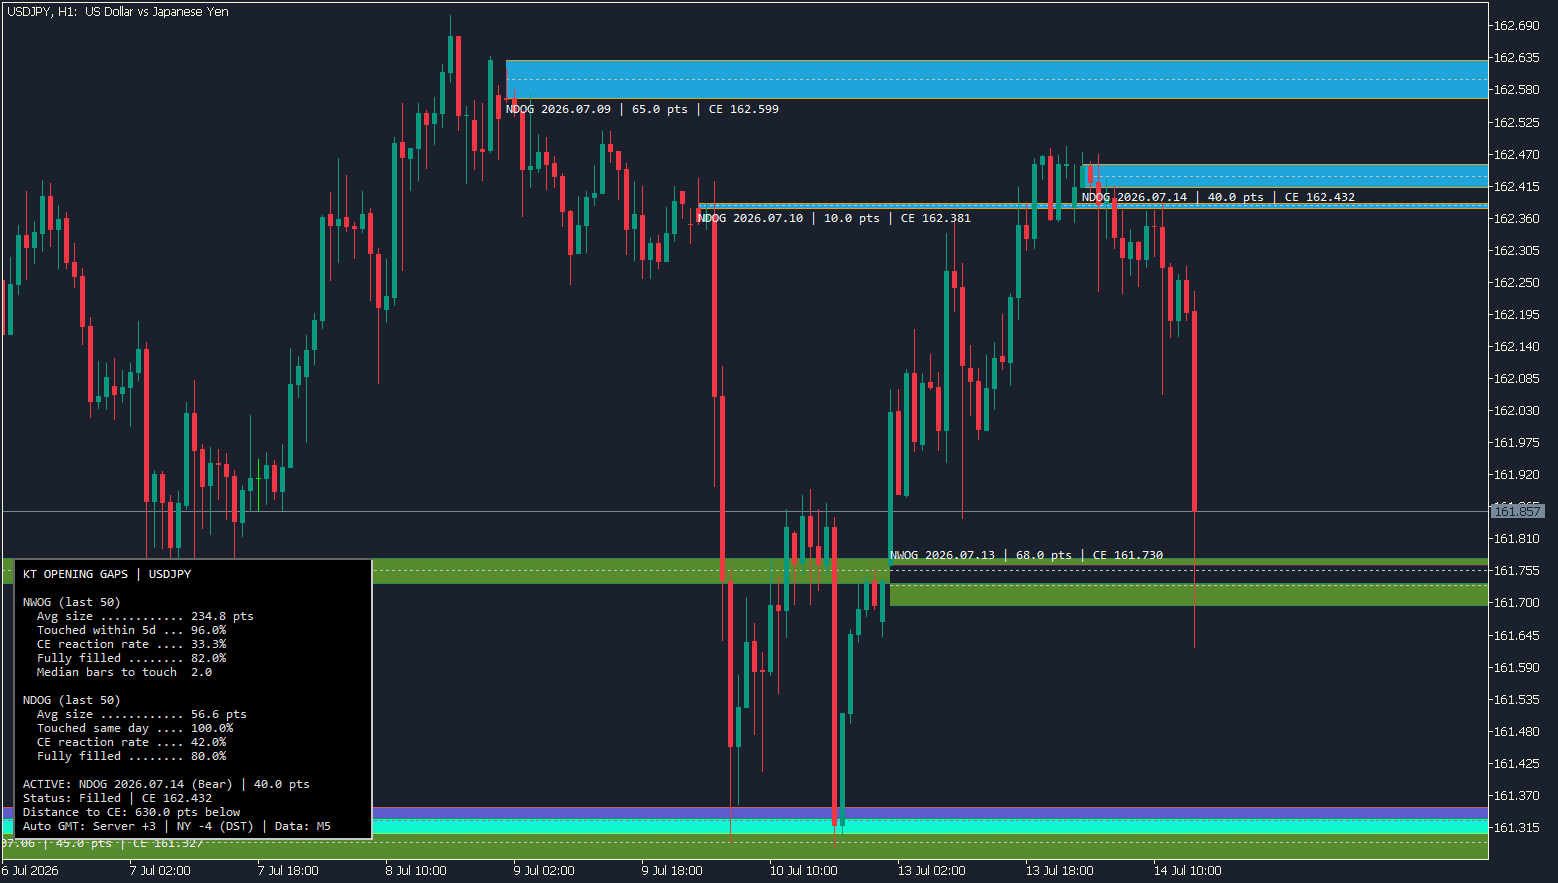
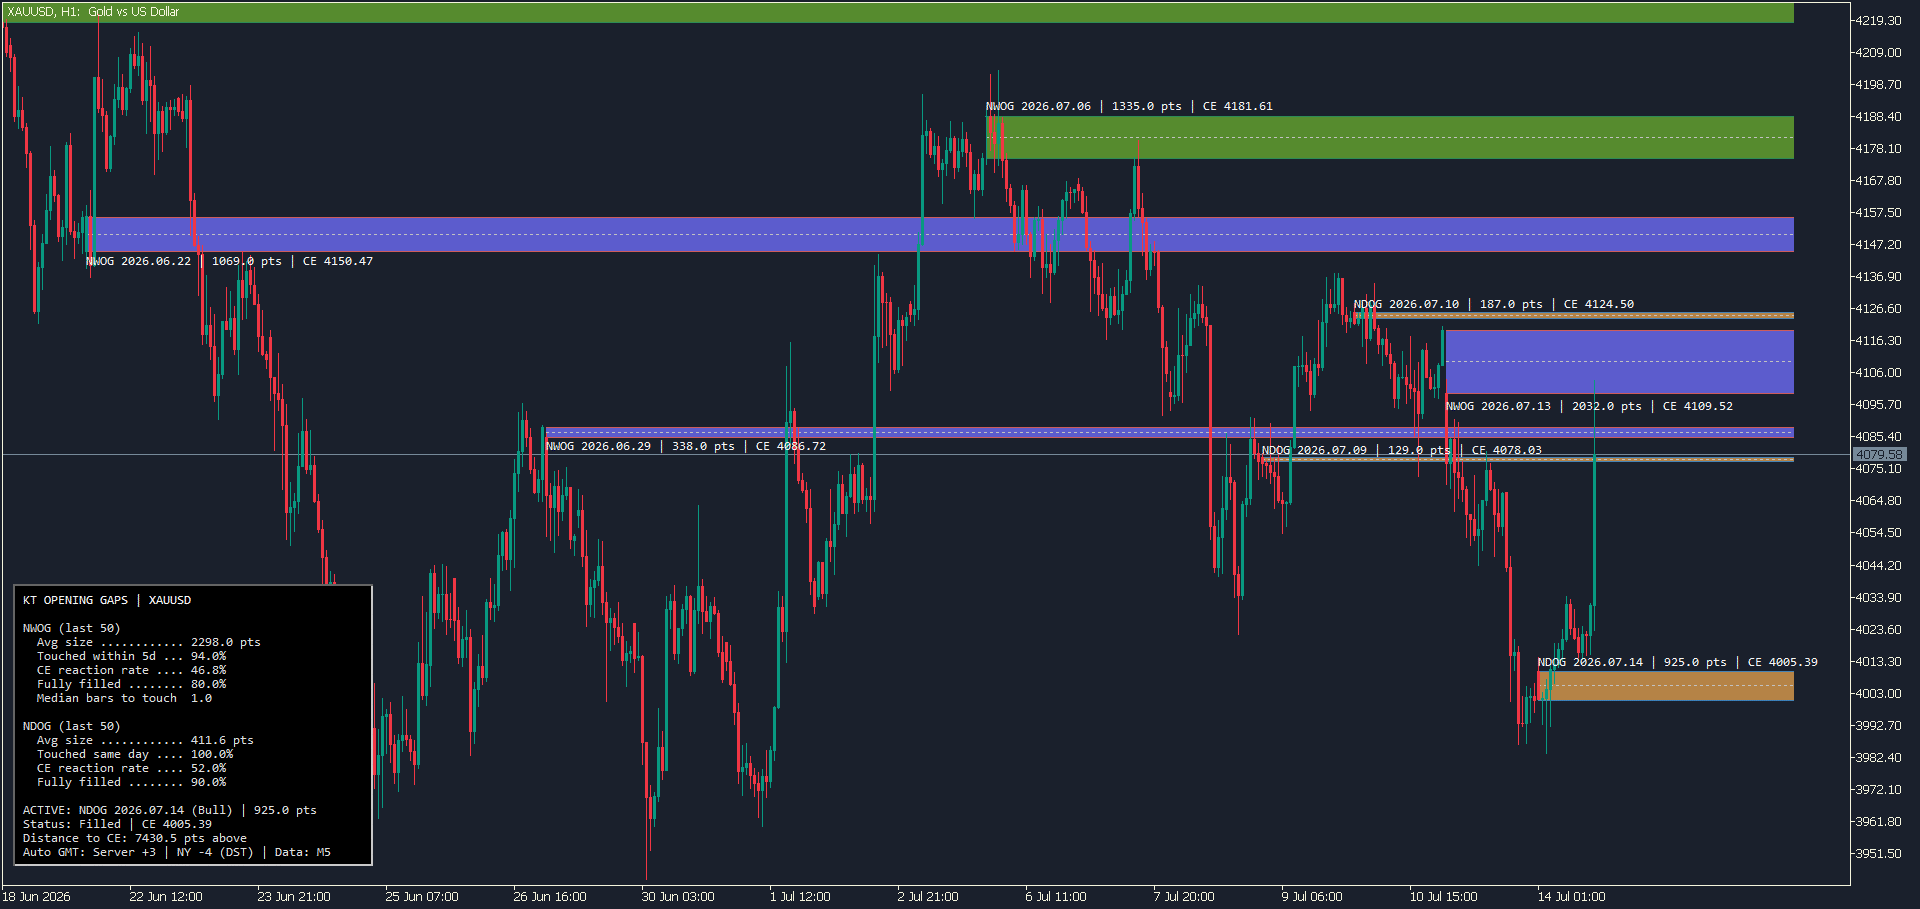
The indicator draws each gap as a shaded zone, marks the 50% midpoint (the Consequent Encroachment, or CE), and keeps the zone on your chart so you can watch how the price behaves when it returns. It also tracks whether each gap has been touched, how many times, and whether the price has traded through it.
What makes this different from other opening gap tools is the statistics panel. Instead of just drawing boxes and leaving you to guess whether they matter on your symbol, the indicator scans your loaded history, measures how past gaps behaved on that exact instrument, and shows you the numbers.
Average gap size, how often gaps were touched, how often the price reacted at the CE, and how often gaps were filled. You get context, not just lines.
It works on MT4 and MT5, on any symbol, and both versions are identical in features.
What is a New Week Opening Gap (NWOG)?
The forex and CFD markets close on Friday afternoon in New York and reopen on Sunday evening. Nothing trades in between.
But the world does not stop moving during those two days. News breaks, geopolitical events unfold, sentiment shifts, and by the time the market reopens, the first available price is often nowhere near where it left off on Friday.
That space between Friday's closing price and the new week's opening price is the New Week Opening Gap.
Here is why traders pay attention to it. Inside that range, there is no trading history at all. No candles, no volume, no orders were filled there. It is a hole in the chart. And price has a habit of coming back to areas like this, because the orders that never got filled on Friday evening are still sitting there waiting.
An NWOG is not a one-time event that disappears once the price touches it. This is the part most traders get wrong. A weekly gap can stay relevant for weeks. Price might touch it on Tuesday, ignore it for a month, then come back and react from the same level.
That is why this indicator keeps the last several NWOGs on your chart rather than deleting them the moment they are touched.
The direction matters too. If the market opens above where it closed on Friday, that is a bullish gap, and the zone below often acts as support when the price retraces into it. If it opens below Friday's close, that is a bearish gap, and the zone above often acts as resistance.
The midpoint of the gap, the CE, deserves special attention. More on that below.
What is a New Day Opening Gap (NDOG)?
The same thing happens every single day, just on a smaller scale.
The daily trading session closes at 17:00 New York time and reopens an hour later at 18:00. That one-hour break is short, but it is enough. Price frequently reopens at a different level than where it closed, leaving a small gap behind. That is the New Day Opening Gap.
NDOGs are smaller than weekly gaps, and they matter for a shorter period. Where an NWOG might stay relevant for weeks, an NDOG is usually a same-day story. Price often comes back to it during the Asian or London session, reacts, and then moves on. By the next day, it has usually lost most of its pull.
That makes NDOGs a more tactical tool. They are useful if you are watching intraday charts and looking for nearby levels where price might pause, reverse, or accelerate. They give you a reference point for the day that is based on something real, an actual void in the order flow, rather than an indicator calculation.
On some symbols and some days, there will be no daily gap at all. The close and the open will be the same price, or so close that the gap is meaningless. That is normal. The indicator simply will not draw anything, which is the correct behavior. A tool that invents gaps where none exist is not helping you.
What Is the CE (Consequent Encroachment)?
CE is just the midpoint of the gap. The 50% level. If a gap runs from 3400 to 3420, the CE sits at 3410.
It sounds almost too simple to be useful, but the midpoint of an opening gap is often where price reacts most cleanly. Rather than filling the entire gap, price will frequently push halfway in, stall at the CE, and turn.
This makes the CE a more precise reference than the gap edges, and it is the level many traders actually place orders around.
The indicator draws the CE as a dotted line inside every gap zone, shows the exact CE price in the gap label, and tells you how far the current price is from the CE of the active gap. It also tracks how often the price has historically reacted at the CE on your symbol, which is one of the numbers in the statistics panel.
Input Settings
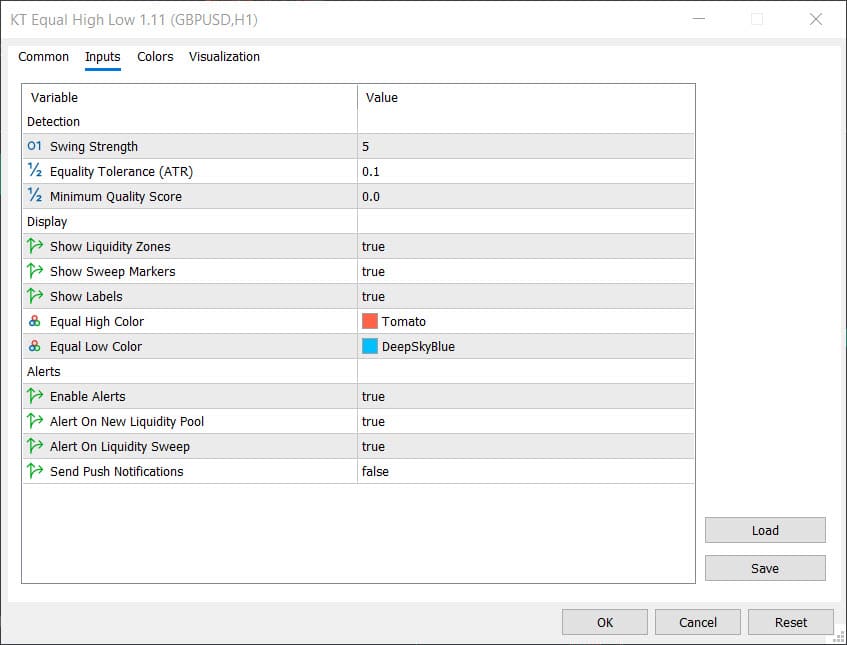
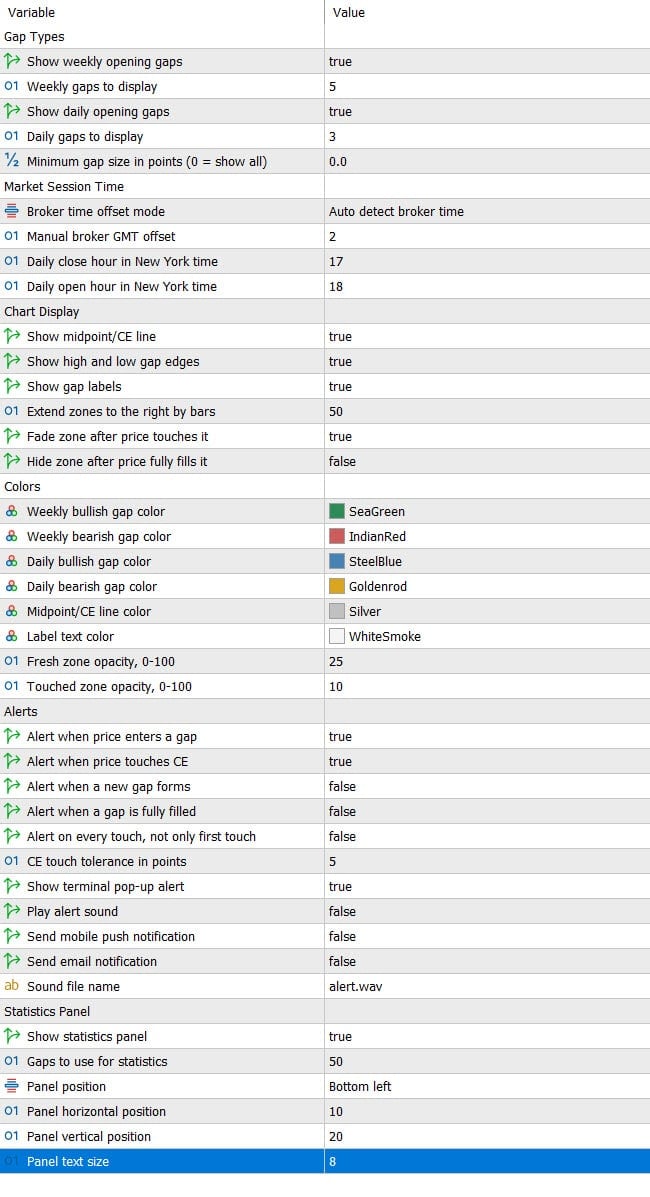
The input settings are grouped so you can find what you need without scrolling through a wall of inputs. Most traders never change anything beyond colors, and the gap counts. The defaults are set to be correct out of the box.
Gap Types: Turn weekly gaps and daily gaps on or off independently, and choose how many of each stay on the chart. There is also a minimum gap size filter here, in points, for cleaning up symbols that produce a lot of tiny gaps that are not worth looking at.
Market Session Time: Broker time offset mode (automatic or manual), the manual offset if you need it, and the daily close and open hours in New York time. The defaults are 17:00 and 18:00, which are correct for standard forex and CFD sessions. You will most likely never touch this group.
Chart Display: Show or hide the CE midpoint line, the gap edge lines, and the labels. Set how far the zones extend to the right. Choose whether zones fade after being touched, and whether they are hidden entirely once filled.
Colors: Separate colors for bullish and bearish weekly gaps, and for bullish and bearish daily gaps. Plus the CE line and label colors. Four gap colors sounds like a lot, but it is what lets you read the chart without labels once you are used to it.
Alerts: Which of the four events trigger alerts, and how are those alerts delivered? Also, whether to alert on first touch only or on every touch.
Statistics Panel: Turn the panel on or off, set how many past gaps go into the sample, and position it in whichever corner of the chart suits your layout.
What is Not a Setting
A few things are handled internally rather than exposed as inputs, and it is worth saying why.
Zero-size gaps are never drawn. When the close and the open are the same price, there is no gap, and drawing a flat line and calling it one would be dishonest.
Daylight saving time handling is always on. There is no legitimate reason to turn it off, and doing so would silently break your session boundaries for half the year.
Timeframe visibility ranges are fixed. Weekly gaps and daily gaps each appear only on the timeframes where they make sense, so you do not end up with weekly zones cluttering an M1 chart or daily zones invisible on a weekly one.
The general principle is that settings exist where preference is legitimate, and defaults are enforced where getting it wrong would just break the tool.
What You See on the Chart
The indicator adds a small set of objects to your chart, and every one of them is optional. Turn off what you do not need.
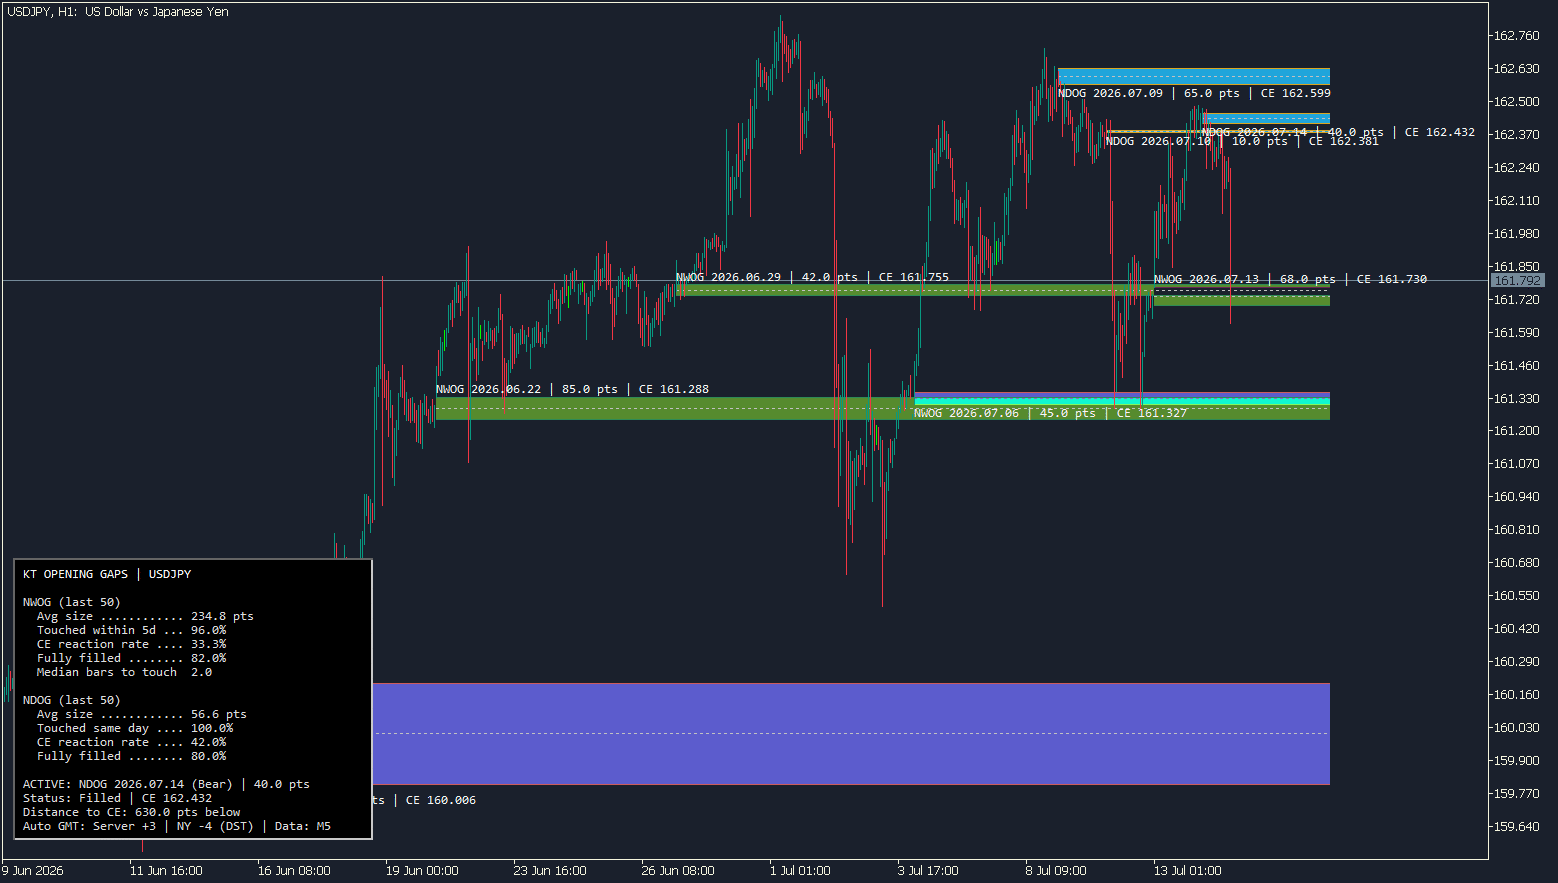
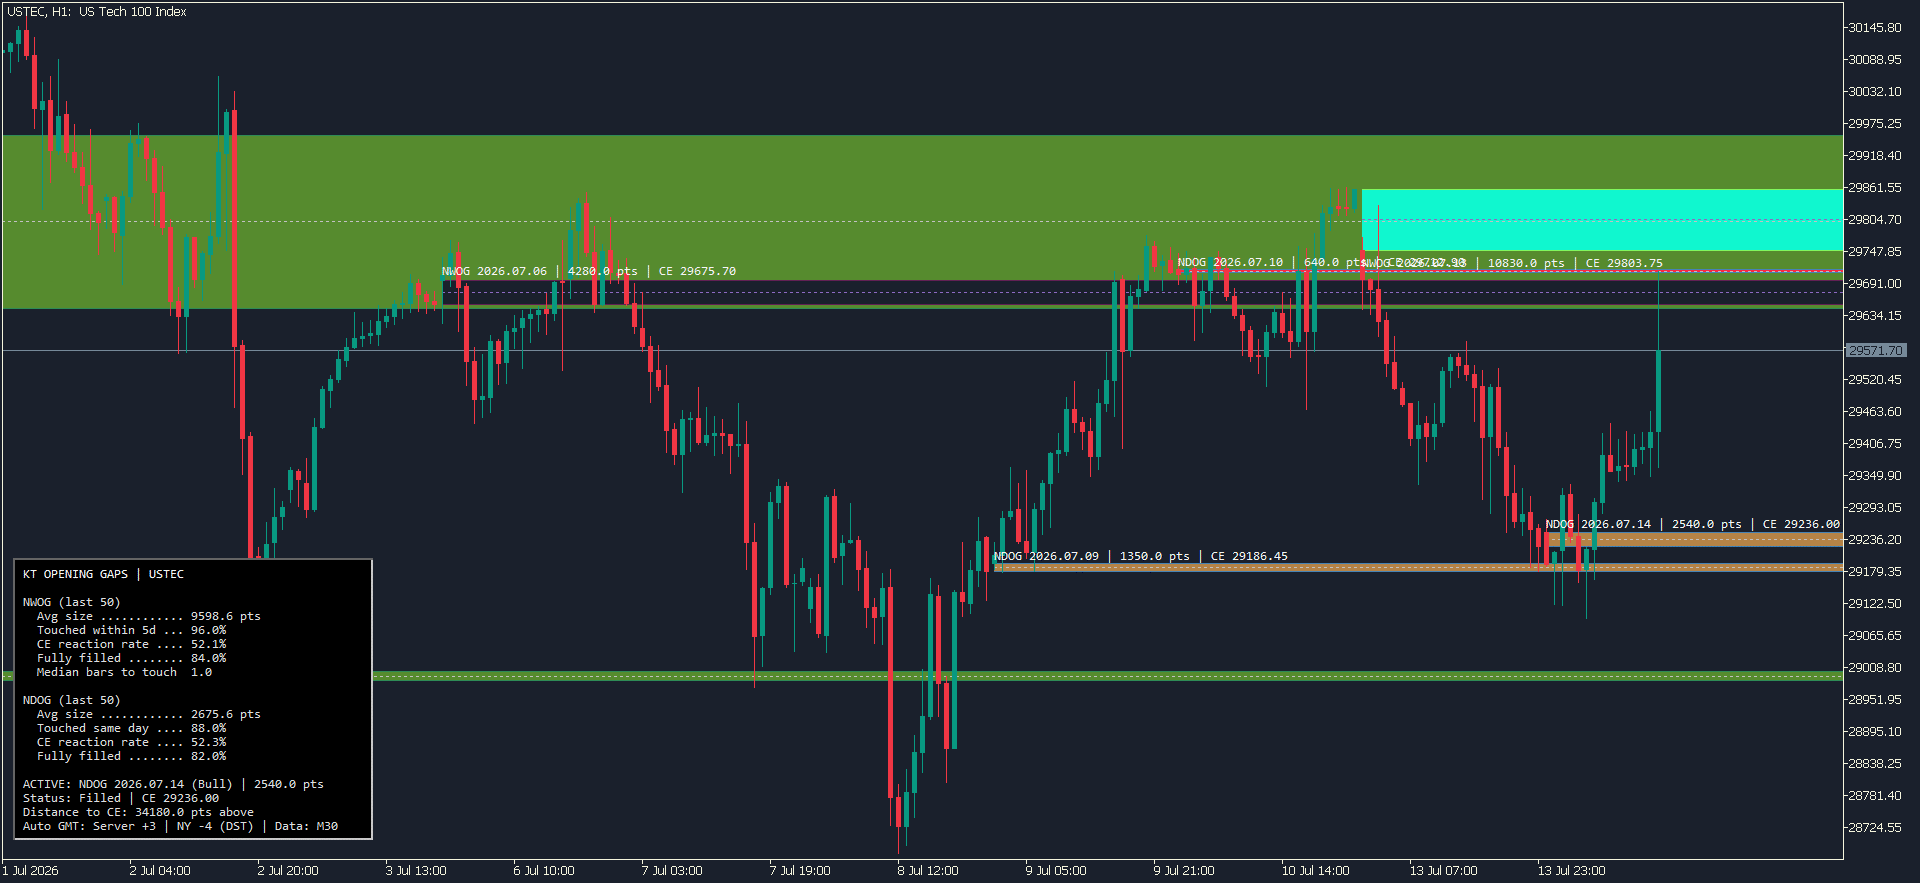
Gap zones: Each detected gap is drawn as a shaded rectangle running from the close price to the open price. The zone starts at the moment the new session opens and extends to the right so it stays visible as new candles form.
Weekly gaps and daily gaps use different colors, and bullish and bearish gaps use different colors again, so you can tell at a glance what you are looking at without reading a single label.
The CE line: A dotted line runs through the middle of every gap at the 50% level. This is the level price tends to react from most cleanly, so it gets its own marking rather than being left for you to eyeball.
Edge lines: Thin lines mark the exact high and low of each gap. Useful if you like to see the precise boundary rather than judging it from the shaded fill.
Labels: Each gap carries a short text label showing what it is, when it formed, how big it is in points, and the exact CE price. So a label might read NWOG 12 Jul | 84.2 pts | CE 3410.15. Everything you need to know about that zone, without opening a settings window.
Gaps Fade, They Do Not Vanish
When the price touches a gap for the first time, the zone fades. The fill gets lighter. It stays on your chart, but it visually steps back so your attention goes to the gaps the price has not reached yet.
This is deliberate, and it is worth explaining because it is where a lot of gap tools take the wrong approach.
Most opening gap indicators delete the zone as soon as the price touches it, treating the gap as a target that has been hit and is now finished. But an opening gap is not a target. It is a level. Price can touch a weekly gap, leave, and come back to that same zone weeks later and react from it again.
If your indicator deleted the zone the first time it was touched, you will never see the second reaction coming.
So the default behavior here is to keep gaps on the chart for their full lifetime and simply fade them once touched. You still get the visual signal that the gap has been visited. You just do not lose the level.
If you prefer the classic approach, there is a setting to hide gaps once the price has traded fully through them. It is off by default, but it is there.
How Many Gaps Stay on the Chart
By default, the indicator shows the last 5 weekly gaps and the last 3 daily gaps.
Five weekly gaps is a deliberate number. It gives you roughly a month of weekly opening levels, which is about as far back as an NWOG typically stays relevant. Three daily gaps keep the recent intraday context without turning your chart into a wall of boxes.
Both numbers are adjustable. If you want a cleaner chart, drop them. If you are doing a historical study and want to see more, raise them.
There is also a minimum gap size filter. Set it to a point value, and the indicator ignores anything smaller. Useful for symbols that produce a lot of tiny, meaningless one-pip gaps that clutter the chart without telling you anything.
The Gap Statistics Panel
Here is a question almost no gap indicator answers: Do opening gaps actually matter on the symbol you are trading?
Because they do not matter equally everywhere. Gold gaps hard and gaps often. EURUSD frequently opens within a pip or two of where it closed. A weekly gap on US30 behaves nothing like a weekly gap on USDCHF. If you take a rule you read in a course and apply it to every symbol on your watchlist, you are guessing.
The statistics panel answers the question with numbers from your own chart history.
When the indicator loads, it scans back through your loaded data, finds the past opening gaps on that symbol, and measures what actually happened after each one. Then it puts the results in a panel in the corner of your chart.
What the Panel Shows
The panel is split into four parts.
Weekly gap statistics (NWOG): How many weekly gaps were found in your sample, the average gap size in points, the percentage that price touched within five trading days, the percentage where price reacted at the CE midpoint, the percentage that eventually got filled, and the median number of bars it took before price first came back to the gap.
Daily gap statistics (NDOG): The same picture for daily gaps, with one difference. Instead of measuring touches within five days, it measures how often the gap was touched during the same trading day, which is the window that actually matters for a daily gap.
Active gap status: Which gap is currently the one to watch, when it formed, whether it is bullish or bearish, how big it is, whether it has been touched yet, and how far the current price sits from its CE in points. This is the line you glance at during a session.
Diagnostics: The detected broker GMT offset, the New York offset, whether daylight saving is currently in effect, and which timeframe the indicator used to read the session boundary. This exists so that if something looks wrong, you can see immediately whether the time settings are the cause.
Why This Changes How You Use the Indicator
Two examples of what this looks like in practice.
You load the indicator on XAUUSD, and the panel tells you the average weekly gap is large, most gaps get touched within a few days, and the price reacts at the CE in a majority of cases. That is a symbol where opening gaps is worth building a routine around.
You load it on a quiet cross, and the panel shows an average gap of a few points, a small sample, and inconsistent behavior. That is a symbol where you should probably be looking at something else. The indicator just saved you from forcing a concept onto an instrument that does not respect it.
Same tool. Opposite conclusion. The difference is that you now have evidence instead of an assumption.
What the Numbers Mean, Exactly
Two things need to be said plainly, because vague statistics are worse than no statistics.
These are historical measurements, not predictions: A 70% touch rate on past gaps tells you what happened. It does not tell you what the next gap will do. Markets change, and a number from the last fifty gaps is a description of the past, not a forecast of the future.
The CE reaction rate is not a win rate: It is a specific, mechanical measurement of the gap's price actually touched, how often the price comes close to the CE, and then moves away from it in the direction of the gap before breaking through the other side. It measures whether the midpoint is held as a level.
It says nothing about whether a trade taken there would have been profitable, because that depends entirely on your entry, your stop, your target, and your management. Do not read it as a strategy result.
If the sample size is small, the panel says so and shows the sample count next to the number. A statistic drawn from six gaps is not the same as one drawn from fifty, and you should be able to see the difference without digging.
Why Session Timing Is the Whole Game
Everything the indicator does rests on one thing: correctly finding the moment the session closed and the moment it opened again. Get that wrong, and every gap on your chart is wrong, in a way that looks completely convincing.
The gaps are defined by New York time. The daily session closes at 17:00 New York and reopens at 18:00 New York. That one-hour window is where the daily gap comes from. The weekly gap comes from the much longer window between Friday 17:00 New York and the new week's opening.
Here is where most gap tools fail. They read the open and close prices from the daily candle, because it is the easiest way to do it. But your broker's daily candle does not close at 17:00 New York.
It closes at midnight on the broker's server, and every broker sets that clock differently. GMT+2, GMT+3, and a dozen other variations depending on the region and the season.
So a tool that reads the daily candle is measuring the gap between the wrong two prices. It will still draw a rectangle. The rectangle will still look plausible. It will just be marking a level that has nothing to do with the actual session boundary, and you will never know unless you check by hand.
This indicator does not use the daily candle. It goes down to the minute-level data, finds the actual last price before 17:00 New York and the actual first price at 18:00 New York, and builds the gap from those two prices. That takes more work, and it is the only way to get it right.
Broker Time Is Handled for You
You do not need to know your broker's GMT offset. The indicator detects it automatically by reading the trade server clock.
It also handles daylight saving. New York is five hours behind GMT in winter and four hours behind in summer, and the switchover dates move each year. Get this wrong, and your gaps are off by an hour for several months of the year, which is enough to change where the boundary lands and therefore what the gap actually is.
The indicator applies the correct US daylight saving rules internally, so the session boundary stays anchored to real New York time all year.
If your broker's clock cannot be read reliably, the indicator does not guess. It draws nothing, puts a warning on your chart, and tells you to switch to manual mode and enter the offset yourself. Drawing a confident, wrong gap is worse than drawing none, so it refuses to do it.
Both the close hour and the open hour are exposed as settings if you trade with a broker whose sessions run differently, but the defaults are correct for the overwhelming majority.
Sunday Sessions and Missing Data
Two smaller problems that the indicator handles quietly in the background:
Some brokers offer a Sunday session. Some do not, and the week simply starts on Monday. This changes where the weekly open actually is. Rather than assume, the indicator checks your recent history to see whether Sunday bars exist and adjusts the weekly scan accordingly.
Minute data is not always available. Older history often gets thinned out, and if the minute bars around a session boundary are missing, the indicator cannot read that boundary at the finest resolution.
Rather than fail or fake it, it steps up through progressively coarser timeframes until it finds usable data, and then tells you which resolution it used in the diagnostics line of the statistics panel. You can see exactly how precise the reading was.
What it will never do is fall back to the daily candle. That would produce the exact error the whole design exists to avoid.
Alerts
You do not need to watch the chart. The indicator will tell you when something happens.
There are four events you can be alerted to, and each one can be switched on or off independently.
Price enters a gap: The moment price trades into the zone of any gap the indicator is tracking. This is the one most traders leave on.
Price touches the CE: Price has reached the midpoint of a gap. If the CE is where you are actually interested in acting, this is a tighter and more useful alert than a general zone entry.
A new gap has formed: The session has rolled over, and a new weekly or daily gap now exists on the chart. Useful on Sunday evening if you want to know what the week opened with before you sit down.
A gap has been filled: Price has traded all the way through a gap, edge to edge.
How Alerts Reach You
Four delivery options, and you can use any combination:
- MT4/MT5 pop-up on your terminal
- Sound alert
- Push notification to your phone
Alerts That Do Not Spam You
Two things worth knowing, because badly built alerts are worse than no alerts.
Alerts fire once per gap per event, not on every tick. When price enters a zone, you get one notification. If you actually want to know about every re-entry, there is a setting for that, but it is off by default because most people do not.
Alerts do not fire on history. When you first attach the indicator to a chart, it will not fire off a burst of notifications for every gap event that happened over the past month. It only alerts to things that happen from the moment it loads. This sounds obvious. A surprising number of indicators get it wrong.
How to Actually Use This on a Chart
There is no single correct way to trade opening gaps, and anyone who tells you otherwise is selling something. But there is a sensible way to set the tool up and a sensible order to look at things. Here it is.
Start With the Panel, Not the Chart
Before you look at a single zone, look at the statistics panel.
Load the indicator on the symbol you actually trade and read the numbers. Are the gaps big enough to matter on this instrument? Do they get touched, or does Price ignore them? Does the CE hold, or does the price cut straight through it? Is the sample large enough to mean anything?
If the answers are weak, you have learned something valuable in about ten seconds. This symbol does not respect opening gaps in the way you were hoping, and you should not build a routine around them here. Move on.
If the answers are strong, now the zones on your chart are worth paying attention to, and you know roughly what to expect from them.
Do this once per symbol. Not every session.
Pick the Right Timeframe
Weekly gaps and daily gaps want different charts.
Weekly gaps (NWOG) read best on M15, M30, H1, and H4. An NWOG can be large, and it can stay relevant for weeks, so you want enough chart on screen to see it in context. H1 is the sweet spot for most people. On very low timeframes, a weekly gap can swallow the entire visible chart and stop being useful.
Daily gaps (NDOG) are smaller and shorter-lived, so they read better on M5, M15, M30, and H1. These are your intraday reference points, and you want to be close enough to the price action to see the reaction when it comes.
A practical setup that works for most people: H1 for context, M15 or M30 for the actual watching. Keep the weekly gaps in mind on the higher chart, drop down to see how the price is behaving around the level, and let the alerts tell you when something has been reached.
A Note on Gold (XAUUSD)
XAUUSD deserves a specific mention because it is where a lot of traders will want to use this.
Gold gaps often and meaningfully, which makes it one of the better instruments for this concept. But it is also noisy. On M1 and M5, gold produces a lot of movement that looks like a reaction and is not. Price will poke into a zone, spike, and reverse, all inside a couple of minutes, and none of it means anything.
M30 or H1 will give you a cleaner read on gold than M5 will. You will see fewer signals, and more of them will be worth something. If you have been frustrated by gold chopping through levels that should have held, the timeframe is probably the reason.
What to Watch For
Three things that are worth your attention when price returns to a gap.
The CE, more than the edges: Price frequently pushes into a gap and turns at the midpoint rather than running the whole range. If you are waiting for a full fill before you pay attention, you will miss most of what happens. The CE is where the action tends to be.
The gaps that have not been touched yet: Untouched zones are drawn at full strength while touched ones fade. That is not decoration. An untouched gap is a level price that has not yet interacted with, and those are generally the ones worth watching. Let the fading do the filtering for you.
Old gaps that everyone else has forgotten: Because the indicator keeps weekly gaps on the chart rather than deleting them once touched, you will sometimes see price come back to a three-week-old NWOG and react cleanly from it.
Nobody watching a tool that deletes filled gaps will see that coming. This is the specific reason the persistence behavior is the default.
What This Tool Is For
Use it as a map, not as a signal. It tells you where the untraded space is, where the midpoints sit, and how price has historically behaved around them on your symbol. What you do with that is your decision, made with your own market read, your own risk, and your own plan.
It will not tell you when to enter. It will tell you where to look.
What This Indicator Does Not Do
Most product pages skip this section. We would rather you know exactly what you are downloading before you download it.
It does not give buy or sell signals: No arrows, no entries, no directional calls. It draws levels. Deciding what to do at those levels is your job.
It does not predict where the price is going: It shows you where the price has not traded and where it has historically reacted. That is a description of the past and the present. It is not a forecast.
It does not guarantee gaps will be filled: Plenty of gaps never get filled. Some sit untouched for months. The statistics panel will show you the historical fill rate on your symbol precisely, so you can see how often that happens rather than assuming.
It does not place, manage, or close trades: It is an indicator, not an EA. No orders, no lot sizing, no stops, no targets. It does not touch your account.
It is not a trading system: It is one input. It knows nothing about market structure, trend, news, session context, or your risk. Used on its own, without any of that, it is just boxes on a chart.
It will not behave identically on every broker: Server times differ, price feeds differ, sessions differ, and available history differs. Two brokers can show you slightly different gap sizes on the same symbol, and both readings can be correct for their own feed.
This is a fact about the market, not a flaw in the tool, but you should know it before you compare charts with someone.
On the Statistics
The panel reports what happened. It does not report what will happen.
If it tells you that 70% of past weekly gaps were touched within five days, that is a measurement of your loaded history on that symbol. It is not a probability for the next gap. Markets shift, volatility regimes change, and a number drawn from the last fifty gaps can stop describing the market at any time.
And to say it once more, because it matters: the CE reaction rate is not a win rate. It measures whether the midpoint is held as a level. It says nothing about whether trading it would have made money, because that depends on things the indicator cannot see, which is to say your entry, your stop, your target, and your discipline.
Treat the numbers as context. Nothing more, and nothing less.
Broker and Data Notes
Opening gaps is one of the few chart concepts that depend directly on your broker's clock and your broker's data. It is worth understanding what that means in practice.
Your history determines your statistics: The panel can only measure the gaps that exist in your loaded chart data. If you have just installed MT4 or MT5, or you have never scrolled back on that symbol, your terminal may only be holding a few weeks of history. The panel will find fewer gaps, and the sample will be small.
It will tell you the sample size, so you will know. If the numbers look thin, scroll your chart back to force the terminal to download more history, then reload the indicator.
Gap sizes vary between brokers: Two brokers with different server times, different liquidity providers, and different session hours will record slightly different close and open prices, and therefore slightly different gaps. Sometimes the difference is a fraction of a point. Sometimes it is more. Neither broker is wrong.
They are simply different feeds. If you compare your chart against a screenshot from someone on another broker and the numbers do not match exactly, this is why.
Some symbols simply do not gap: Continuously traded instruments, certain synthetic products, and some crypto CFDs run without a real session break. If there is no gap, the indicator draws nothing and tells you so, rather than manufacturing zones out of nothing. An empty chart is the correct output when there is nothing to show.
The indicator stays quiet unless something needs your attention: It does not print startup messages or fill your log with diagnostics. It speaks up only when there is something you can actually act on: an invalid setting, a broker clock it cannot read, or a symbol where no qualifying gaps were found in your loaded history. If your log is empty, everything is working.
If Something Looks Wrong
Check the diagnostics line at the bottom of the statistics panel first. It shows the detected broker GMT offset, the New York offset, whether daylight saving is currently applied, and which timeframe resolution was used to read the session boundary.
Almost every problem with an opening gap tool comes down to time. If the detected offset does not match what you know your broker to be, switch to manual mode and enter the correct value. That one field fixes the large majority of issues.
Frequently Asked Questions
Yes. It is a free download for both MT4 and MT5. No trial period, no feature lock, no payment.
Yes. Both versions have identical features, including the statistics panel, the automatic broker time detection, the CE line, and all alert options. Download whichever platform you trade on.
New Week Opening Gap. It is the price gap between Friday's close and the new week's open.
New Day Opening Gap. It is the price gap between the previous day's close at 17:00 New York time and the new day's open at 18:00 New York time.
Consequent Encroachment. It is the midpoint of the gap, the 50% level. Price often reacts at the CE rather than filling the whole gap, which is why the indicator marks it with a dedicated line.
No. The indicator detects it automatically by reading the trade server clock, and it handles US daylight saving internally. If it cannot detect the offset reliably, it will tell you on the chart and ask you to enter it manually rather than guessing.
Because an opening gap is a level, not a target. Price can touch a weekly gap, walk away, and come back to that same zone weeks later and react from it again. Deleting the zone on first touch means you never see the second reaction. Touched gaps fade instead of disappearing.
If you prefer the classic behavior, there is a setting to hide gaps once fully filled.
H1 works well for weekly gaps and gives you good context. M15 or M30 works well for daily gaps and for watching price react at a level. A common setup is H1 for the overall picture and M15 or M30 for closer observation.
On XAUUSD specifically, M30 or H1 will give you a cleaner read than M1 or M5, because gold produces a lot of noise on very low timeframes.
Your terminal has not loaded enough history for that symbol. Scroll the chart back to force MT4 or MT5 to download more data, then reload the indicator. The panel will show a larger sample.
Either the symbol trades continuously and has no real session break, or your loaded history does not contain any qualifying gaps. The indicator will tell you which. It will not invent gaps that do not exist.
No. It measures whether price reacted at the midpoint and moved away from it before breaking through the other side. It is a measurement of whether the level held. It says nothing about profitability, which depends entirely on your entry, stop, target, and management.
No. It is a visual indicator. It draws zones, tracks touches, and can send alerts. It does not open, manage, or close positions, and it does not touch your account.
It works on any symbol that has a session break. Gold and indices typically produce the largest and most active opening gaps. Crypto CFDs often trade continuously and may show no gaps at all, in which case the indicator will say so rather than drawing anything.
Yes. Bullish and bearish weekly gaps and bullish and bearish daily gaps each have their own color setting, along with the CE line and labels.
Download KT NWOG NDOG Opening Gaps Indicator
Free for MT4 and MT5. Both versions are identical.
Download the file, drop it into your platform's indicators folder, restart the terminal, and attach it to a chart. It will detect your broker's time settings on its own and start drawing. There is nothing to configure to get it working.
Installation
- Download the file for your platform.
- In MetaTrader, open File → Open Data Folder.
- Navigate to MQL4/Indicators (MT4) or MQL5/Indicators (MT5).
- Copy the file into that folder.
- Restart MetaTrader.
- Find the indicator in the Navigator panel and drag it onto a chart.
If you want the statistics panel to give you a meaningful sample straight away, scroll your chart back a few months first so the terminal downloads enough history.
Where to Go From Here
Opening gaps is one piece of a larger picture. They tell you where liquidity was left behind. If you want to see the rest of that picture, the same logic applies to fair value gaps, liquidity sweeps, and market structure.
Screenshots
You Might Also Like











Help others make better choices. Please review your recent purchase.
By sharing your review, you will help others to make advised decision about what they buy from us. Thanks for contributing.
You must log in to submit a review.