
KT Parabolic Sar Arrow Indicator
MT4/MT5

-- Lifetime Access --

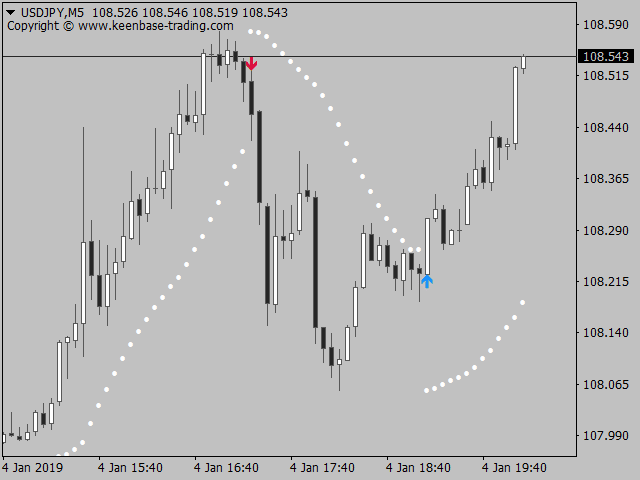
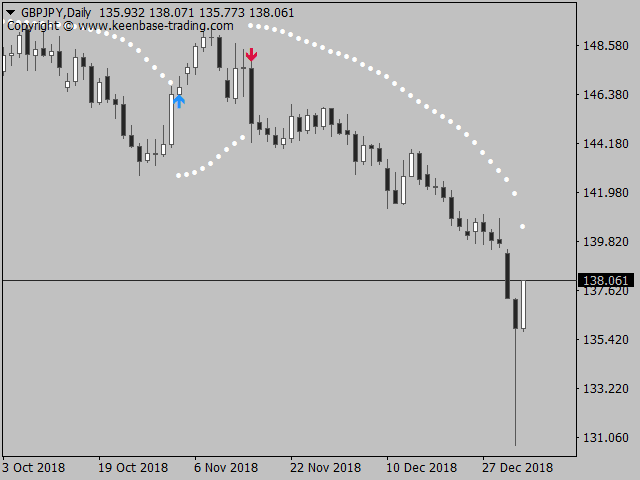
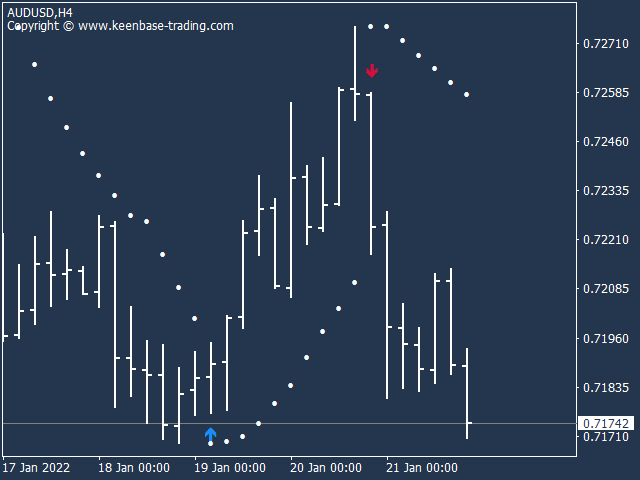
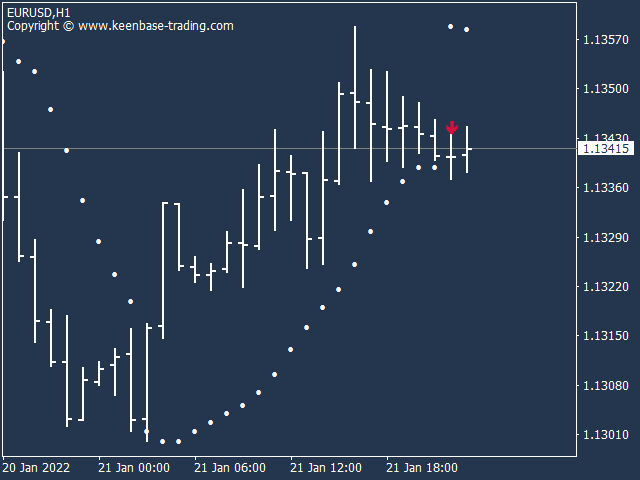
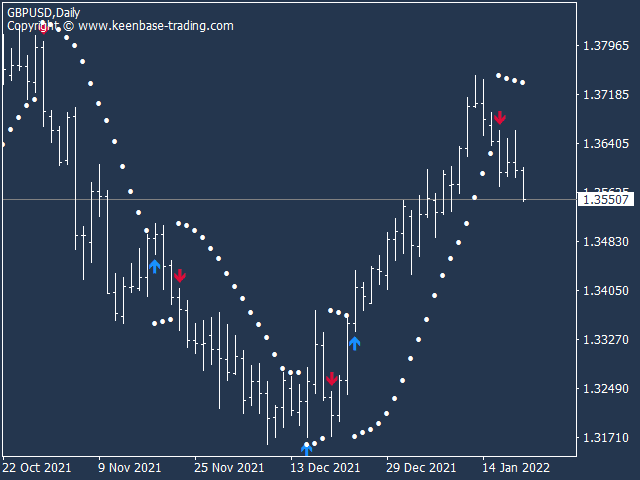
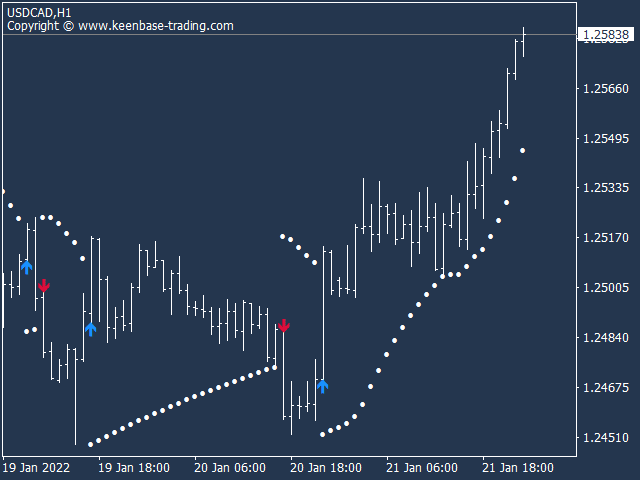
KT Parabolic Sar Arrow indicator plots the up/down arrows based on the standard Parabolic SAR indicator. It generates the up/down signals in real-time without waiting for the bar to close.
The indicator shows the up arrow when the current bar's high touches the SAR and the down arrow when the contemporary bar's low touches the SAR.
Features
- Traders can use it to find turning points in the market.
- A must-have tool if you are using the strategies that include the use of Parabolic SAR.
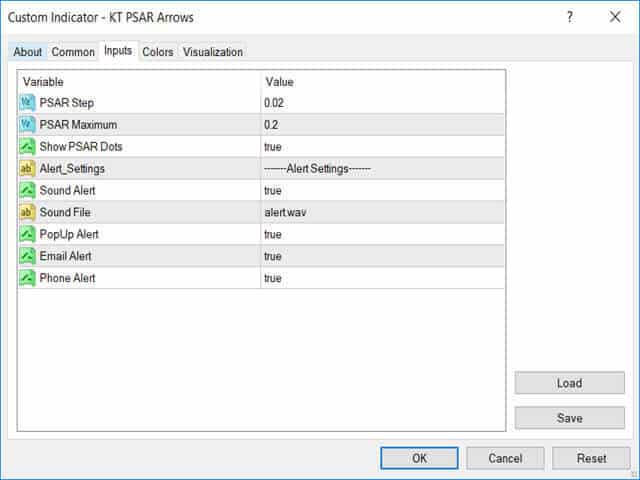
- Simplified and unambiguous inputs.
- Implements all kind of Metatrader alerts.
Read More
Screenshots
You Might Also Like














Help others make better choices. Please review your recent purchase.
By sharing your review, you will help others to make advised decision about what they buy from us. Thanks for contributing.
You must log in to submit a review.