We hope you enjoy reading this blog post.
Become a Pro Trader by using our fine-tuned Indicators and Expert Advisors.
Renko Chart Patterns That Work: Build Reliable and Profitable Trade Setups
Ever stared at a price chart only to feel your eyes glaze over from information overload? Those countless wicks, shadows, and micro-movements that leave you second-guessing every trading decision?
You're not alone. In the high-stakes arena of trading, the flood of market data can transform from helpful to paralyzing in seconds. That’s why many traders turn to Renko chart patterns, a simplified way to visualize price action without all the noise.
Many savvy traders have been quietly switching to Renko charts, the minimalist approach to market analysis that strips away the unnecessary and leaves only what truly matters: significant price movement.
Born in Japan (where trading ingenuity seems to flourish), these brick-based charts eliminate the element of time, creating a visual rhythm that reveals the market's genuine pulse beneath the chaos.
Unlike their flashier candlestick cousins that record every market hiccup, Renko charts remain stoically silent until price moves enough to matter. It's like having a trading mentor who only speaks when there's something important to say – and in trading, that kind of clarity is worth its weight in gold.
Renko Charts, The Building Blocks of Clear Analysis

Originating from Japan, the term "Renko" derives from the Japanese word "Renga," meaning bricks. True to their name, these charts display price movements as a series of bricks positioned at 45-degree angles, creating a visually clean representation of market direction.
Unlike traditional charts that plot price against time, Renko charts focus exclusively on price changes of a predetermined size.
This unique approach offers a distinct advantage: by filtering out minor price fluctuations, Renko charts dramatically reduce market noise, allowing traders to identify trends, support and resistance levels, and pattern formations with remarkable clarity.
How Renko Bricks Form
A new Renko brick appears only when the price moves by a specified amount (the brick size) in either direction:
- Green bricks (or white, depending on your chart theme) represent upward price movements.
- Red bricks (or black) indicate downward price movements.
Importantly, a new brick is never placed adjacent to the previous one. It must be positioned diagonally, creating that distinctive stair-step pattern that makes Renko charts instantly recognizable.
The brick size is user-defined and can be adjusted according to your trading style and the specific asset you're trading. Larger brick sizes filter out more price movement, creating a smoother chart with fewer reversals but potentially missing smaller trading opportunities.
Smaller brick sizes capture more price action but may introduce more noise into your analysis.
The KT Renko Patterns Indicator: Revolutionizing Renko Pattern Recognition
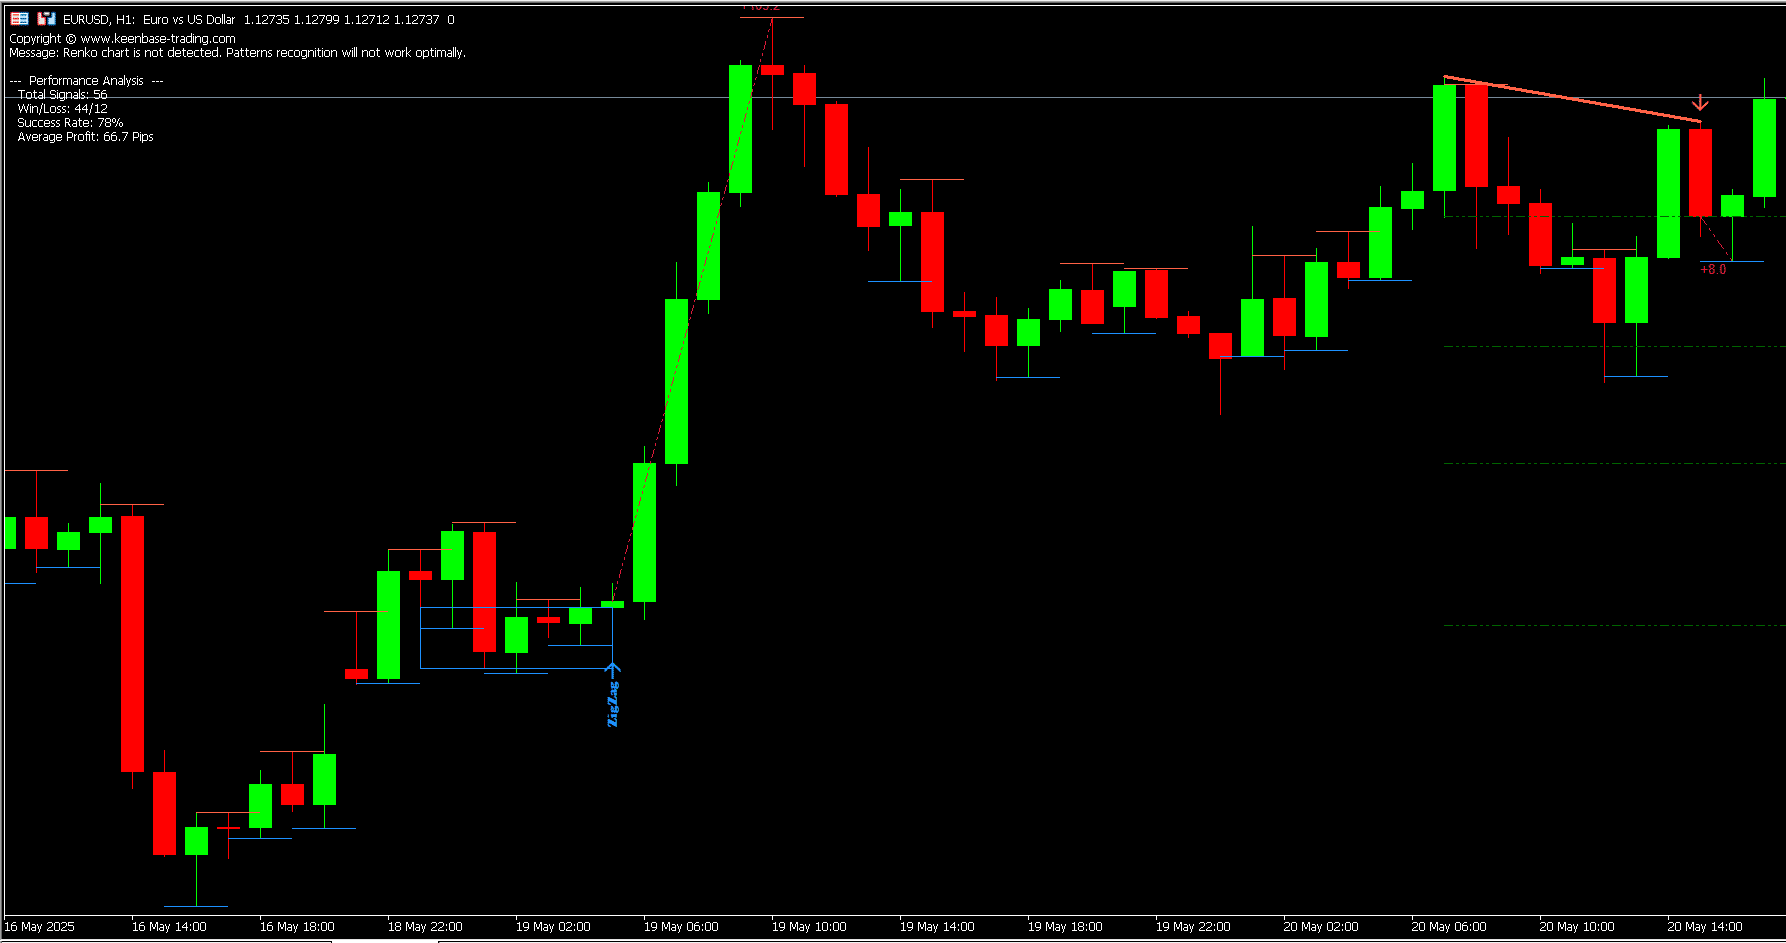
While Renko charts themselves offer significant clarity advantages, identifying specific patterns still requires experience and a trained eye. This is where the KT Renko Patterns Indicator from Keenbase Trading becomes an indispensable tool for serious traders.
This powerful MT4/MT5 indicator automatically scans Renko charts brick by brick, identifying high-probability pattern formations that might otherwise be missed.
By combining the noise-filtering benefits of Renko charts with sophisticated pattern recognition algorithms, the indicator gives traders a significant edge in pattern identification and trade timing.
Key Features of the KT Renko Patterns Indicator
The KT Renko Patterns Indicator offers several powerful capabilities that transform how traders interact with Renko charts:
- Automated Pattern Recognition: The indicator scans the chart brick by brick to identify high-probability trading patterns, marking them directly on your chart for easy visualization.
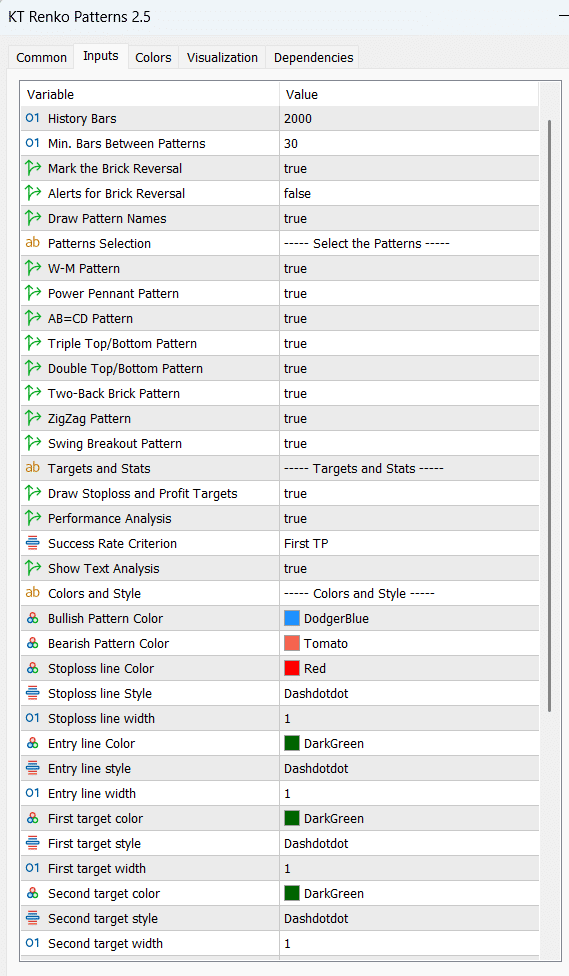
- Performance Analysis: It measures the success rate of different patterns based on historical data, helping you focus on the most profitable setups for your particular market.
- Customizable Settings: Adjust the Renko brick size and other parameters to match your specific trading style and the volatility of your chosen market.
- Alert System: Receive notifications when new pattern formations occur, ensuring you never miss a trading opportunity.
- Clear Visual Signals: Pattern names are displayed directly on the chart, eliminating any confusion about which pattern has formed.
Chart Patterns: The Universal Language of Market Psychology
Chart patterns represent the collective psychology of market participants, and they appear across all chart types, from traditional candlestick charts to Renko. However, these patterns are often clearer and more reliable on Renko charts due to the reduced noise.
Let's explore some of the most powerful patterns the KT Renko Patterns Indicator can identify:
Double-Top Pattern
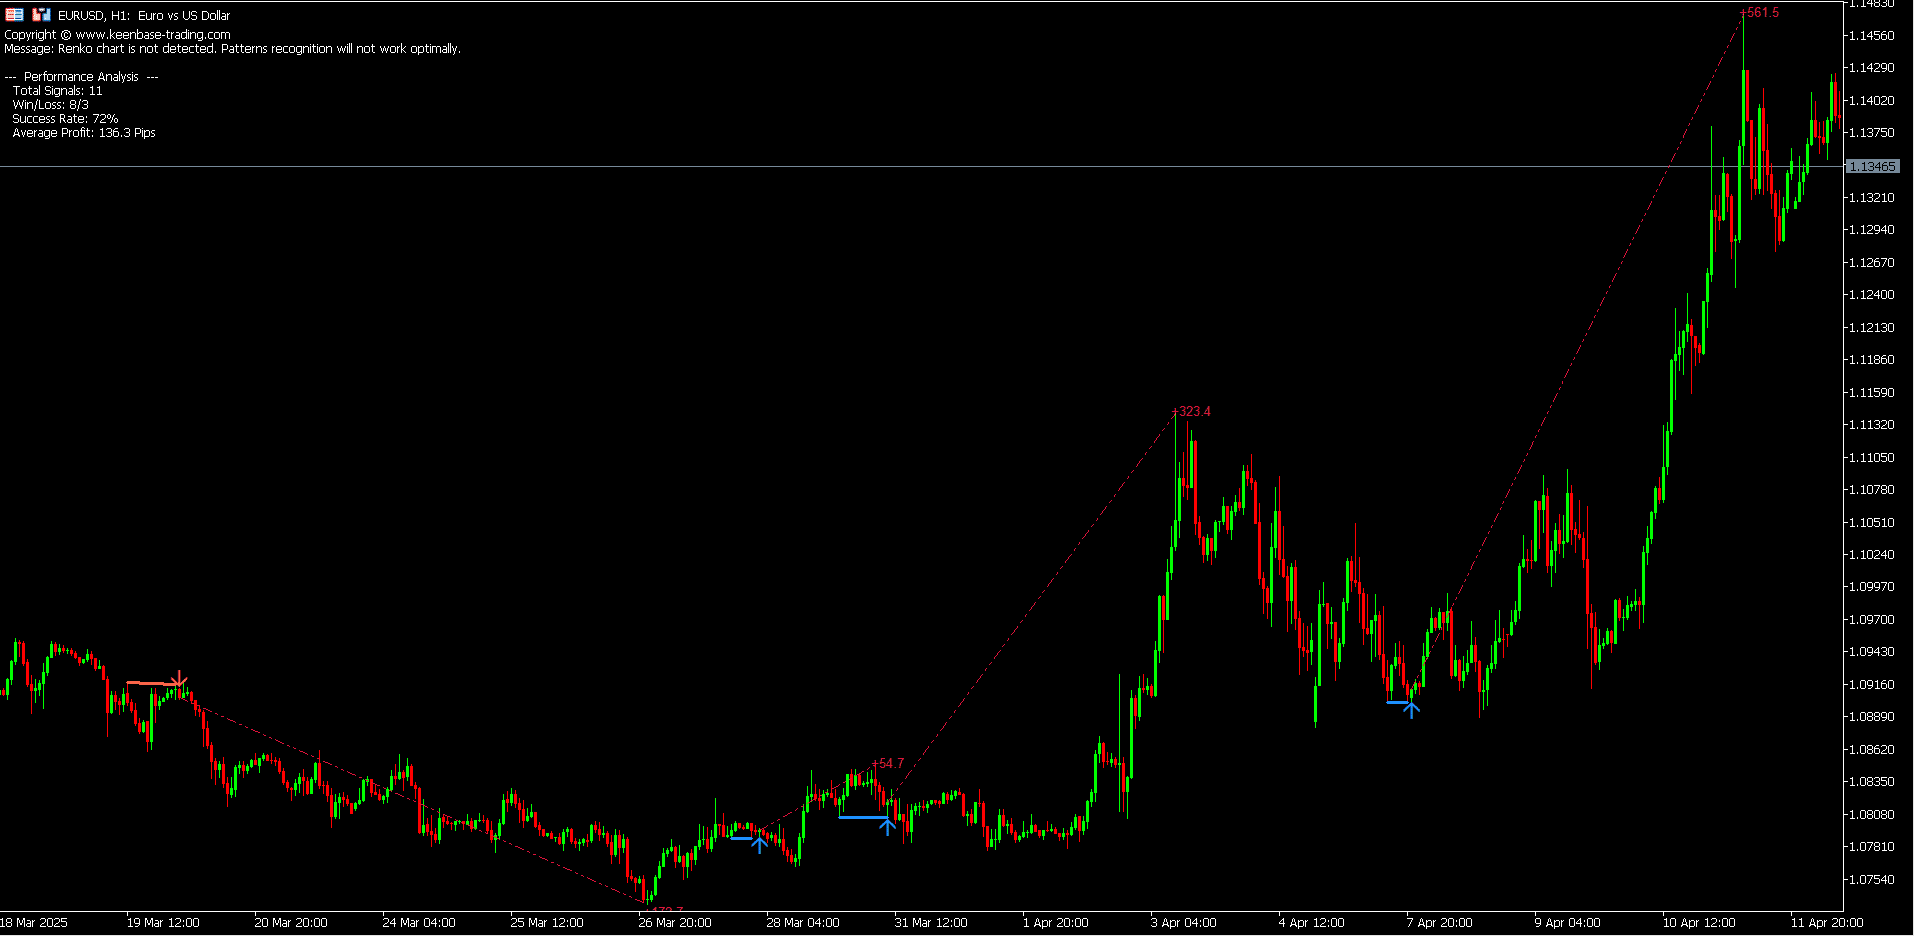
A Double-Top is a bearish reversal pattern consisting of two consecutive price peaks at approximately the same level. On a Renko chart, this pattern appears as a series of green bricks that reach a certain level, pull back slightly, attempt to reach that level again, and then reverse with red bricks.
The KT Renko Patterns indicator automatically identifies this pattern, allowing traders to enter short positions with precise timing, typically on the first opposite brick after the completion of the second high.
Two Back Strike Pattern
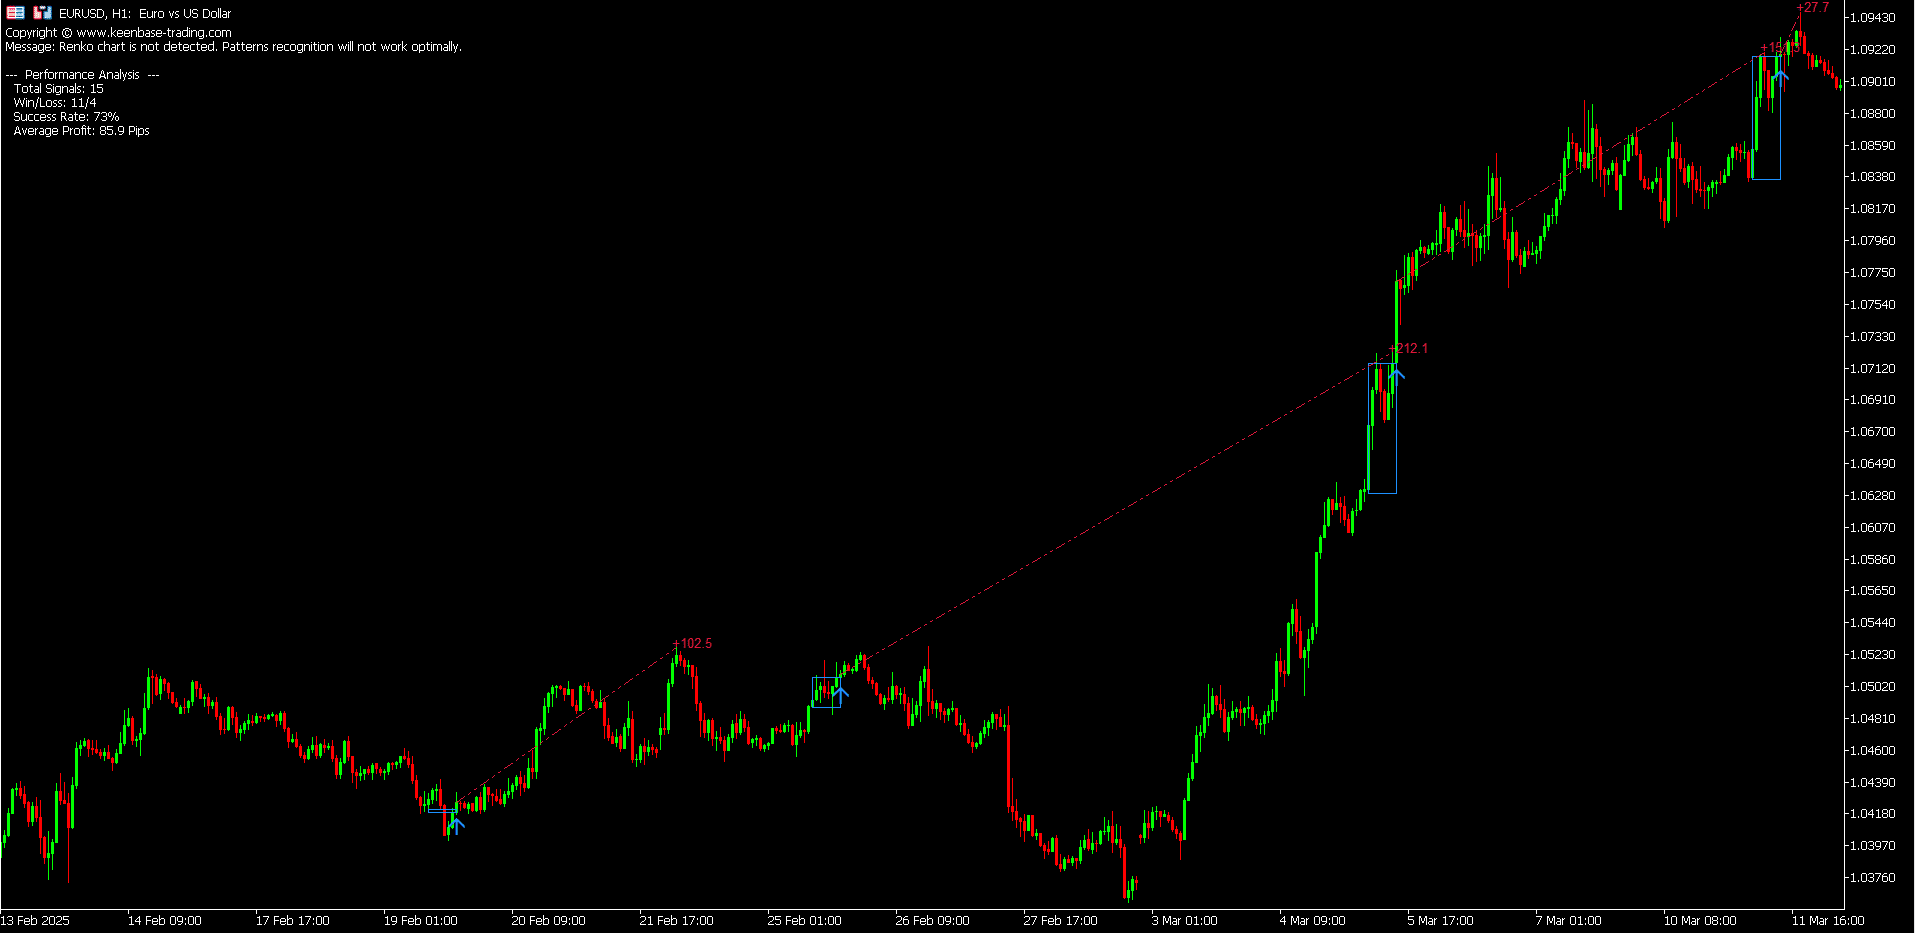
The Two Back Strike is a trend continuation pattern that occurs after a small correction of two Renko bricks. It indicates that the previous trend is likely to continue, offering a low-risk entry point to ride the ongoing trend.
When the indicator identifies this pattern, traders can enter with confidence, knowing that their entry has historical statistical backing.
Zigzag Pattern
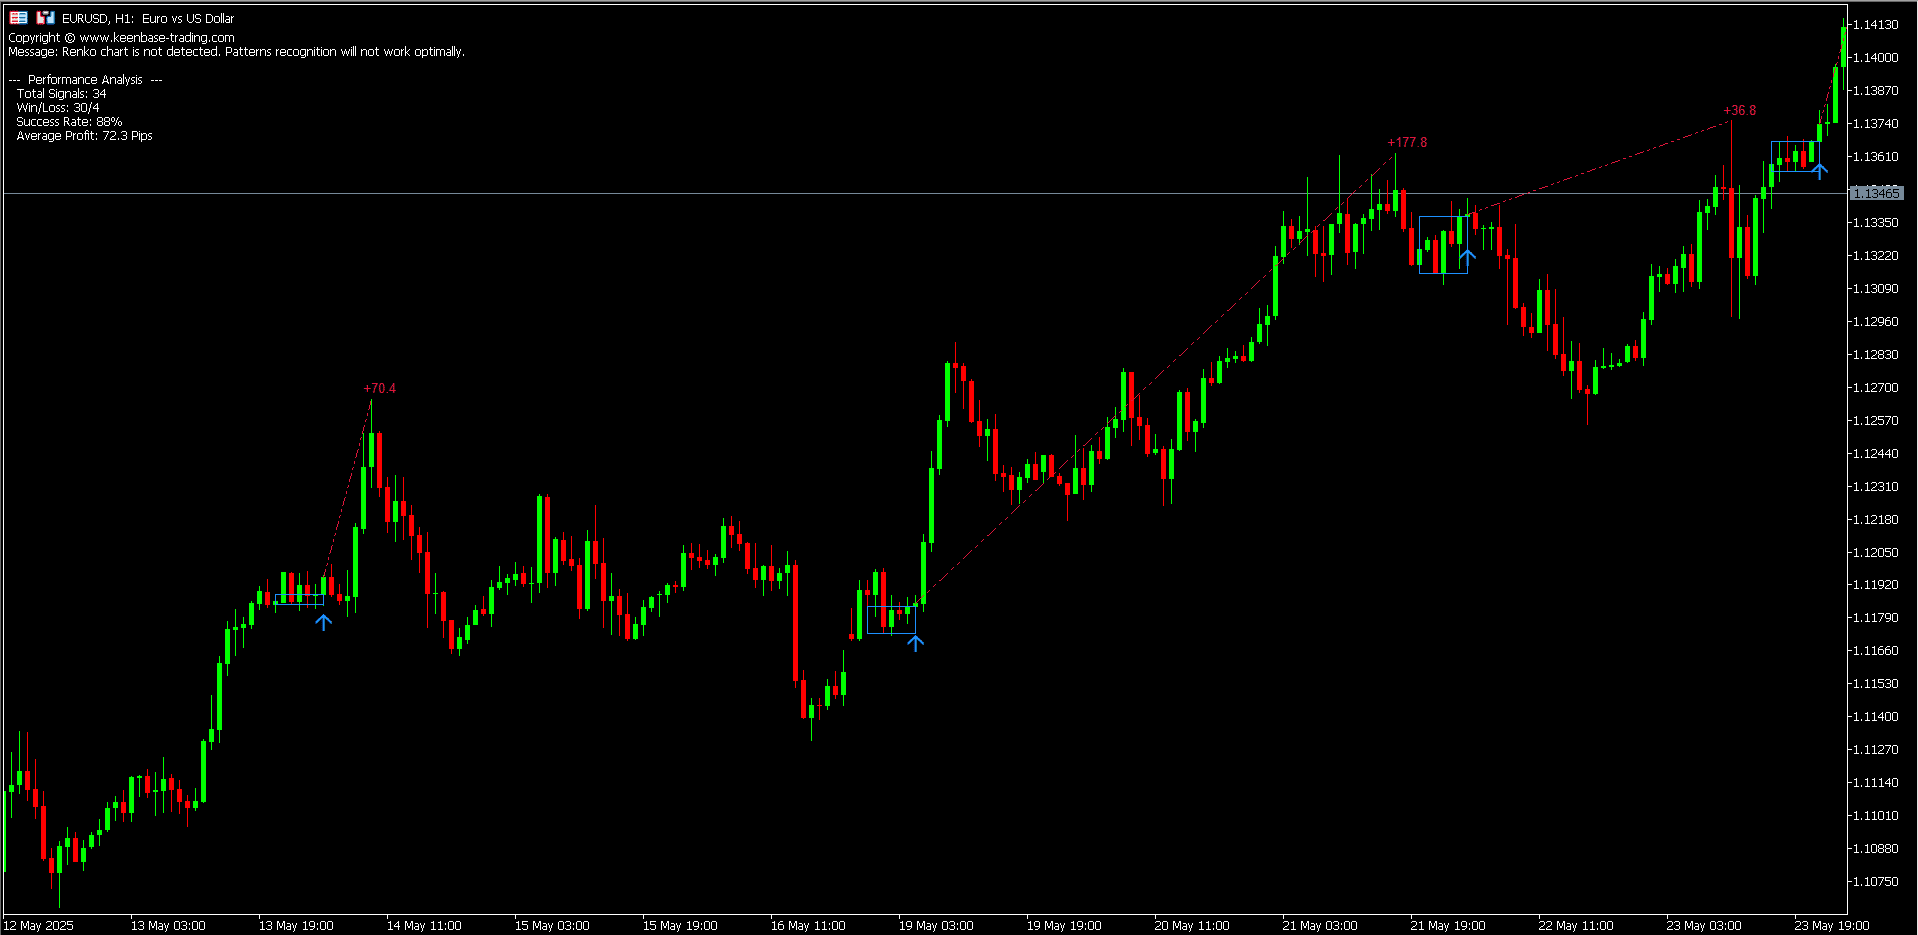
The Zigzag pattern consists of indecisive alternating bricks followed by a decisive breakout in either direction. Specifically, it appears as a series of five alternating color bricks followed by two consecutive bricks of the same color, indicating a potential new trend direction.
This pattern is particularly valuable for identifying the end of consolidation periods and the beginning of new trending moves.
Swing Breakout Pattern
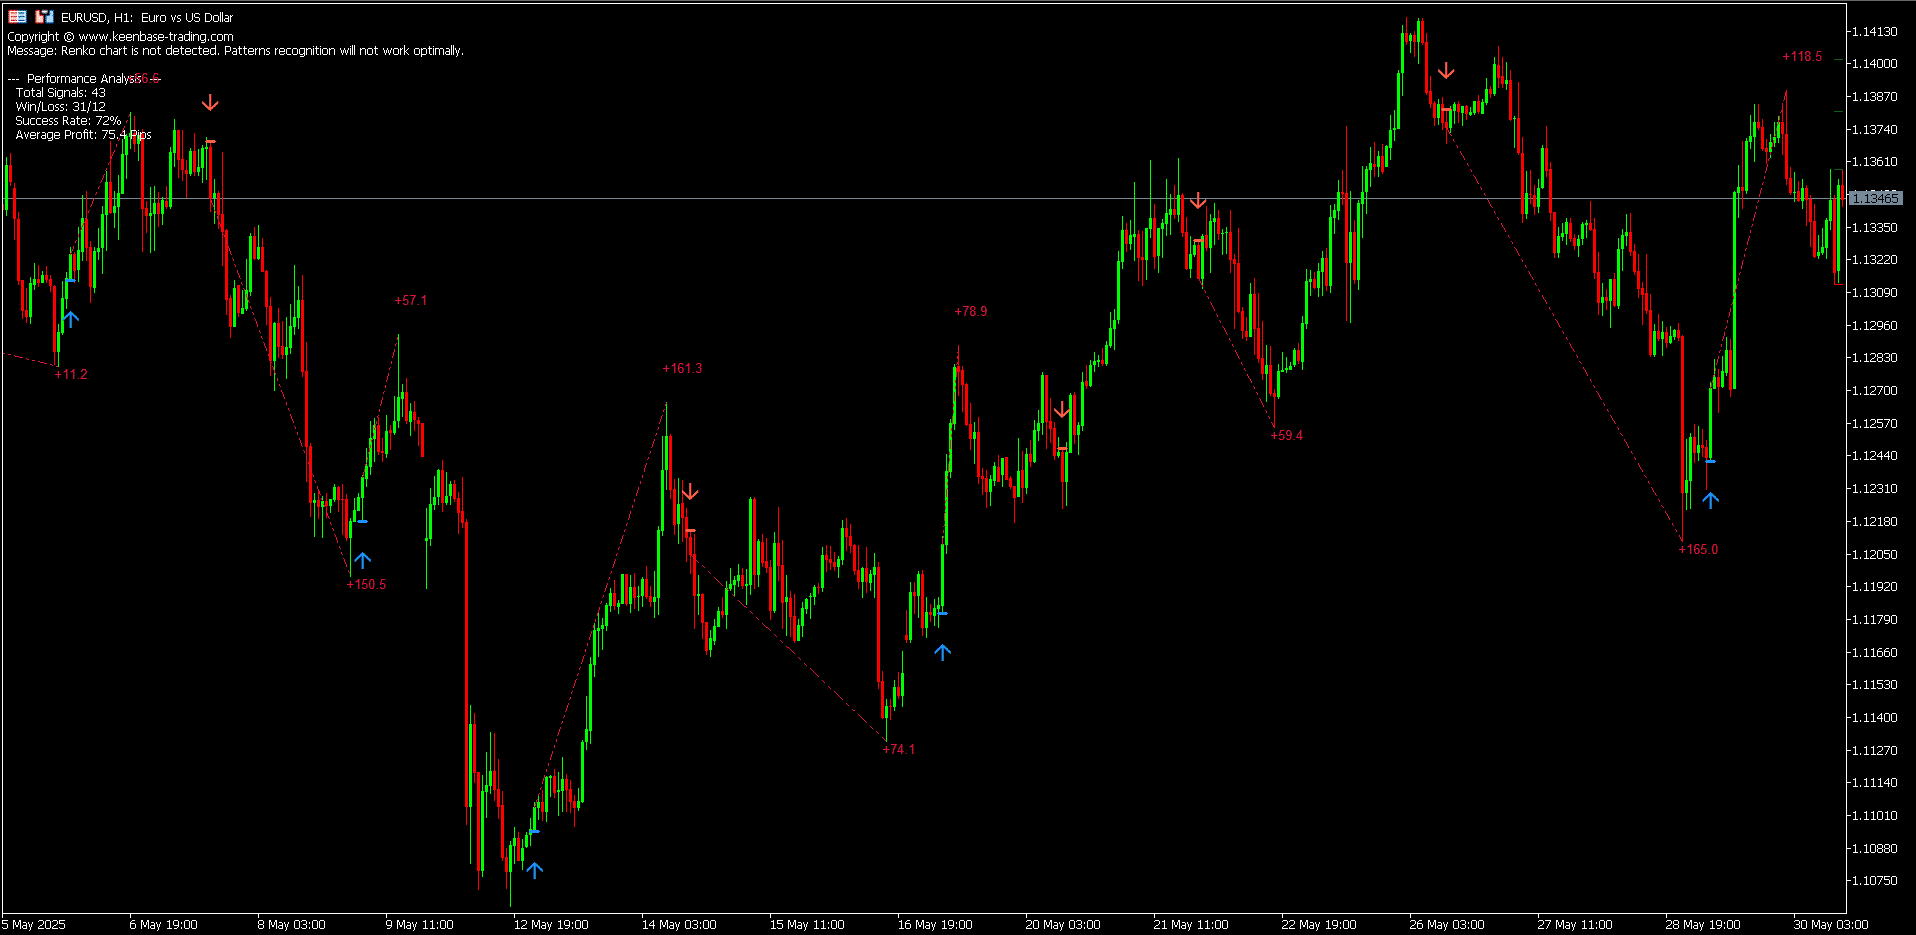
The Swing Breakout pattern identifies when price breaks above a previous swing high (in a bullish case) or below a previous swing low (in a bearish case) after a small correction. This pattern is excellent for capturing the beginning of strong trending moves.
Comparison with Other Chart Types: When to Choose Renko
While Renko charts offer significant advantages, understanding their relationship to other chart types helps traders make informed decisions about when to use each:
Renko vs. Candlestick Charts
Traditional candlestick charts show open, high, low, and close prices for specific periods, providing detailed information about price movement and market sentiment. However, this detail comes at the cost of increased visual noise.
Renko charts sacrifice some detail (particularly time-based information) in exchange for clarity of trend direction. They're particularly valuable when you need to filter out market noise to see the dominant trend more clearly.
Renko vs. Bar Charts
Bar charts, like candlesticks, are time-based and show open, high, low, and close prices. They provide a traditional view of market action but contain similar noise issues to candlestick charts.
Renko charts offer a cleaner alternative that focuses purely on price changes of significance, making trend identification more straightforward.
Developing Effective Trading Strategies with Renko Charts
The KT Renko Patterns Indicator doesn't just identify patterns, it provides the foundation for comprehensive trading strategies. Here are several approaches to incorporating this powerful tool into your trading:
Trend Trading with Renko
Renko charts excel at trend identification, making them perfect for trend-following strategies. The consistent stair-step pattern of bricks in the same color clearly shows the trend's direction and strength.
Strategy components:
- Use the KT Renko Patterns Indicator to identify the prevailing trend.
- Look for continuation patterns like the Two Back Strike to enter in the trend direction.
- Set stop-loss orders below support in uptrends or above resistance in downtrends.
- Ride the trend until a pattern indicating potential reversal appears.
Support and Resistance Trading
The simplified nature of Renko charts makes support and resistance levels particularly clear. These levels occur where price has repeatedly reversed in the past.
Strategy components:
- Identify key support and resistance levels on the Renko chart.
- Watch for pattern formations at these levels using the KT Renko Patterns Indicator.
- Enter long positions at support with bullish patterns.
- Enter short positions at resistance with bearish patterns.
- Place tight stop-losses beyond the support or resistance level.
Combining Renko with Other Technical Indicators
While Renko charts provide excellent trend clarity on their own, combining them with select technical indicators can create even more robust trading systems. For effective combinations, consider:
- Moving averages for additional trend confirmation.
- Relative Strength Index (RSI) for identifying potential reversal points.
- Momentum indicators to gauge the strength of the current trend.
The KT Renko Patterns Indicator works harmoniously with these tools, creating a comprehensive trading approach that leverages the strengths of multiple analysis techniques.
Analyzing Market Data: Extracting Maximum Value from Renko Charts
To fully leverage the power of Renko charts and the KT Renko Patterns Indicator, consider these advanced techniques:
Multi-Timeframe Analysis
While Renko charts don't have traditional time-based frames, you can create multiple Renko charts with different brick sizes to simulate multi-timeframe analysis:
- Larger brick sizes for longer-term trend identification.
- Smaller brick sizes for entry and exit timing.
The indicator can be applied to both, allowing you to confirm patterns across different "timeframes" for higher-probability trades.
Pattern Confluence
The most powerful trading signals often occur when multiple patterns align. The KT Renko Patterns Indicator helps identify these confluences, creating higher-probability trade setups.
For example, a bullish Two Back Strike pattern occurring at a major support level represents a stronger trading signal than either factor alone.
Effective Trading with Chart Patterns and Trends
The ultimate goal of any charting approach is to improve trading decisions. Here's how to effectively implement the insights gained from the KT Renko Patterns Indicator:
Entry and Exit Strategy
- Entries: Enter trades when the KT Renko Patterns Indicator identifies a pattern that aligns with your analysis of the broader market context.
- Stop-Loss Placement: For bullish patterns, place stops below the pattern's formation; for bearish patterns, place stops above it.
- Take-Profit Targets: Use previous swing highs or lows as potential targets, or implement a trailing exit based on brick reversals.

Risk Management Integration
Successful trading requires more than just pattern identification, it demands proper risk management. When trading with the KT Renko Patterns Indicator:
- Limit risk per trade to a small percentage of your account (typically 1-2%).
- Size positions based on the distance to your stop-loss.
- Consider scaling out of winning positions to lock in partial profits.
Getting Started with the KT Renko Patterns Indicator
Ready to transform your trading with the clarity of Renko chart patterns? Here's how to begin:
- Set up Renko charts on your MT4/MT5 platform using the KT Renko Chart Generator.
- Install the KT Renko Patterns Indicator.
- Experiment with different brick sizes to find the optimal setting for your trading style and the markets you trade.
- Study the patterns identified by the indicator and their historical performance.
- Start with small position sizes as you learn to trade with Renko chart patterns.
For traders looking to fully automate this strategy, Keenbase Trading also offers the KT Renko Patterns EA, which automatically executes trades based on the patterns identified by the indicator.
Conclusion: Elevating Your Trading with Renko Chart Patterns
In the quest for trading consistency, clarity of market analysis is paramount. Renko charts provide this clarity by filtering out the noise that often clouds trading decisions on traditional charts.
When combined with the pattern recognition capabilities of the KT Renko Patterns Indicator, they create a powerful system for identifying high-probability trading opportunities.
Whether you're a novice trader seeking a clearer view of market direction or an experienced professional looking to enhance your pattern recognition capabilities, the combination of Renko charts and the KT Renko Patterns indicator offers a significant advantage in today's complex markets.
By focusing on price movements that matter and automating the identification of high-probability patterns, this approach allows you to trade with greater confidence, precision, and ultimately, success.
Ready to experience the clarity and precision of Renko chart pattern trading? Explore the KT Renko Patterns Indicator today and transform how you view and trade the markets.
Take Your Trading to Next Level
Take Your Trading to Next Level
You Might Also Like:

