We hope you enjoy reading this blog post.
Become a Pro Trader by using our fine-tuned Indicators and Expert Advisors.
How to Optimize an EA on MT4 | MT5 for Live Trading

Due to excessive marketing and hype created by marketers, Expert advisors (trading robots) have gained a bad reputation in the industry.
In reality, an expert advisor is just a piece of software that contains the instructions to make the trading decision based on a trading strategy.
If you have a trading strategy that you think might succeed in the market, you should get it converted (or code it yourself) into an expert advisor for the following reasons:
- Ability to backtest: It is challenging for manual traders to find what parts of their trading strategy work and what don't. With Algo-trading using an expert advisor, they can run their trading on past data to see if it would have worked in the past.
This is one of the significant advantages of automated trading over manual trading, as it helps to find and remove any flaws in a trading system before going live with the system. - Accuracy: Unlike an expert advisor, buying or selling the wrong currency pair or for the wrong lot size in manual trading is much more possible. The pre-written algorithm can make sure it double-checks the order details before sending it to the broker's server.
- Speed: One of the main reasons is speed. Since EAs are written beforehand and executed automatically, the rate at which trades are made is nearly impossible for a human to perceive.
- Reduced transactions cost: Compared to a manual trader, an EA can place the trades at a much faster rate which often leads to lesser transaction costs.
- Eliminate Human Emotions: Trading robots eliminate human emotions and behavioral problems like exiting too early or too late from a trade.
Despite having many advantages over manual trading, traders are still skeptical about expert advisors.
As a result, hardcore marketers and scammers have been promoting them like a magic formula in a black box, making you rich over months, if not overnight.
So if we remove the marketers and scammers from the situation, why do many expert advisors fail in live trading?
The answer is..... Either under-optimization or over-optimization.
Financial markets are dynamic and continuously changing. Therefore, an EA should be optimized at least once a year to adjust the trading strategy according to the new market conditions.
This article briefly explained optimizing an expert advisor and preparing it for live trading.
What is EA optimization?
Optimizing an expert advisor means finding the input parameters in EA that maximize the profit or any given criteria (such as the Sharpe ratio).
For example, if you have a moving average crossover system, it buys when fast-moving averages exceed the slow-moving average. It sells when fast moving average cross below the slow-moving average.
The optimized Forex EA would offer the optimal parameter values of fast and slow-moving averages that lead to maximum profit on history data.
What is Curve Fitting?
Curve fitting in trading is designing a trading system that adapts so closely to historical data that it loses its predictive power and becomes ineffective in the future.

Source: How to Figure out Overfitting and Underfitting With Machine Learning Algorithms
EA optimization is both science and art. If you over-optimize, the system will be susceptible to curve fitting and lose its predictive power in live trading, and if you under-optimize, the EA will under-perform.
In a nutshell, Optimization means “to make fit” a system; that is, to adapt a system to the market we intend to trade.
To demonstrate the complete EA optimization process, I will test and optimize the KT CCI Divergence EA on EURUSD 1-Hour.
Curve fitting is a by-product of MT4 EA optimization. We cannot avoid it entirely, but we can surely minimize it by following a particular optimization sequence and optimizing each input parameter separately.

We can divide the input parameters of CCI Divergence EA into three main sections:

Backtesting result with the default inputs:

Net Profit | DrawDown | Total Trades | Profit % | Profit Factor |
|---|---|---|---|---|
$5380
Fill Counter
| 88%
Fill Counter
| 1799
Fill Counter
| 54%
Fill Counter
| 1.06
Fill Counter
|
Even with default input parameters, the strategy has shown some signs of profitability. But it is not desirable to trade the strategy having such a massive drawdown of 88%.
Before we dive into the optimization process, we must understand the objective function.
According to Wikipedia, an optimization problem consists of maximizing or minimizing an objective function by systematically choosing input values from within an allowed set and computing the value of the function.
So looking at the testing results above, what value would you choose to improve?
If you choose to optimize the net profit value, there is a possibility that the value of net profit will improve, but the drawdown value will not come down.
If you choose to optimize the profit percentage, the profit percentage will likely increase to 90%. Still, net profit will come down to a negative value (profit percentage is highly overrated in quantitative trading).
So what objective functions would you choose to improve so that it supports and enhance the overall strategy performance?
We have incorporated a custom objective function in all our expert advisors to solve this problem. When you choose to improve this aim of custom function, if not all, but most of the time, overall strategy results will improve.
Setup the MT5 Strategy Tester Optimization
Symbol selection should be according to the EA's strategy.
As we will perform a sequential optimization, we use the "slow complete algorithm" optimization method instead of the genetic algorithm because the latter is more prone to curve fitting.

Optimizing the CCI period:

Creating a 2-D graph using Excel
To find a stable value among the optimization data, a 2-D chart must be made.
CCI Period 2-D graph:

Changing the CCI period to 46 provides the following optimization results:

Net Profit | DrawDown | Total Trades | Profit % | Profit Factor |
|---|---|---|---|---|
$15,116
Fill Counter
| 27%
Fill Counter
| 1219
Fill Counter
| 61%
Fill Counter
| 1.21
Fill Counter
|
The equity line has improved a lot. A simple change of the CCI period from 14 to 46 has increased the net profit by 280% while reducing the drawdown to 27% from a massive drawdown of 88%.
This is an astonishing improvement because we have not added filters or stop-loss/take-profit.
You may be wondering why I've not chosen a CCI period of 50, where we would have got the maximum value of our optimization function and the maximum net profit.
Instead of choosing a maximum outlier, selecting a stable value with a good number of adjacent members is always better.
The neighborhood of your chosen parameter must be nearly as profitable as your selected system parameter, and the more extensive this profitable parameter range is, the better.
"If you don't like the neighboring numbers, you've got a problem, because odds are, you will wind up with the results of the neighboring set of parameters."
- Murray Ruggiero, professional trading system developer.
We have successfully optimized the entry parameter. Now we can proceed ahead with adding filters...

Instead of optimizing a single value, we are now looking to add appropriate filters using the optimization feature in Metatrader.
Finding a stable value within the parameter space is not applicable in this case.
So, I've chosen an optimized value that provides reasonable improvements with a good number of trades to have some statistical advantage in the trading system.

After adding the suitable filters, we've got the following result:
")
Net Profit | DrawDown | Total Trades | Profit % | Profit Factor |
|---|---|---|---|---|
$17,616
Fill Counter
| 13%
Fill Counter
| 657
Fill Counter
| 65%
Fill Counter
| 1.50
Fill Counter
|
Adding the suitable filters has slightly increased the net profit but significantly decreased the drawdown from 27% to 13% while boosting the profit factor from 1.21 to 1.50.
Moving forward to the final and last stage of our EA optimization, we will find and add suitable stop-loss and take-profit.
Instead of using the fixed number of pips for SL and TP, we'll use the ATR (Average True Range) to make the calculation proportional to the market volatility.
At Keenbase-Trading, each of our EA provides a choice to set the stop-loss and take-profit using the market volatility.

Stoploss 2-D graph:


Take-Profit 2-D graph:
After adding the SL and TP, we've got the following result:

Net Profit | DrawDown | Total Trades | Profit % | Profit Factor |
|---|---|---|---|---|
$17,979
Fill Counter
| 9%
Fill Counter
| 685
Fill Counter
| 67%
Fill Counter
| 1.58
Fill Counter
|
Move the slider left and right to compare the before and after optimization equity graph:
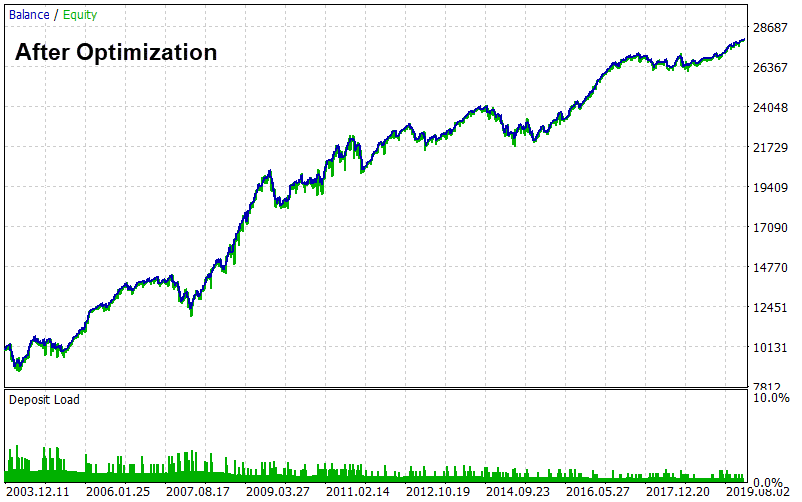
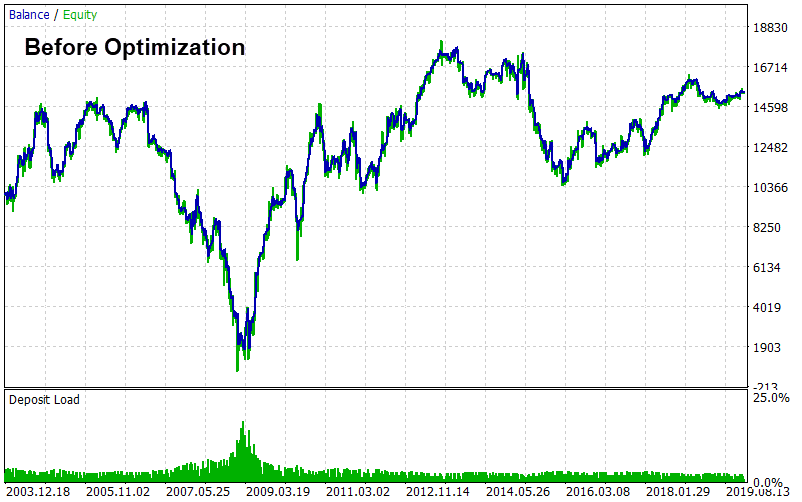
Comparing the final result with the initial result:
- The net profit has increased by 334%.
- One of the significant improvements we got after the ea optimization is that the drawdown has reduced to just 9% from a high value of 88%.
- The number of total trades has reduced to 685, which is still a good number having statistical significance.
- The profit percentage has increased to 67% from 54%.
- The profit factor has increased to 1.58 from 1.06.
Conclusion:
- The Optimization has been done using a fixed lot size of 0.1 per trade; money management such as a fixed fractional method will further boost the net profit and provide exponential equity growth.
- Advanced traders can validate the final model using strategy testing like Monte Carlo simulation, out-of-sample, or walk-forward analysis.
- After Optimization, it is advisable to closely monitor the model's performance in a live market using a demo account or a small real account for at least six months.
Take Your Trading to Next Level
You Might Also Like:
Kemajuan detail analisa yang bagus, sehingga mendapatkan hasil yang teruji dengan baik. semoga saya bisa memiliki.. sukses selalu. aamiin
semoga berhasil
Thank you for the lecture. After optimization, Trade where better. Which EA will you recommend that has gone through the process up to the optimization. Looking forward to here from you.
Yours faithfully,
Isaac OHIOKHAI
Almost all of our EAs have gone through the optimization. However, the optimization should be repeated at least once a year to prevent future performance deterioration.
Hi, so I do not need to do the optimisation for the new rsi divergence EA I just purchased right?
It’s better to get started with a fresh optimization after the purchase.