We hope you enjoy reading this blog post.
Become a Pro Trader by using our fine-tuned Indicators and Expert Advisors.
How to Trade Pennant Pattern in the Forex Market
In Forex market, there are a countless number of candlestick patterns. Pennant pattern is one of the candlestick patterns that is extensively used by traders to make trading decisions. When the pennant pattern is combined with logic and other technical factors, it works phenomenally.
Pennant Pattern is a candlestick pattern that goes hand in hand with trend trading. So, before getting right into the topic, let’s comprehend a trending market with its components.
Understanding the Trending Market
Any market moving in a particular direction over time is called a trend. It is said to be the most powerful state of the market.Technically, a trending market is the one that progresses by making higher highs or lower lows.
Trends can be classified into two types – Uptrend and Downtrend.
An uptrend is a sequence of higher highs and higher lows, while a downtrend is a set of lower lows and lower highs.
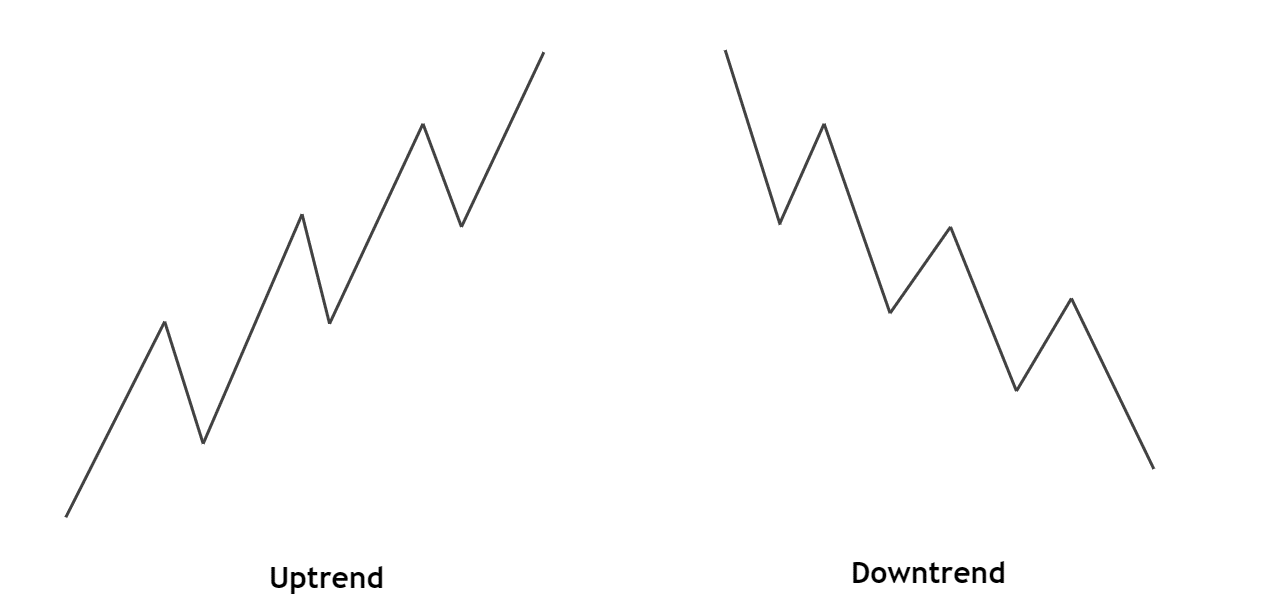
Phases of a Trend
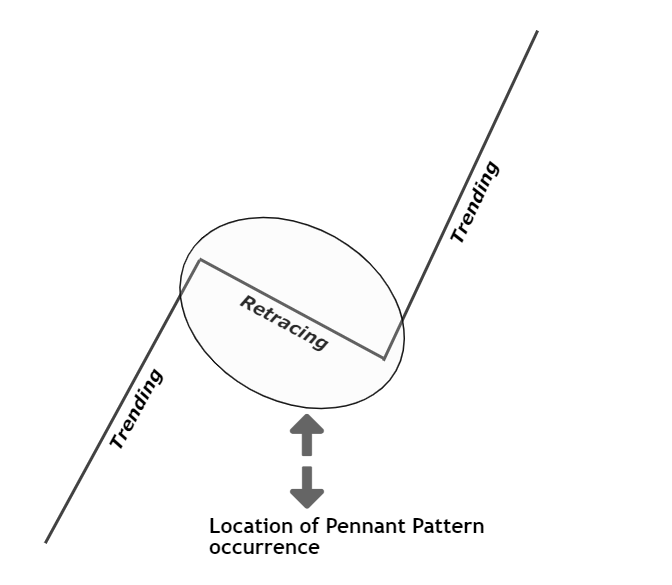
Every trend has two phases:
- Trending phase
- Pullback/Retracement phase
The combination of these two is what makes a trending market.
How is Pennant Pattern related to a Trending Market?
A pennant pattern and a trend are closely related because the pennant pattern is the pullback/retracement phase of a trend. Thus, the pennant pattern is basically a trend continuation pattern.
Definition of the Pennant Pattern
Pennant is a symmetrical triangle looking like a pattern that is formed on the charts of security.
The pennant pattern forms after a strong trending move, be it up or down. And it predicts the upcoming move in the market. Thus, it is referred to as a trend continuation pattern.
Characteristics and Formation of Pennant Pattern
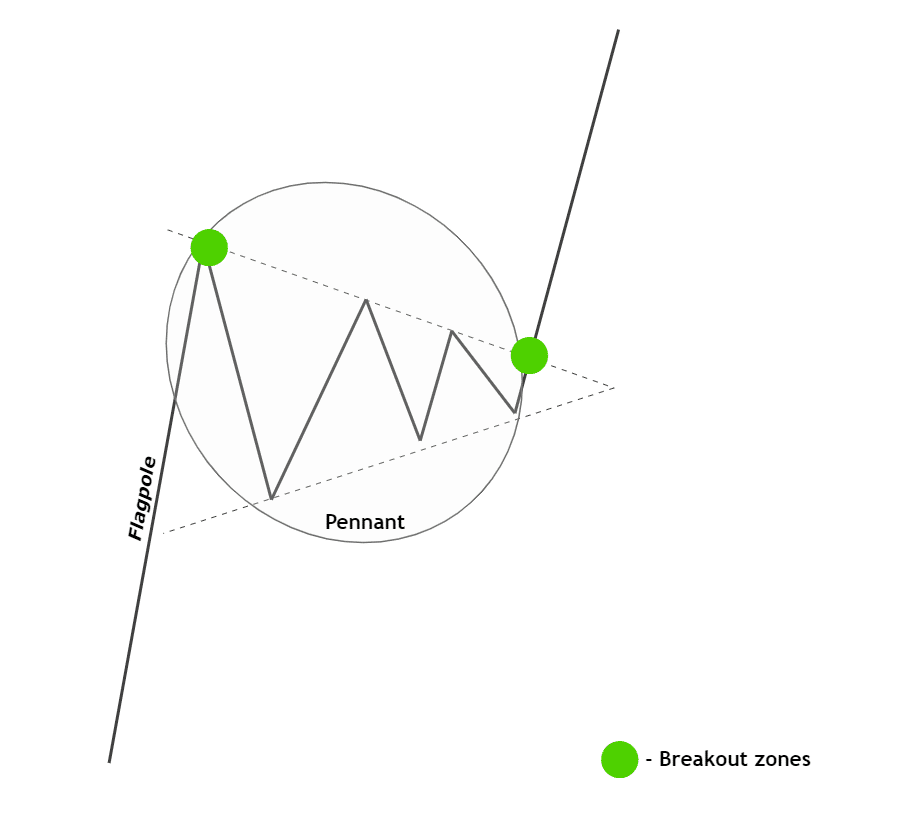
A flagpole
The pennant pattern starts off with a strong vertical movement in the market. This move differentiates pennant pattern from other patterns such as the symmetrical triangle pattern.
The Pennant
Following the flagpole, the market goes into a consolidation state. In terms of structure, the retracement looks like two trend lines are converging. In other words, it appears like a triangle with a tilted base.
The Breakout Zone
After the consolidation state, the price prepares to break above/below the pennant. In addition to the breakout through the pennant, there is another breakout through the highest/lowest point made by the pennant. Hence, these two levels are the breakout zones in the pennant pattern.
Types of Pennant Patterns
As discussed, there are two types of trends in the market. Thus, we can have two types of pennant pattern based on the trend of the market:
- Bullish Pennant Pattern
- Bearish Pennant Pattern
Bullish Pennant Pattern
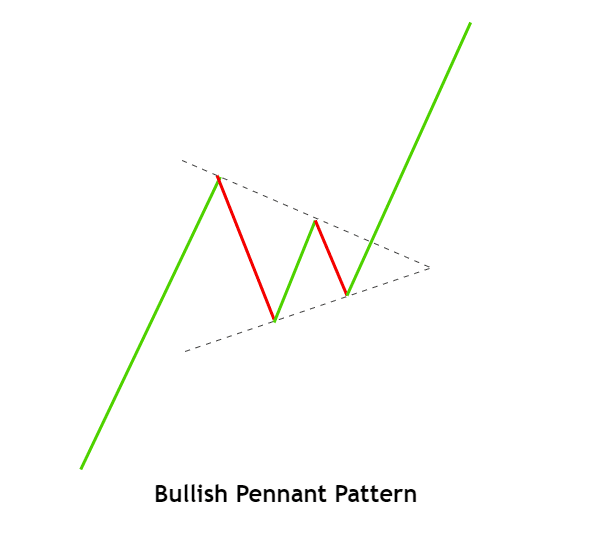
A bullish pennant pattern is the pennant pattern that indicates trending continuation towards the upside.
Formation and Comprehension
It is formed when the market makes a significant move north, consolidates for a period forming a triangle-like pattern. After enough consolidation, the price breaches through the upper trend line of the pennant pattern and makes a new higher high.
As per the pattern, we know that the price tends to continue the uptrend after the breakout. However, it is vital to understand the logic behind the indication provided by this pattern.
The initial powerful move up indicates that the buyers have begun to shown strength in the market. Following this push, the market goes into a consolidation phase, where the price makes higher lows and lower highs. This represents a neutral market (in a big uptrend.
Finally, the price breaks above the top trend line of the pennant pattern. Two points can be inferred from this breakout:
No lower high from the sellers – implying bears are weakening.
Higher low remained intact – indicating that the uptrend buyers are still around.
From both the above inferences, we can conclude that the market is more than likely to continue with the predominant uptrend.
Bearish Pennant Pattern
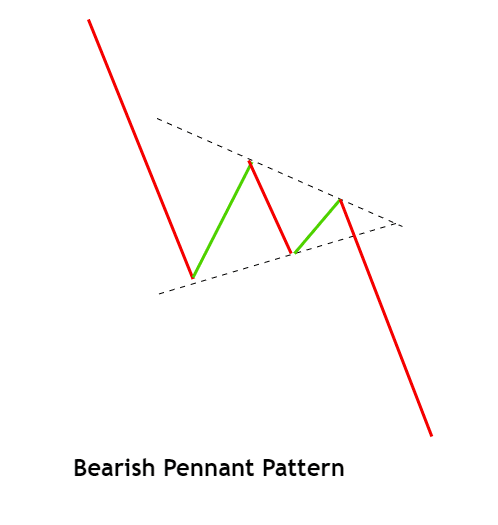
A bearish pennant pattern is a type of pennant pattern that indicates a downtrend continuation in the market.
Formation and Interpretation
Firstly, the market makes a strong steep move to the downside, indicating that the bears are in control of the security. It is then followed by a pullback/consolidation, where the price leaves higher lows and lower highs.
The triangle-like pattern indicates that the price is slowly inching upwards but is unable to make higher highs as the overall trend is dominated by the sellers.
After reaching towards the apex of the two converging trend lines, the market broke through the bottom trend line. This confirms that the bears are back in the market to proceed with a new lower low sequence.
Considering the complexity involved, it can be confusing to spot the pennant patterns manually. Luckily, we have developed a Pennant Pattern indicator for MT4/MT5 that can identify pennant patterns on the chart with high precision.
Pennant Pattern Trading Strategies
The pennant pattern is so powerful that it can be applied solely without any other technical factors. However, professional traders incorporate the pennant pattern in their strategy as an added confirmatory tool.
Strategy 1 - Bullish Pennant Pattern
The strategy to trade a bullish pennant pattern is simple. In addition to the three characteristics possessed by the pennant pattern, there are a couple of other criteria that must be considered before trading this pattern.
- The initial up move must break through a strong resistance level.
- The consolidation should not be intense. It must be shallow and visible.
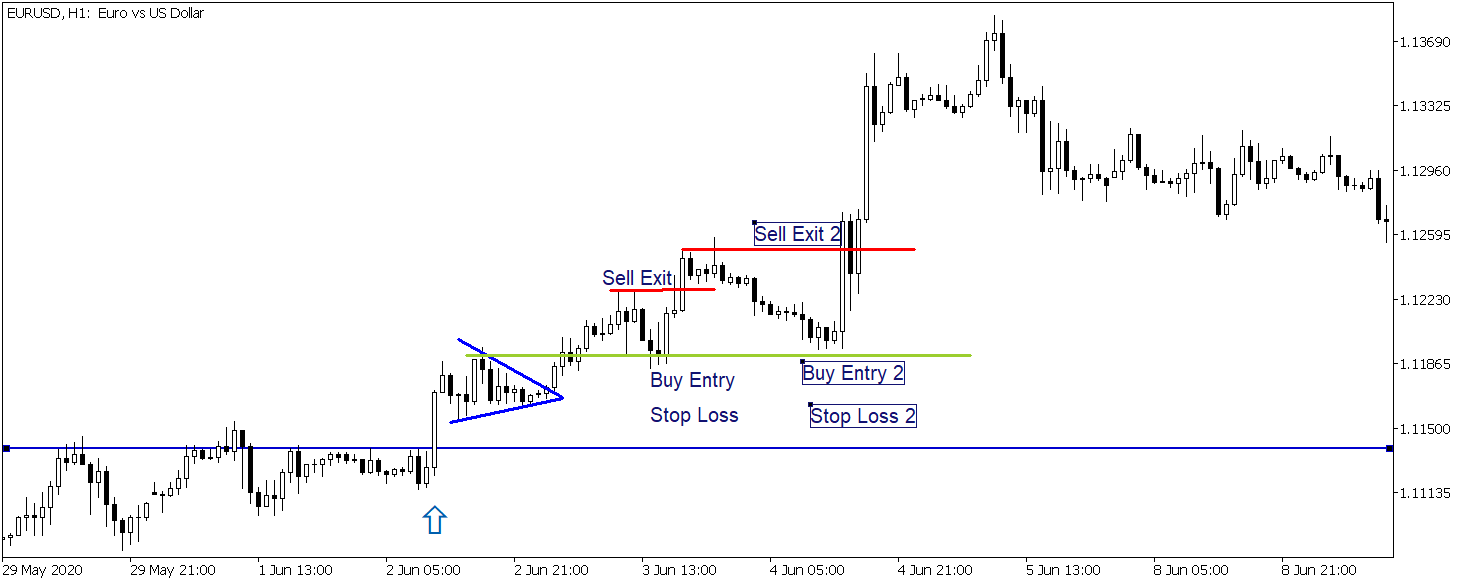
Consider the price chart of EURUSD given below. The market found resistance around 1.11500, as represented by the blue ray. On 2 June, the price broke through the resistance. This forms a legitimate flagpole of the pennant pattern.
The market then began to consolidate by making lower highs and higher lows. Marking them with two trend lines results in the formation of the pennant pattern.
Finally, the market managed to break through the upper trend line, indicating that the buyers have taken in charge of the market yet again.
Aggressive traders may enter right after a shallow pullback post the breakout. Conservative traders, on the other hand, must wait for the buyers to move to complete their push. Once the buyers are done, traders can go long when the price retraces.
After the first trade, there is another opportunity to enter, as shown on the chart.
Stop-Loss
The stop loss for this setup would be below the apex of the pennant pattern.
Take-Profit
Positions must be closed at the most recent resistance levels as the market could possibly turn its direction.
Strategy 2 – Bearish Pennant Pattern
The bearish pennant pattern can be traded similar to that of a bullish pennant pattern. However, this trade shows that the pattern performs the same without the consideration of the above two criteria.
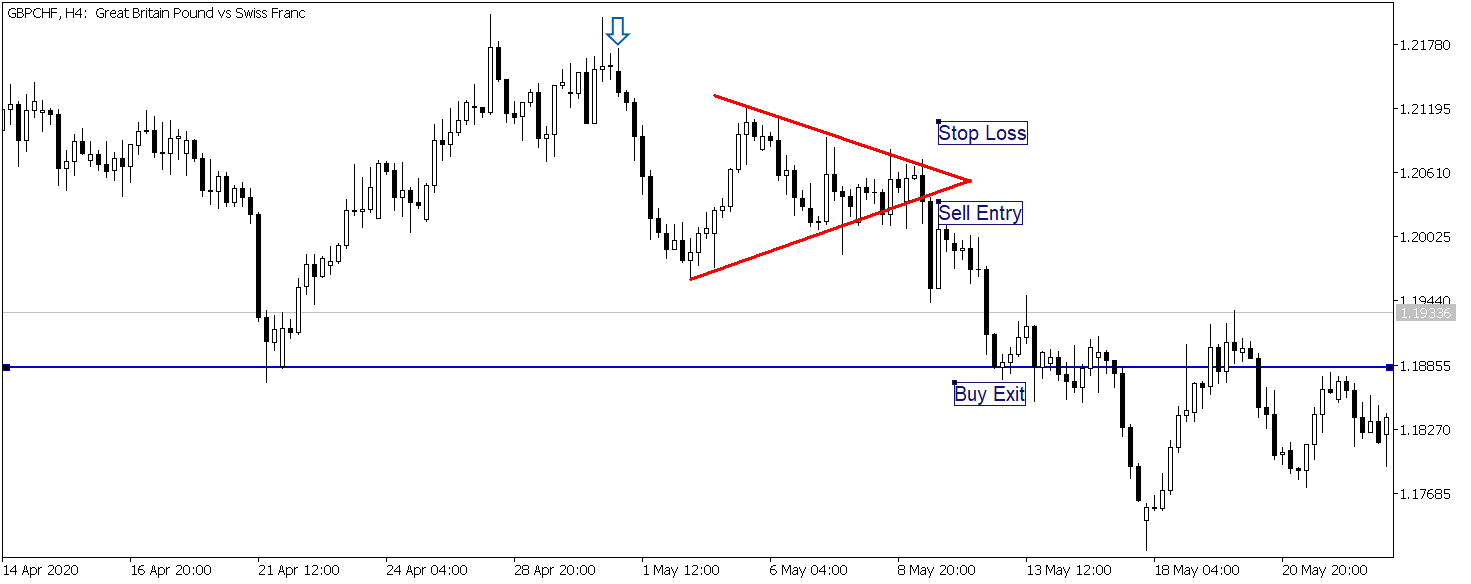
Consider the below chart of GBPCHF on the 4H timeframe. From the arrow, the market shot down hard, depicting a potential flagpole. The pullback came quite strongly and followed by a two converging trend line pattern. This hence led to the formation of the pennant pattern.
Finally, the price broke below the trend line and continued to move south.
Coming to the entry, one can go short after the pullback up to the bottom trend line.
Stop-Loss
An ideal stop loss for such trades would be above the apex of the pennant pattern. Else, traders might as well place it at the high of the candle that was successful in breaking through the pattern.
Take-Profit
The recent support or pivot levels are the points where one must scale-out their positions. And based on the momentum of the downtrend, one can lower the take profit accordingly.
Conclusion
There are tons of candlestick patterns out there in the industry, and the pennant pattern is one such pattern that is extensively used by traders.
The pennant pattern considers a bunch of candlesticks rather than just a single candlestick, making it much powerful in nature. Moreover, the pattern is logic-driven as it indirectly considers other vital aspects of analysis.
The pennant pattern can be considered as a complete analysis package, as it can be applied without the requirement of other technical tools.
This makes the pennant a candlestick chart pattern worth a try for both short-term and long-term equity traders.


