MetaTrader 4 / 5 Smart Zones

KT Auto Support Resistance Levels Indicator for MT4 / MT5 See the levels
before price
gets there.

An MT4 / MT5 indicator that finds support and resistance on every timeframe for you, and keeps the strongest levels on your chart automatically.

Used by professional traders worldwide · One-time purchase

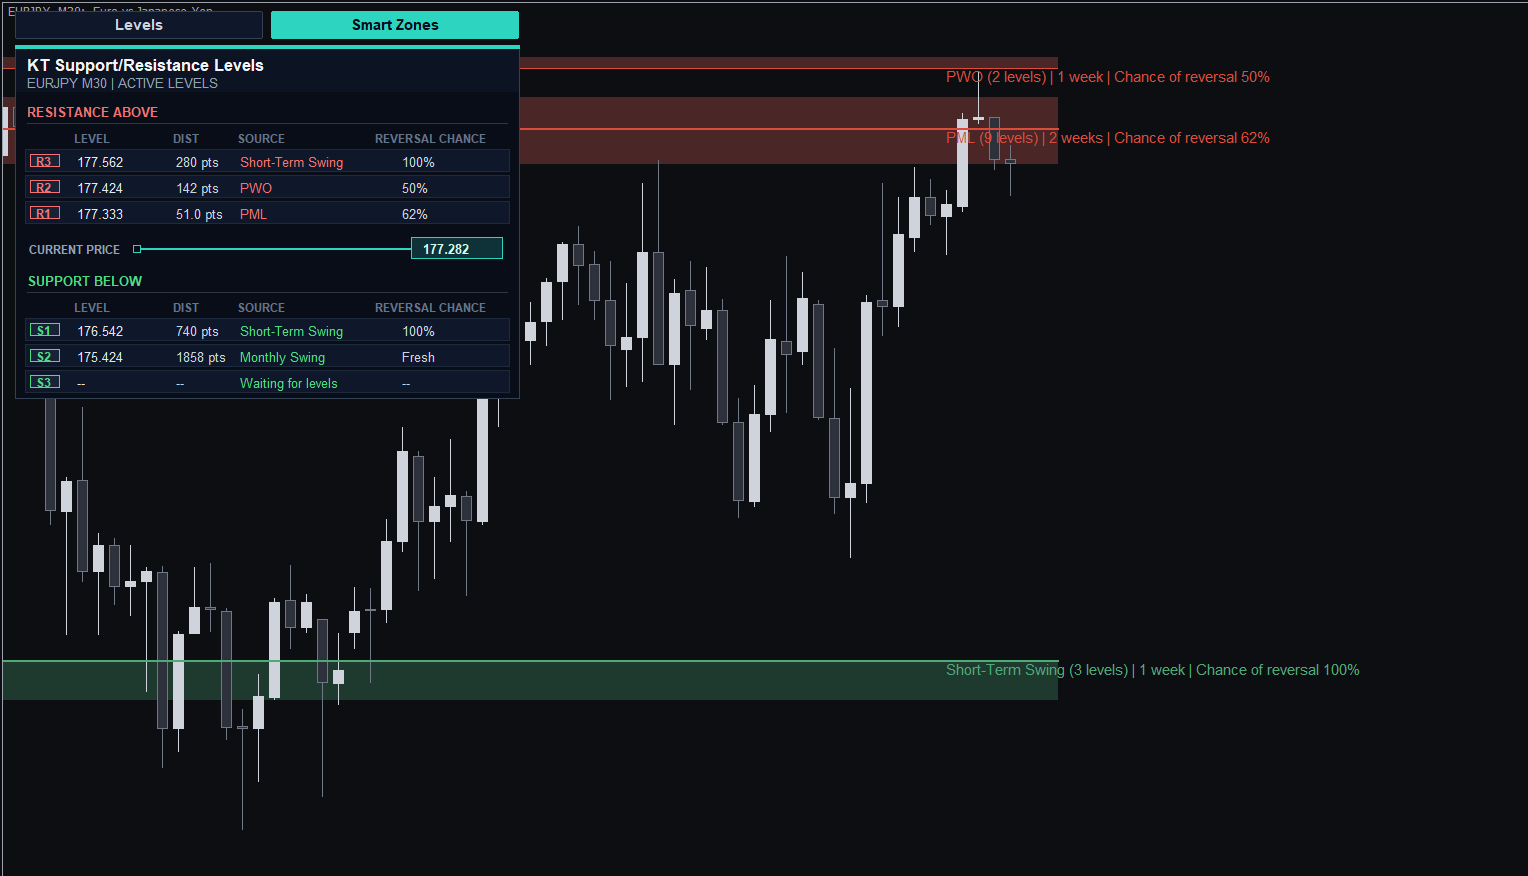
KT Auto Support Resistance Levels Indicator on EURJPY M30: Smart Zones and the live levels dashboard, price stopped at resistance
01
Every level, found for you
Stop drawing levels by hand. Swing levels, pivots, the previous day, week and month prices, and order blocks appear on your chart the moment you load it.
02
A calmer chart in one click
When the chart gets busy, Smart Zones merge the crowded levels into a few clean, ranked zones. The clutter falls away.
03
Never hunt for a level again
A live dashboard keeps the nearest support and resistance levels in a corner of your chart, and shows how often price has turned at each one.
I.
1-minute video

See it work on a real MetaTrader chart.

Watch the indicator find the levels on a real chart, switch to Smart Zones, and show the nearest levels in the dashboard.

Product Intro MT4 / MT5

One minute, the whole indicator.

II.
Four kinds of levels

Four ways the market remembers a price.

No single method finds every important price. The indicator draws four kinds of levels and labels each one with where it came from, so you always know what you are looking at.

No. 01

Confirmed swing highs and lows.

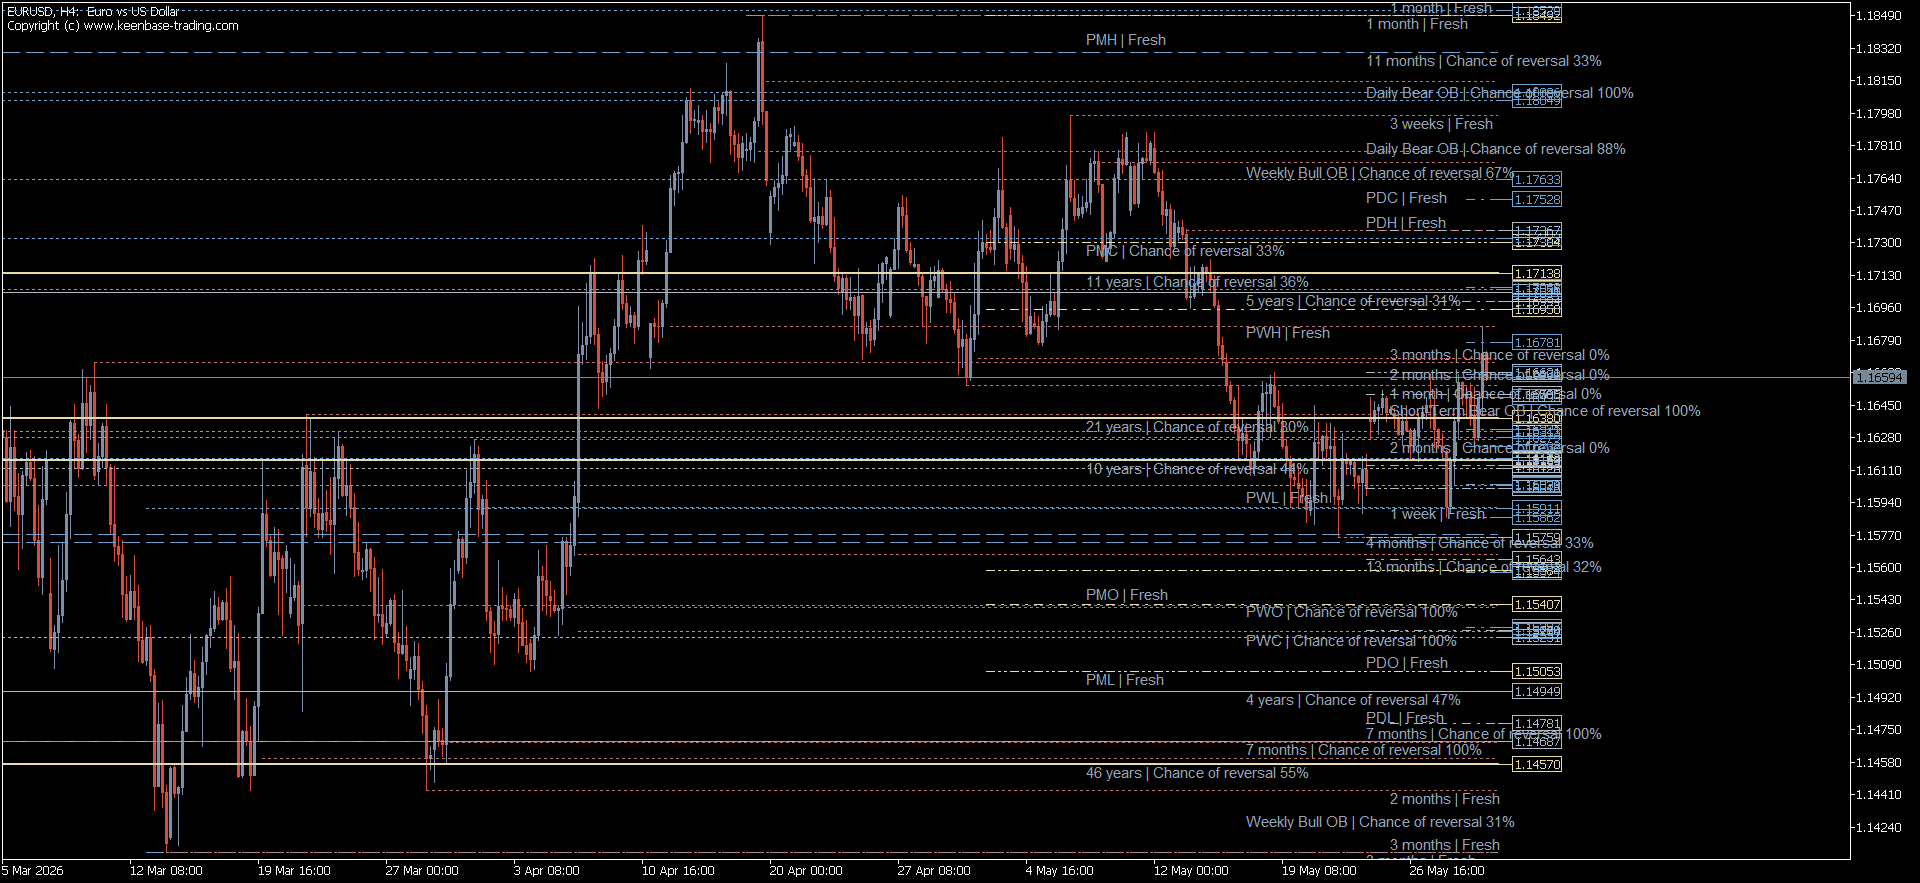
The real turning points of the market on the monthly, weekly and daily charts and on the chart you are on, drawn only after the swing is confirmed. Monthly levels show on every timeframe. Smaller swings hide on bigger charts so the view stays clean.
No. 02

Pivot points, with five methods to choose from.

Daily, weekly and monthly pivot levels, calculated from completed candles. Pick the method that fits your trading: Classic, Camarilla, Woodie, Fibonacci or DeMark.

No. 03

Previous H · L · O · C, by the day, week, and month.

Yesterday’s, last week’s and last month’s open, high, low and close, prices that many traders watch every day. Each one carries its short name on the chart: PDH, PWL, PMC.

No. 04

Order block midpoint levels.

When a strong candle breaks the market structure, the last candle of the opposite colour before it is the order block. The indicator draws one clean line at the middle of that candle’s body, not a shaded box, on the monthly, weekly, daily and chart timeframes. Labels read Daily Bull OB or Weekly Bear OB.

III.
Smart Zones

Smart Zones turn a crowded chart into a calm one.

Smart Zones gather the levels from all four sources and merge the ones that sit close together into one shaded zone. Each zone is ranked by its strength, and its label tells you everything in one line.

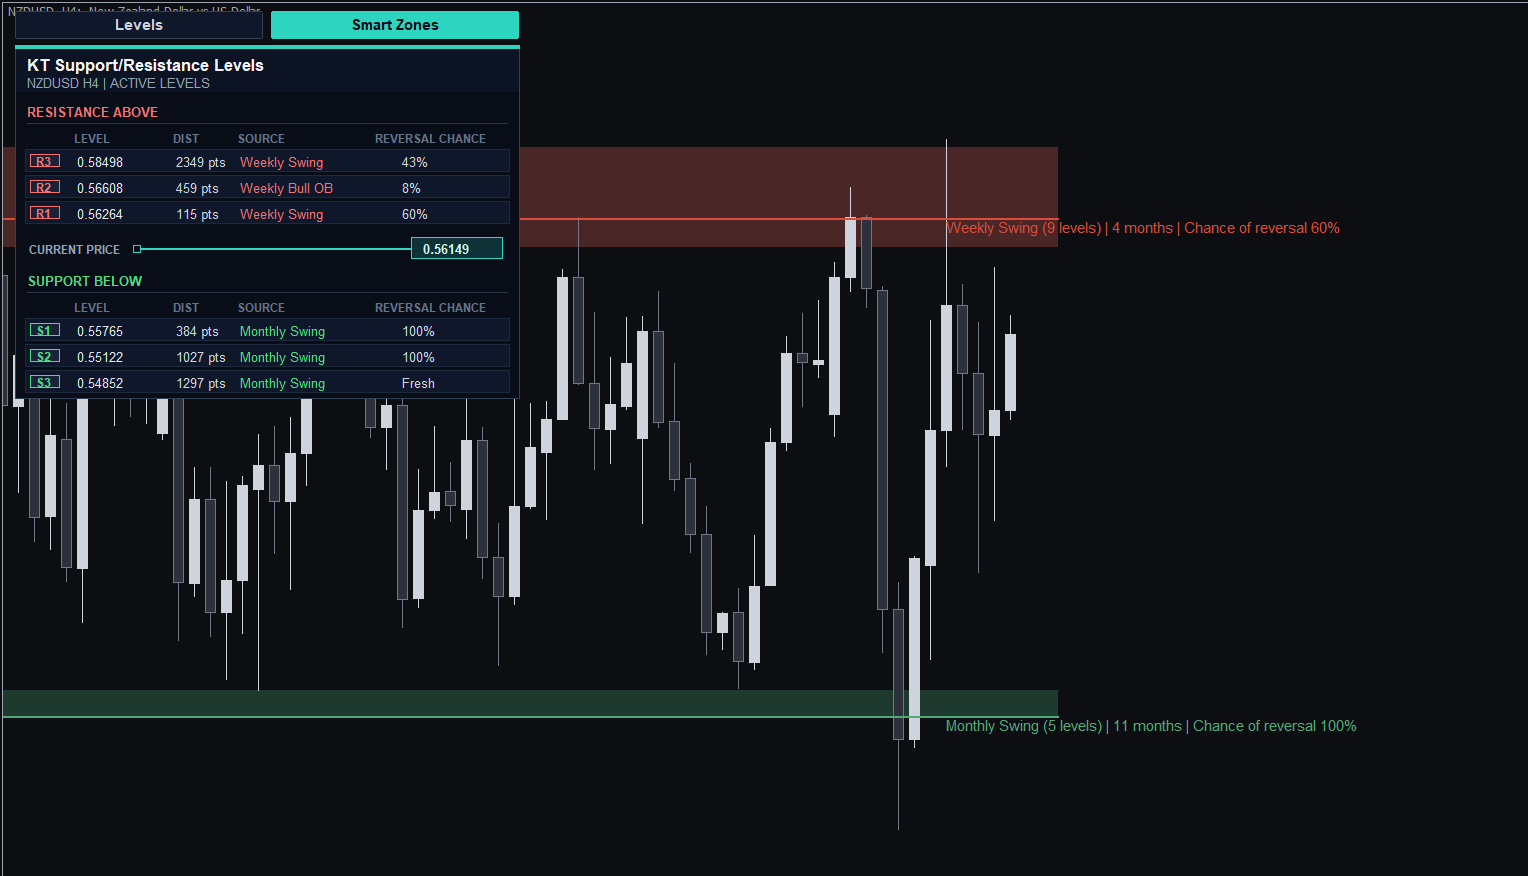
Smart Zones · NZDUSD H4, real chart
KT Auto Support Resistance Levels Indicator Smart Zones on NZDUSD H4: price turns at the Weekly Swing resistance and the Monthly Swing support

Why zones instead of lines.

When several levels sit very close together, price treats them as one level. Smart Zones show them as one zone, ranked by timeframe, source, how price reacted there before, and its reversal chance.

  • i Gathers every visible level: swings, pivots, previous prices, order blocks.
  • ii Merges nearby levels into a single clean zone.
  • iii Weights each cluster by strength, age, and reversal history.
  • iv Draws only the strongest zones, up to the number you set.
  • v Stays in place as new candles form, so the zones do not jump around.

Weekly R1  (4 levels)  |  11 months  |  Chance of reversal 80%

One Smart Zone label. Everything you need, on one line.

IV.
The dashboard

A live read of the nearest levels, always.

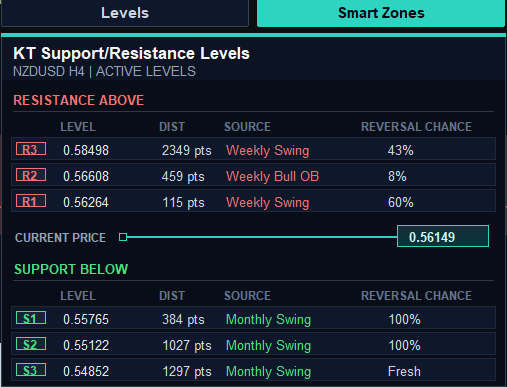
A dark dashboard in a corner of your chart answers one question: where are the levels around price right now? Three above, three below, and the current price in the middle.

KT Auto Support Resistance Levels Indicator levels dashboard: three resistance and three support levels with distance, source and reversal chance

One look, then decide.

R1 is the nearest resistance, sitting closest to the price marker. S1 is the nearest support, sitting just below. Two more levels above and below them give you the corridor you are trading inside.

The panel mirrors your chart. In Levels view it lists individual lines. In Smart Zones view it lists zones. The two buttons at the top switch instantly, and your choice carries across every open chart in the terminal.

Level
The price of the level.
Distance
How many points price has to travel to reach it.
Source
Swing, pivot, H/L/O/C, or order block.
Reversal
How often price turned at this level before, or Fresh if price has not tested it yet.

The corner panel updates as price moves, always showing the three nearest levels above and below, with how far away each sits and how often it has held.

V.
Reviews

From people who have it on their charts.

What traders say after using the indicator on their own charts.

★★★★★
Very reliable and accurate indicator! Primarily the strong and super-strong S&R areas work very reliably. Great product!
Georg Reichert Verified trader review
★★★★★
The automated plotting of S/R levels is accurate. It helps me to control my entry and exit points better and avoid risky trades.
Richard Booth Verified trader review
★★★★★
Yes, we know that prices react at important levels. And this tool helps me to mark them in the right way.
Turboshort Verified trader review

Stop drawing the same levels every morning.

Load it once and the levels are already there, ranked, aged, and waiting. The half hour you used to spend drawing levels becomes time spent trading. Your chart does the marking, so you can do the thinking.

One-time purchase · Free updates for life · Choose MT4, MT5, or both
VI.
Reversal chance

How often has price actually respected this level?

The percentage on each label counts what price did at that level before: out of every visit, how many times price turned away instead of breaking through. It shows you at a glance which levels the market has respected the most.

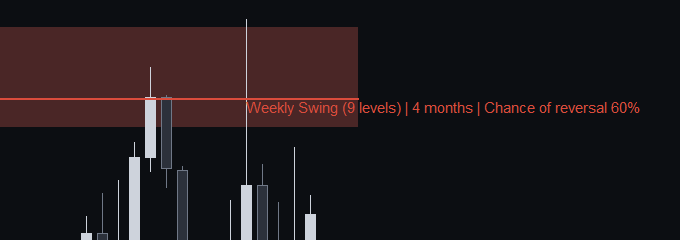
KT Auto Support Resistance Levels Indicator level label: source, number of levels, age and chance of reversal
One level label: the source, how many levels make the zone, the age of the level and its chance of reversal.

Touch

Price comes back and reaches the level. Only closed candles count, and one visit counts once, even if price touches the level several times.

Hold

Price reaches the level and turns away. Price must move clearly away from the level before the next visit can count.

Break

Price closes through the level. Retests from the other side do not count again until price has clearly moved away, so a broken level is never counted twice.

Fresh

A level that price has not tested yet in the history the indicator checked gets a Fresh tag. Fresh does not mean weak: an untested level can be one of the strongest on the chart, because no one has traded through it yet.

VII.
Alerts

Four ways to be told the moment a level is hit.

Get an alert when price reaches a level or a Smart Zone, so you do not have to watch the chart all day. A short pause between alerts, 10 minutes by default and changeable in the settings, keeps them from repeating.

♪

Sound

A chime from your terminal.

Pop-up

An on-screen message inside MetaTrader.

@

Email

Straight to your inbox. One-time setup.

Push

To the MetaTrader mobile app.

VIII.
Screenshots

See the indicator on real MetaTrader charts.

Real MetaTrader charts with Smart Zones and the live dashboard. Click any chart to see it full size.

IX.
FAQ

Questions traders ask before they buy.

Does it work on both MT4 and MT5?
Yes. KT Auto Support Resistance Levels Indicator is available for MetaTrader 4 and MetaTrader 5 and works the same way on both. You attach it to your chart like any other indicator.
Will it repaint?
No. Levels are built from closed candles, and the indicator never redraws history to look better than it was. New levels appear as new swings form, because support and resistance move with the market. Higher timeframe levels stay especially stable.
Will it slow down my terminal?
No. It refreshes the levels only when something on the chart changes, not on every tick, so you can run it on several charts without slowing MetaTrader down.
What is the difference between Levels and Smart Zones?
Levels view shows every level from every source you have switched on. Smart Zones view merges nearby levels into zones and draws only the strongest ones. One click on the dashboard switches between them.
What does the reversal chance percentage really mean?
It shows how often price turned away at that level in the past instead of breaking through: the number of holds divided by the number of touches. The higher the number, the more the market has respected that level.
What does Fresh mean on a level?
Price has not come back to test that level yet in the history the indicator checked. Fresh is not a warning: an untested level can be one of the strongest on your chart.
Why do some levels disappear when I switch to a higher timeframe?
This is on purpose. Daily levels hide on weekly and monthly charts, and weekly levels hide on monthly charts. Monthly levels show on every chart, so a higher timeframe chart shows only the levels that matter at that scale.
Is there a refund policy?
Every purchase has a 30-day exchange policy. We do not offer cash refunds, but if you have any problem with setup, activation or use, contact us and we will help you get the indicator working.
Do I get updates after I buy?
Yes, free for life. Every new version of the indicator is included at no extra cost and arrives automatically.
Ready to start?

Put the levels on your own chart.

Choose the MT4, MT5, or combined version, complete checkout on our website, and install it in your MetaTrader terminal.

One-time price: From $60 USD Get it now →

Risk disclosure. Trading foreign exchange, precious metals, indices, commodities, and other financial instruments carries substantial risk and may not be suitable for all investors. You can lose all, or more than, the capital you deposit. Leverage amplifies both gains and losses. KT Auto Support Resistance Levels Indicator is a MetaTrader 4/5 analysis indicator that automatically detects and draws support and resistance levels, Smart Zones, and historical interaction statistics on your chart. It does not open, close, or manage trades, and it is not a trading signal service, investment adviser, or guarantee against losses. Support and resistance levels can fail, and historical reactions do not guarantee future reactions. Past performance is not a reliable indicator of future results. Historical analysis, statistics, and logs are based on data available at the time they are computed, and no historical result guarantees future performance. Reversal-chance figures and level statistics describe past price behaviour only and are not predictions. Final responsibility for all trading decisions, including entries, exits, lot sizing, risk management, broker selection, prop firm compliance, and overall account safety, rests solely with you. Always test any new indicator on a demo account before relying on it for live trading decisions. By using this software, you acknowledge that you understand these risks and accept full responsibility for the outcomes of your trading.

>