Features
- Supply and demand zones displayed as price rectangles.
- Current, second and third timeframe layers on one chart.
- Default higher-timeframe selections of H4 and D1.
- Separate controls for showing supply and demand zones.
- Optional midpoint lines and timeframe labels.
- Adjustable zone colors, line styles and widths.
- Boundary or midpoint alert mode.
- Popup, email, push-notification and sound alert channels.
- MT4 and MT5 versions.
How the Indicator Finds Supply and Demand Zones
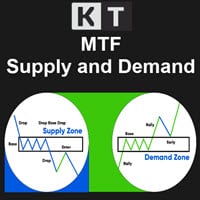
The indicator evaluates confirmed price swing points using its amplitude and confirmation settings. It then draws the resulting areas as rectangles. A supply zone marks a historical area associated with a confirmed swing high, while a demand zone marks an area associated with a confirmed swing low.
These zones are chart references, not forecasts. A marked area does not prove that price will reverse, and the indicator does not use trading volume, detect institutional orders or calculate its zones with a ZigZag indicator.
Multi-Timeframe Zone Display
Three independent display layers are available:
- Current Timeframe shows zones calculated from the open chart.
- Second Timeframe can add another timeframe, with H4 selected by default.
- Third Timeframe can add a further timeframe, with D1 selected by default.
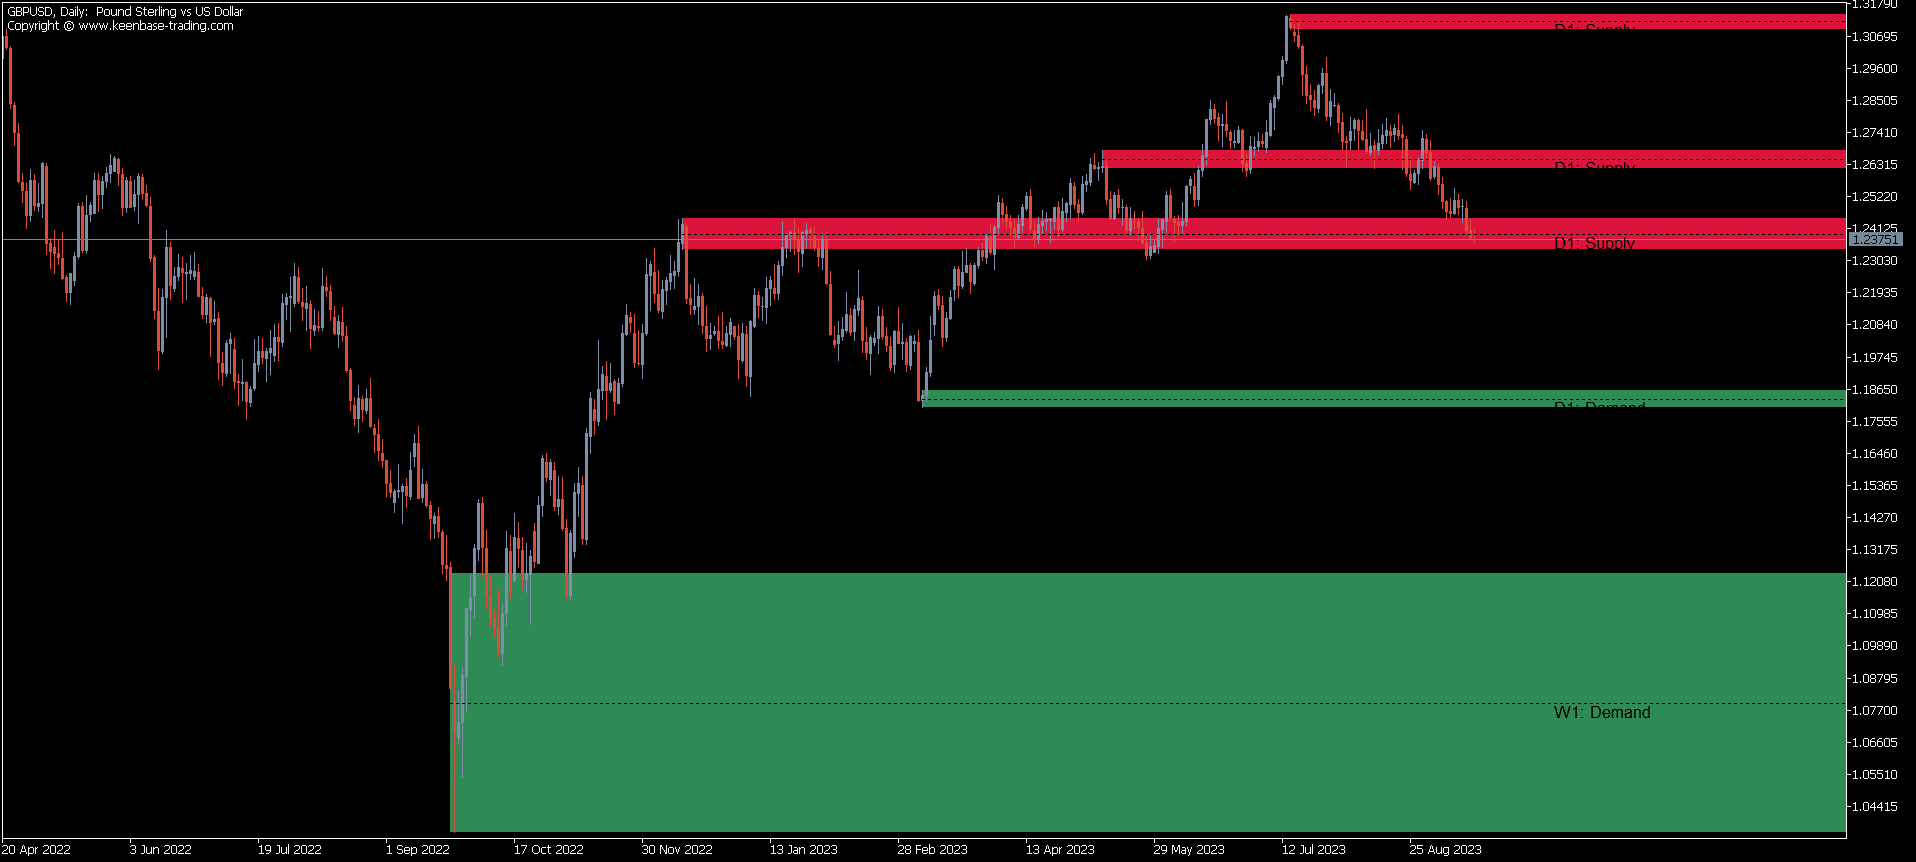
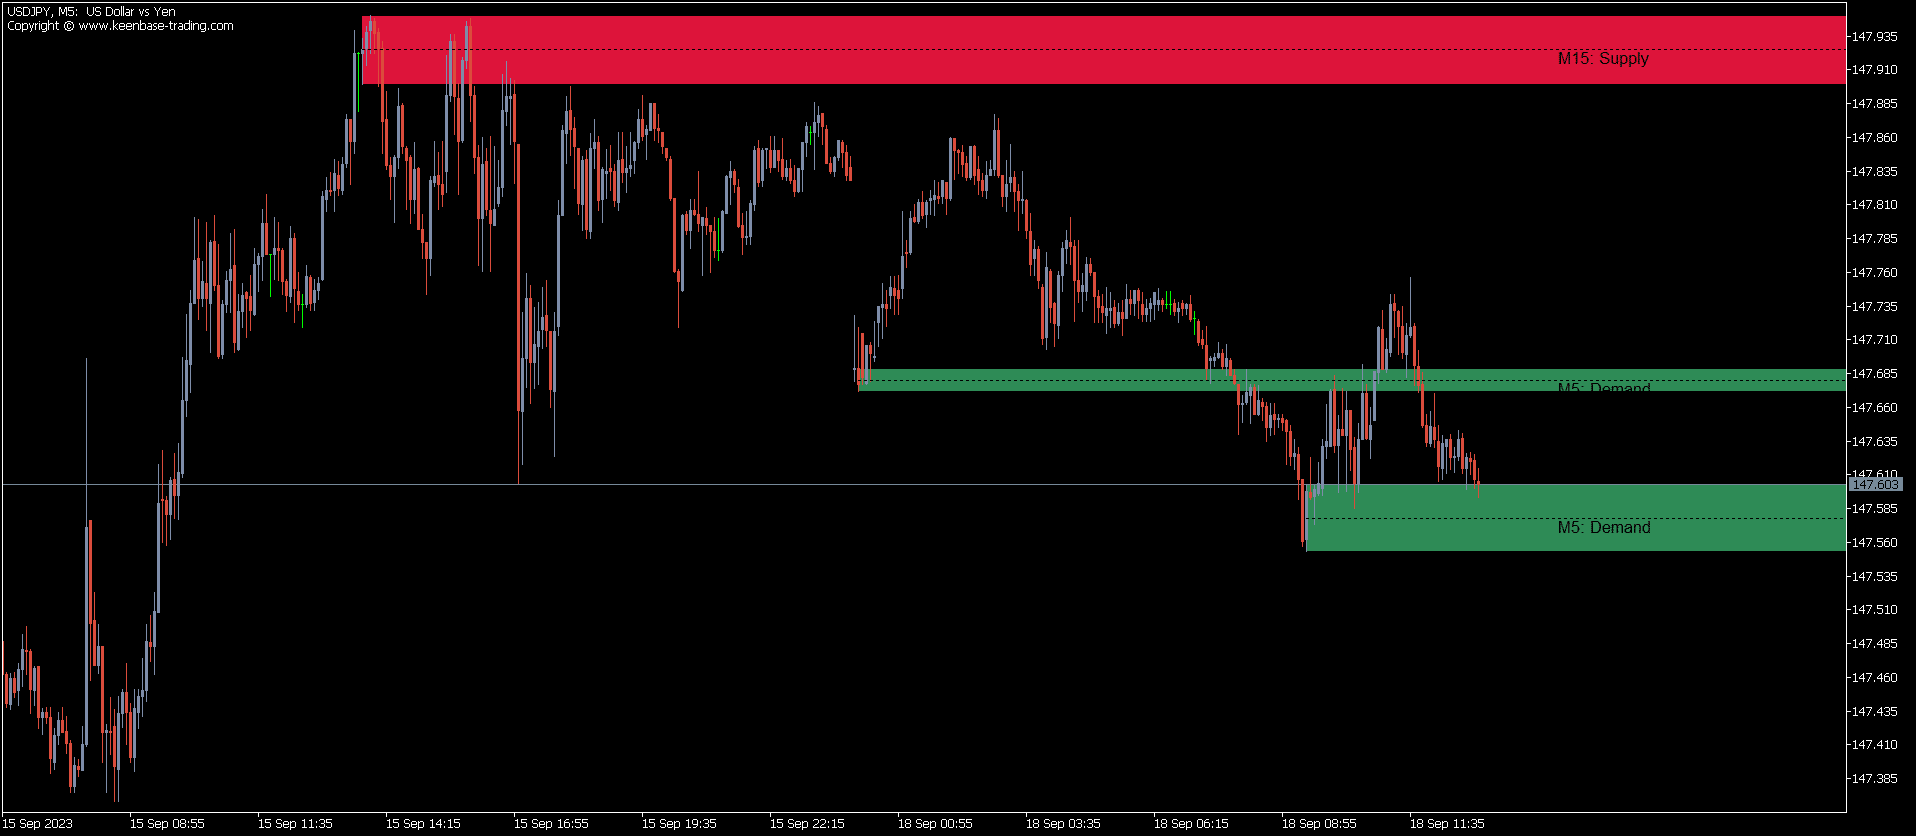
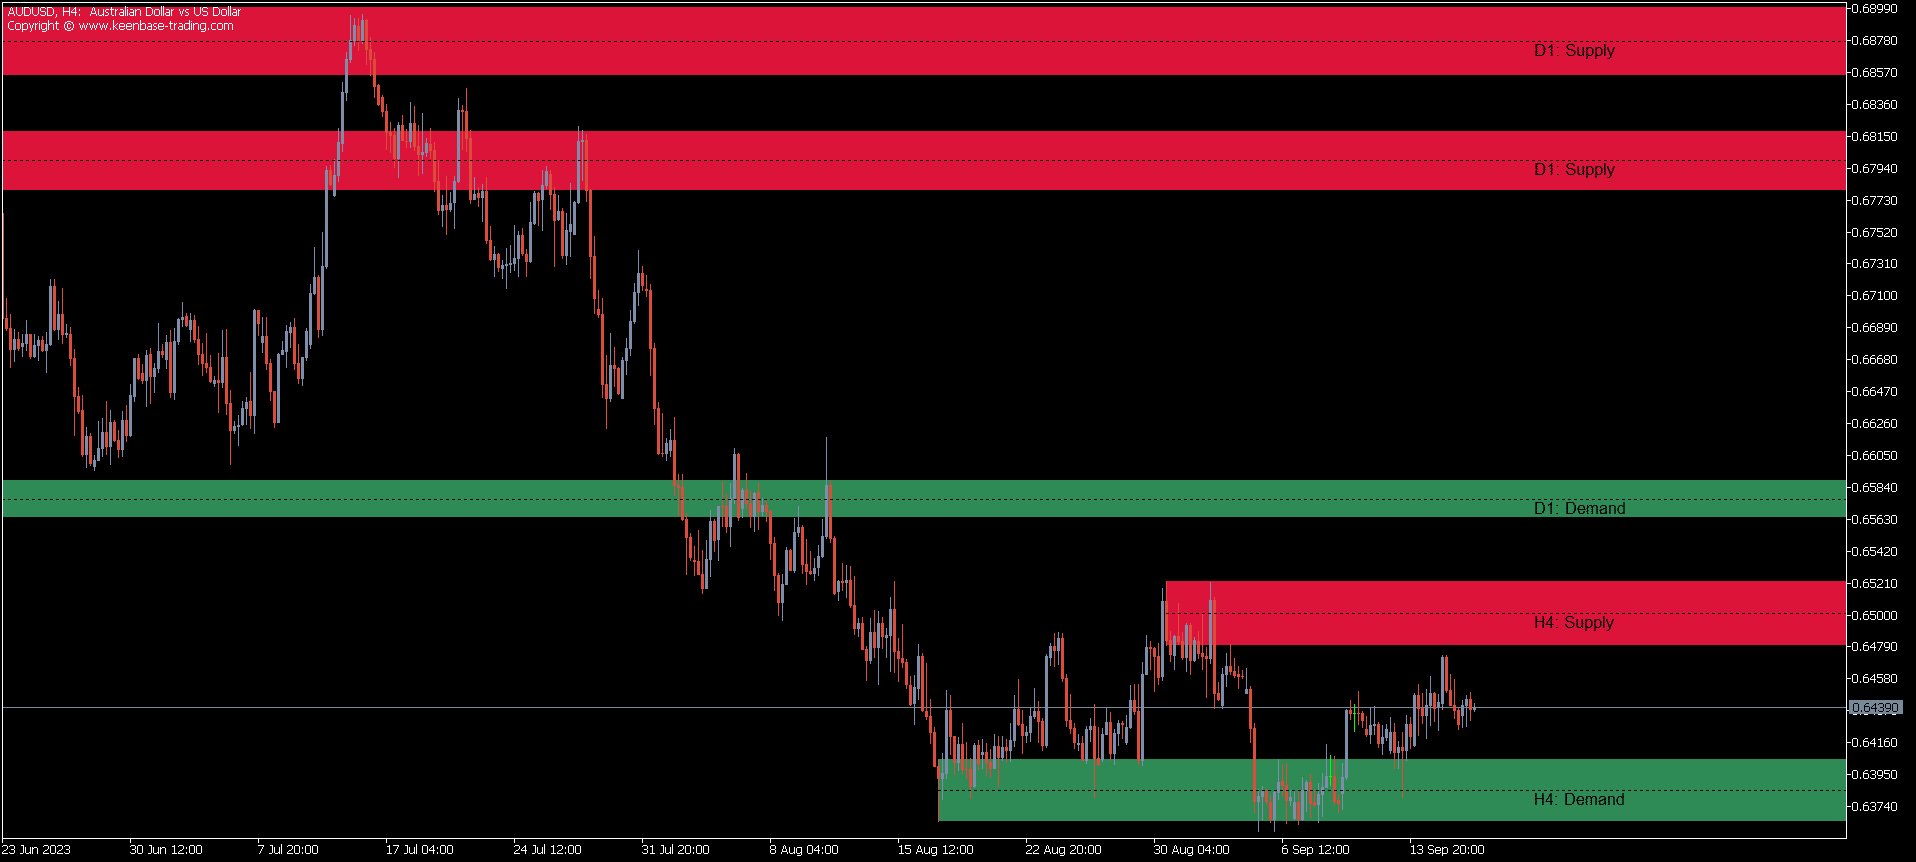
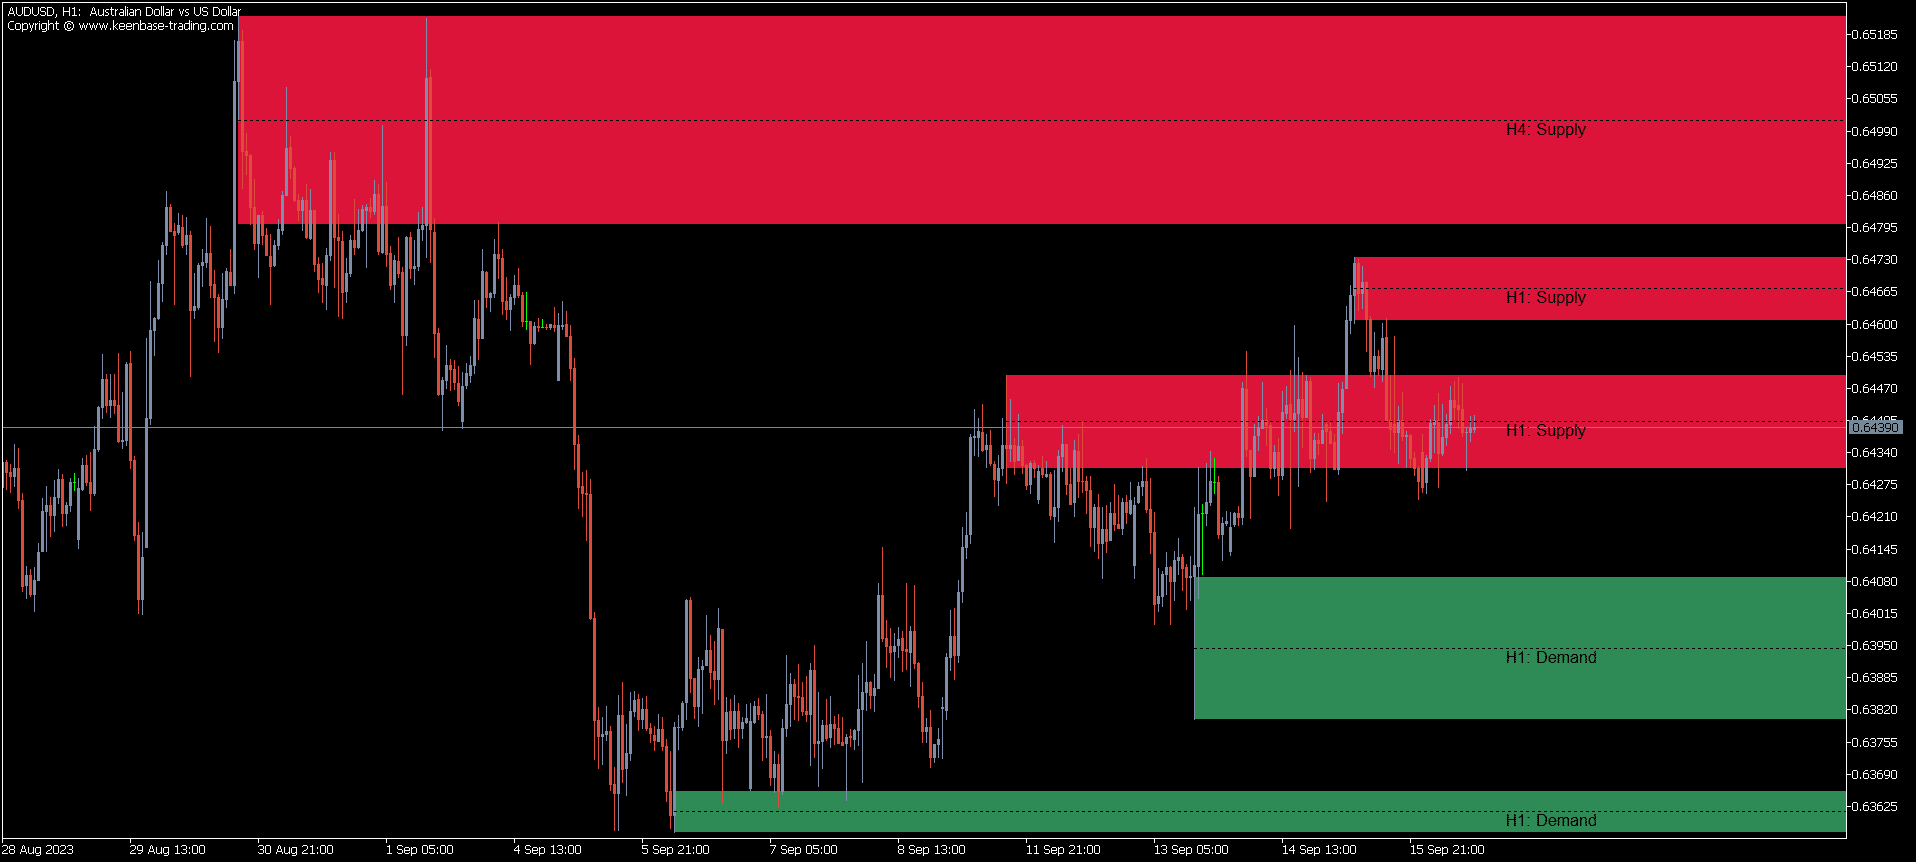
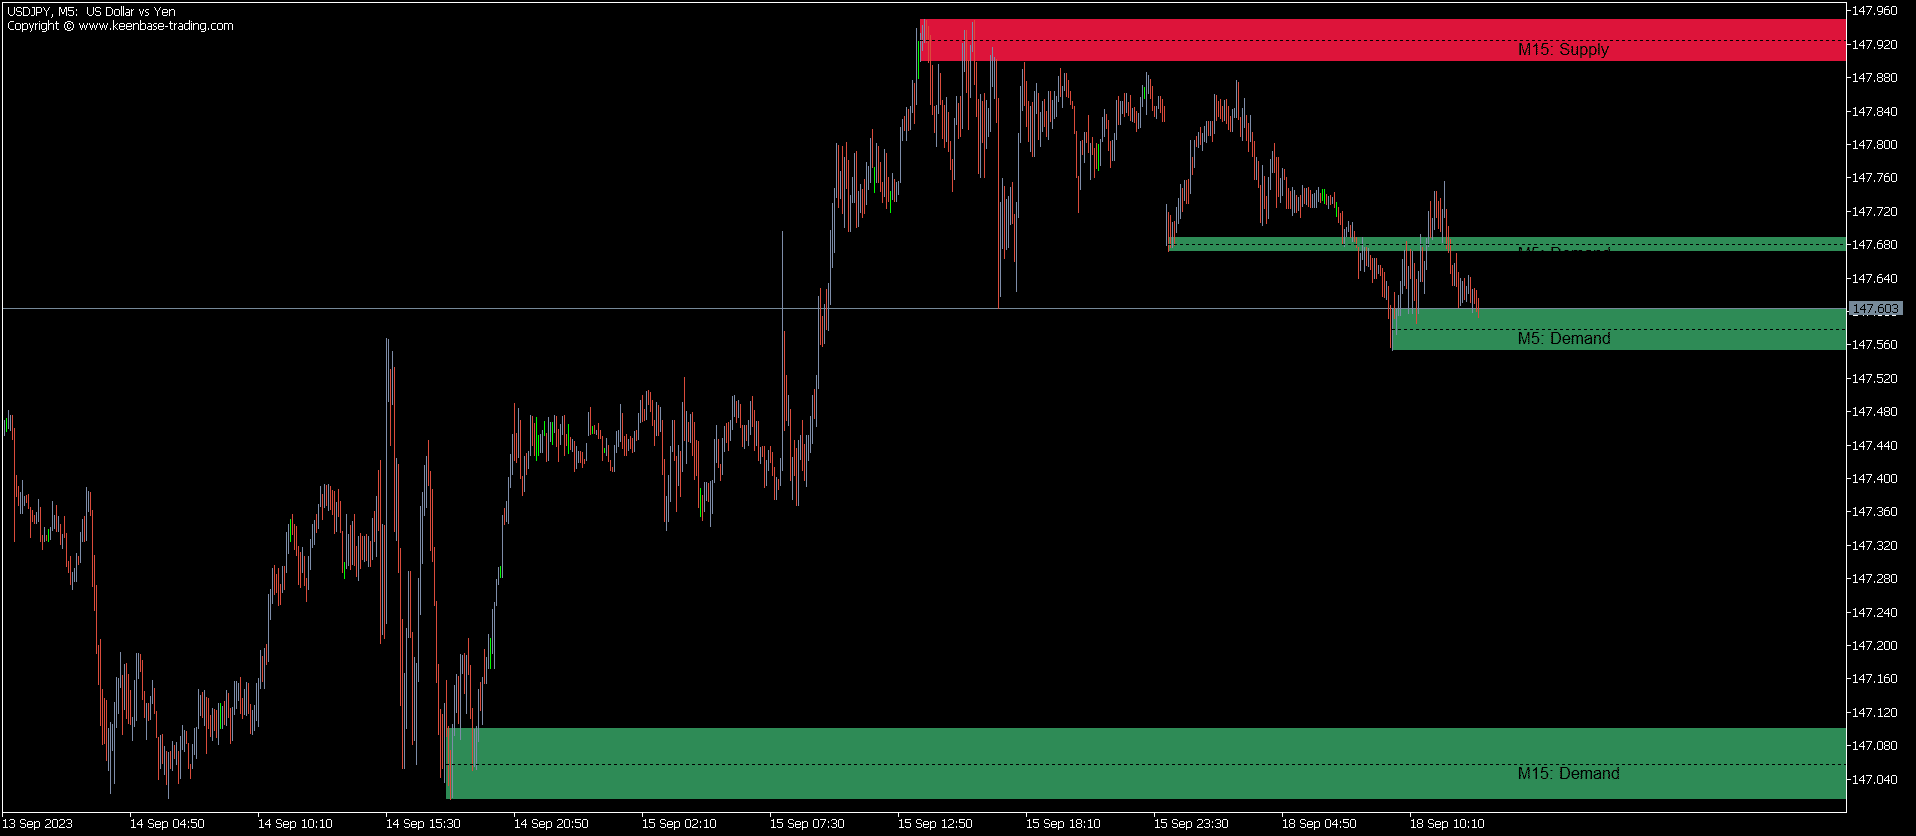
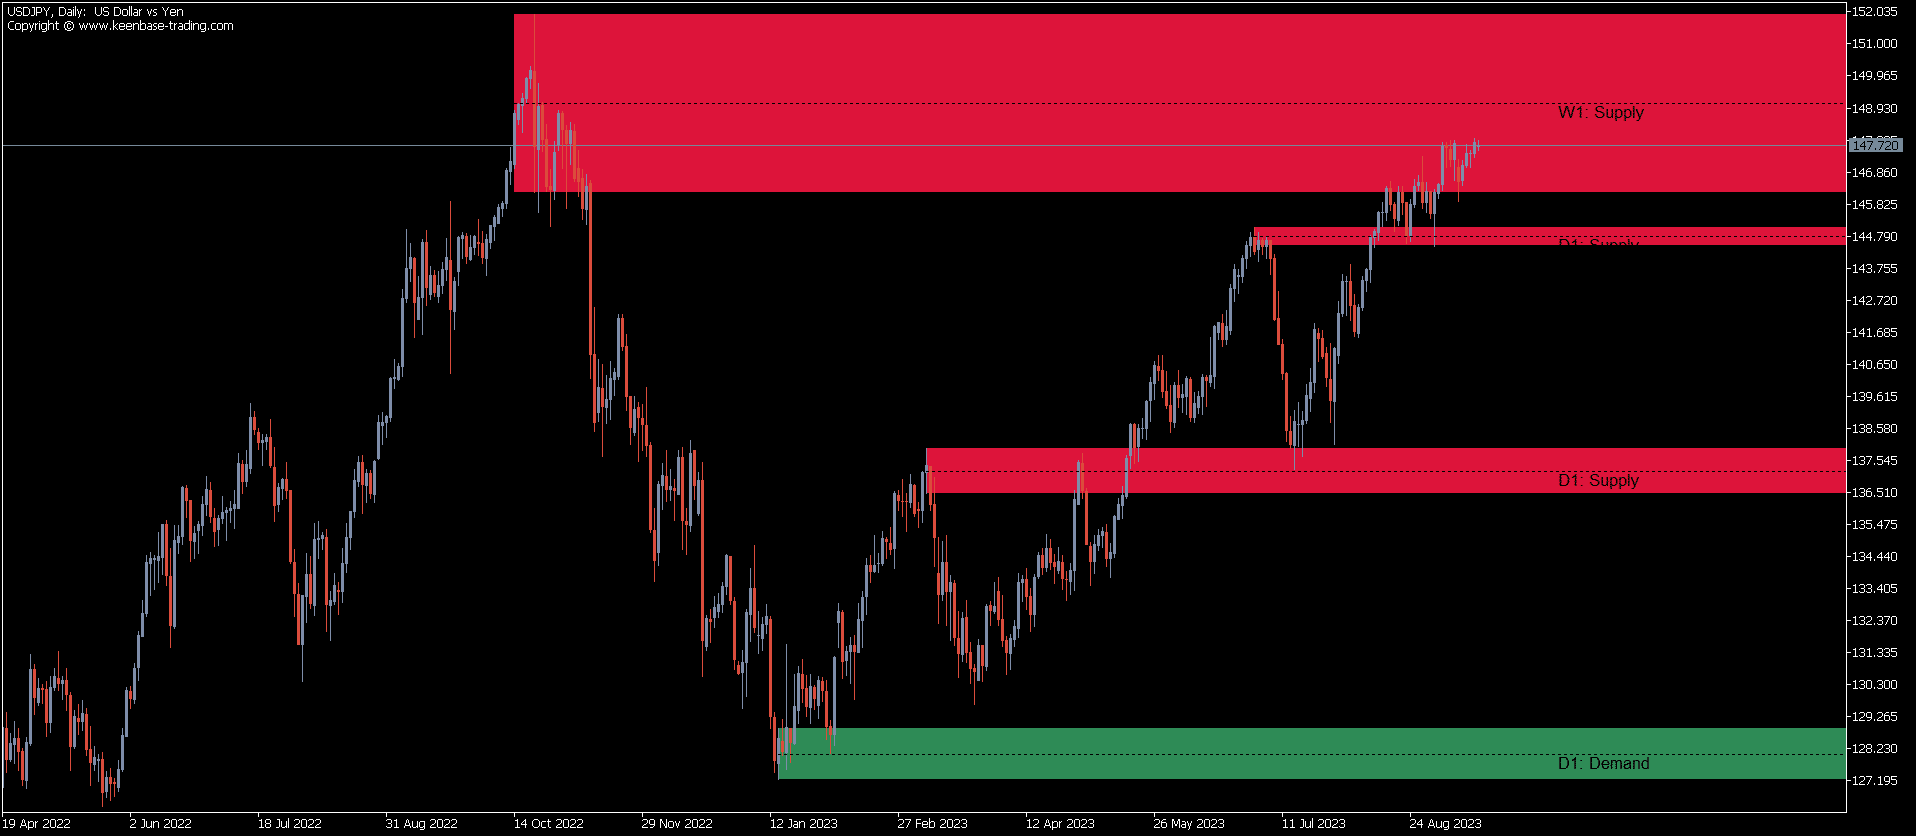
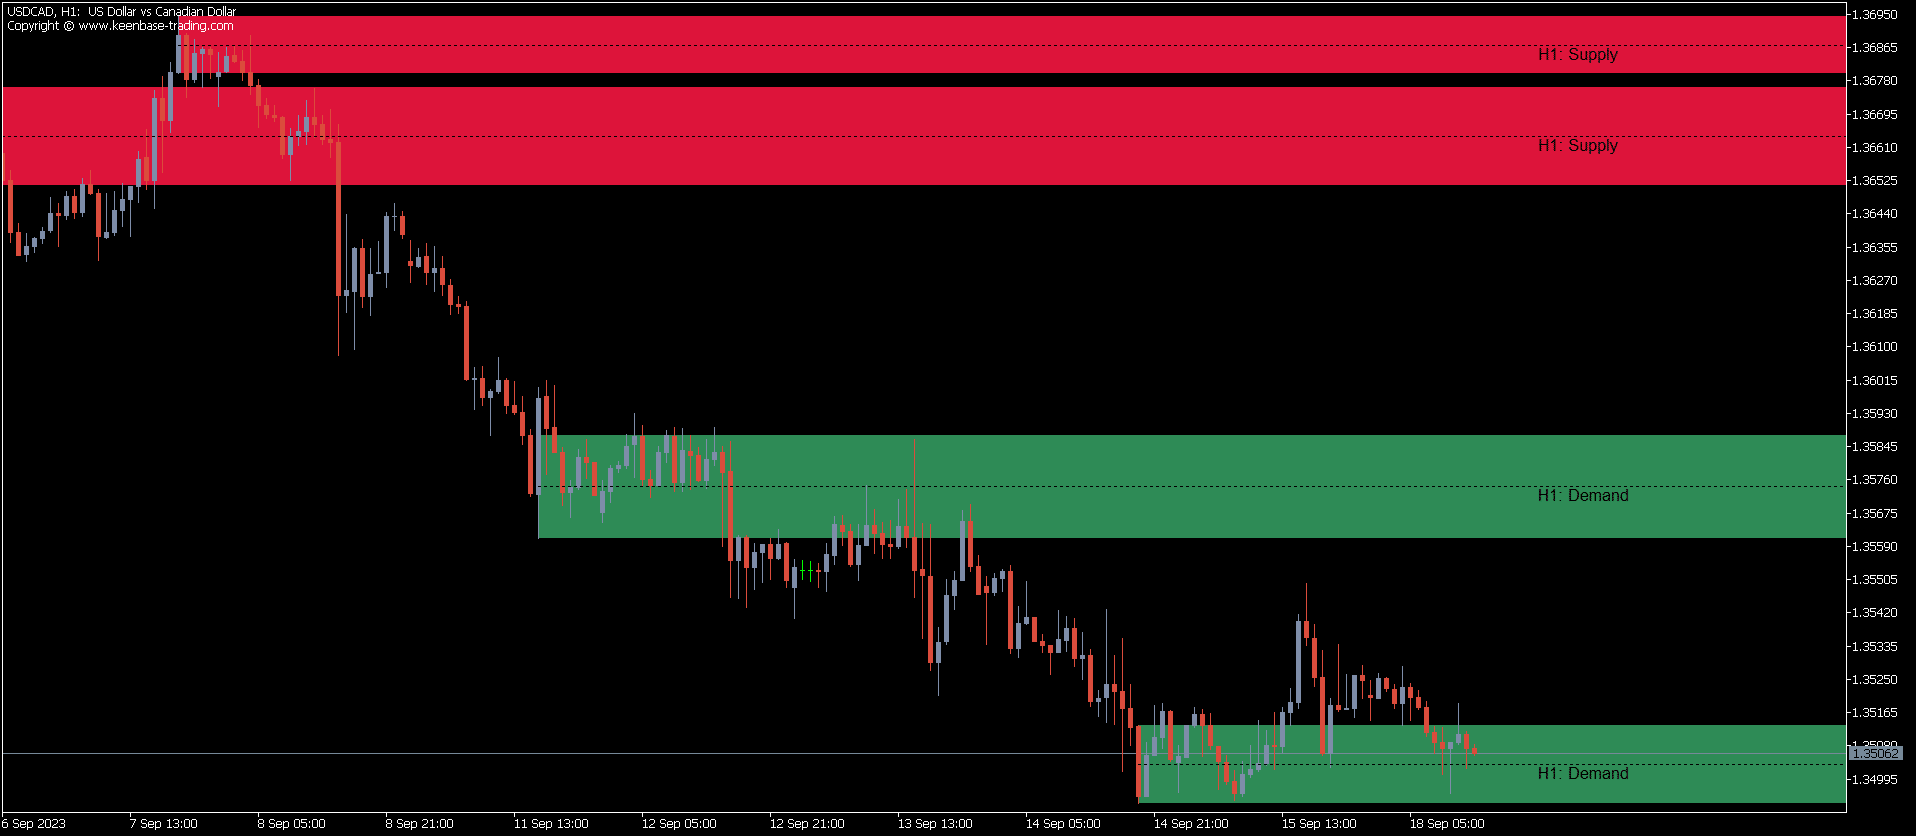
Each layer can be enabled or disabled. When multiple layers are active, use the timeframe labels to identify where a zone originated. Higher-timeframe zones provide broader context, but they do not automatically make a setup valid.
Indicator Inputs
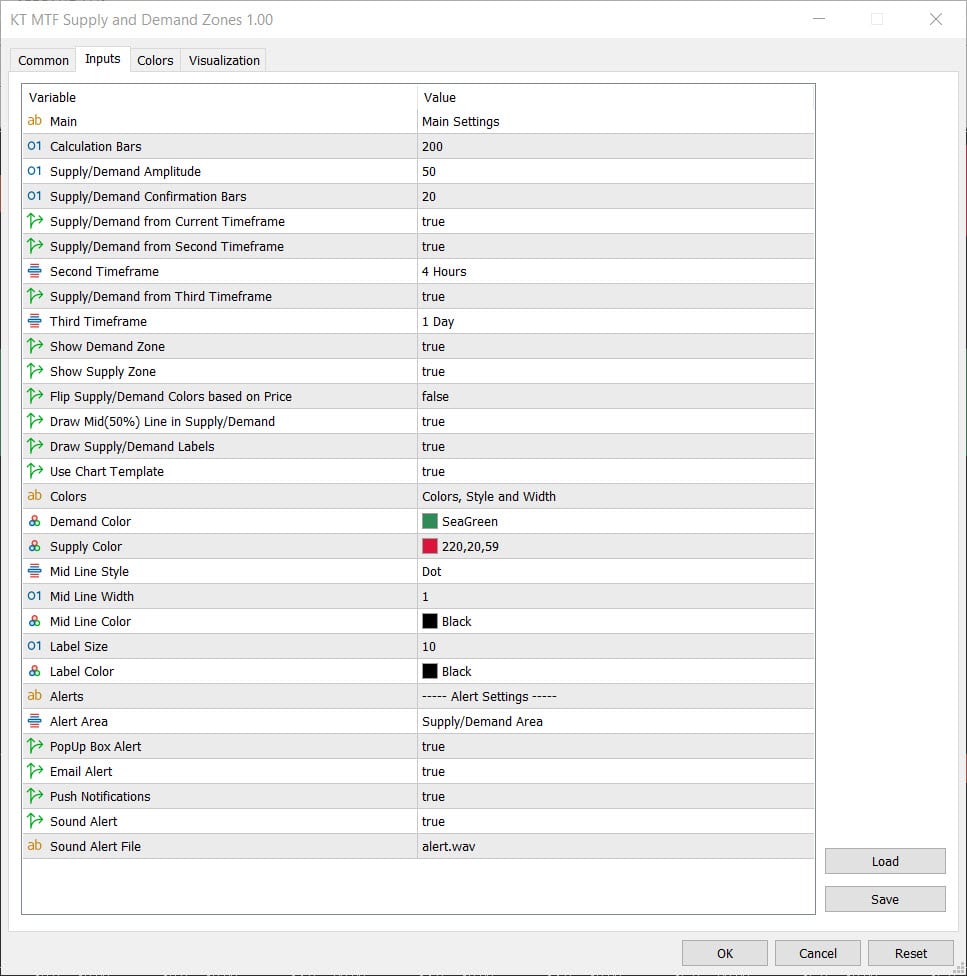
- Calculation Bars (200): limits how many historical bars are processed for zone calculation.
- Amplitude (50): controls the swing-detection range used by the zone logic.
- Confirmation (20): controls how much confirmation the swing logic requires.
- Current Timeframe: shows or hides zones from the open chart.
- Second Timeframe and Timeframe H4: enable the second layer and select its timeframe.
- Third Timeframe and Timeframe D1: enable the third layer and select its timeframe.
- Show Supply Zones and Show Demand Zones: control the two zone types independently.
- Flip Zone Colors: swaps the configured supply and demand color assignment.
- Show Midpoint: displays the optional 50% line inside each zone.
- Show Labels: displays the originating timeframe on the zone.
- Zone Colors, Line Style and Width: control how rectangles and midpoint lines appear.
- Apply Chart Template: applies the included chart appearance when enabled. Its default is enabled in MT5 and disabled in MT4.
- Alert Area: chooses whether alerts use the zone boundary or midpoint.
- Popup, Email, Push and Sound Alerts: enable or disable each supported alert channel.
Increasing the amplitude or confirmation values changes which swings qualify and can reduce the number of zones. Lower values can make the indicator more responsive but may add more chart areas. Test changes on the symbols and timeframes you trade instead of assuming one setting fits every market.
How to Read Supply and Demand Zones
A demand rectangle identifies a prior area formed around a confirmed swing low. A supply rectangle identifies a prior area formed around a confirmed swing high. When price returns to a zone, observe what price does there rather than treating the first touch as an automatic entry.
Useful independent checks can include the prevailing trend, the structure of completed candles, nearby support or resistance, room to the next opposing zone and a predefined invalidation level. A clean break through a zone can invalidate the original reaction idea or turn that area into context for a different setup.
Using Boundary and Midpoint Alerts
Choose Boundary when you want notification as price reaches the relevant edge of a zone. Choose Midpoint when you want the alert tied to the zone's 50% line. The popup, email, push and sound settings control how the notification is delivered.
An alert reports that price has reached the selected part of a historical zone. It is not a buy or sell instruction. Review the completed price action and your risk plan before making a trading decision.
Practical Workflow
- Attach the MT4 or MT5 indicator and confirm the current chart symbol and timeframe.
- Decide whether the current, second and third timeframe zones are all useful for the chart.
- Keep the default H4 and D1 layers or select timeframes that match your trading horizon.
- Use labels and midpoint lines when they make overlapping zones easier to interpret.
- Wait for price to reach a relevant zone, then assess trend, completed candles and available room to the next opposing area.
- Define entry, invalidation and risk before acting.
- Test the full setup on historical charts and a demo account before using live capital.
Configuration and Validation
Start with Calculation Bars 200, Amplitude 50 and Confirmation 20 so you can observe the indicator's intended baseline. Change one setting at a time and compare the result across enough historical examples. More zones are not automatically better, and fewer zones are not automatically more accurate.
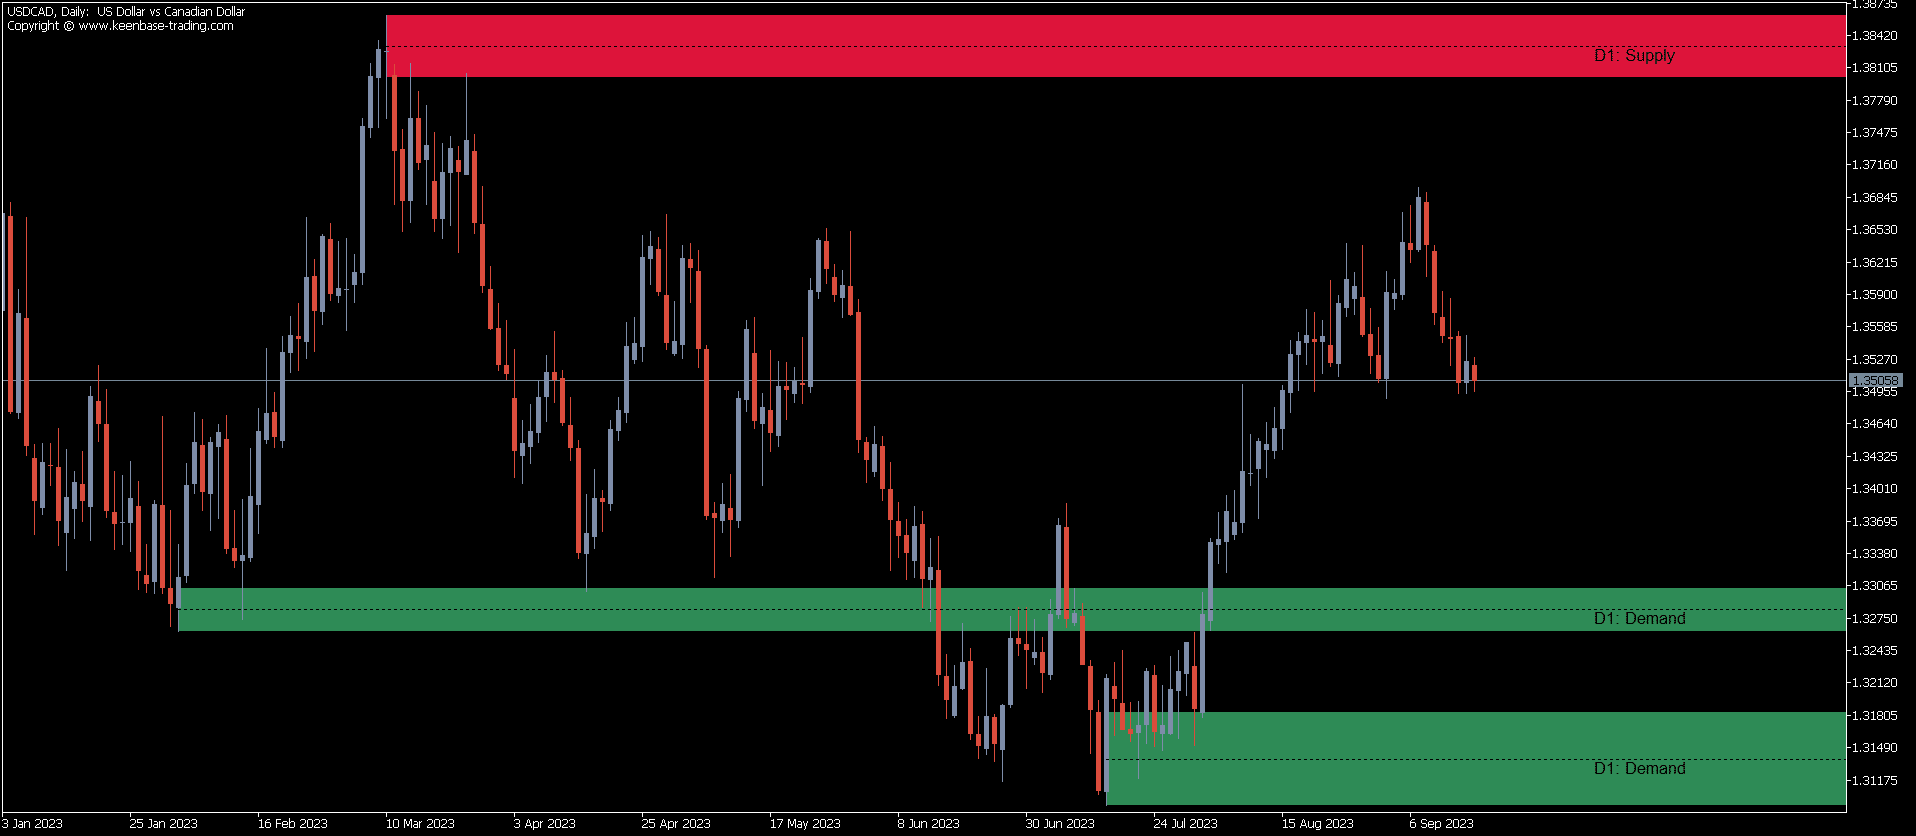
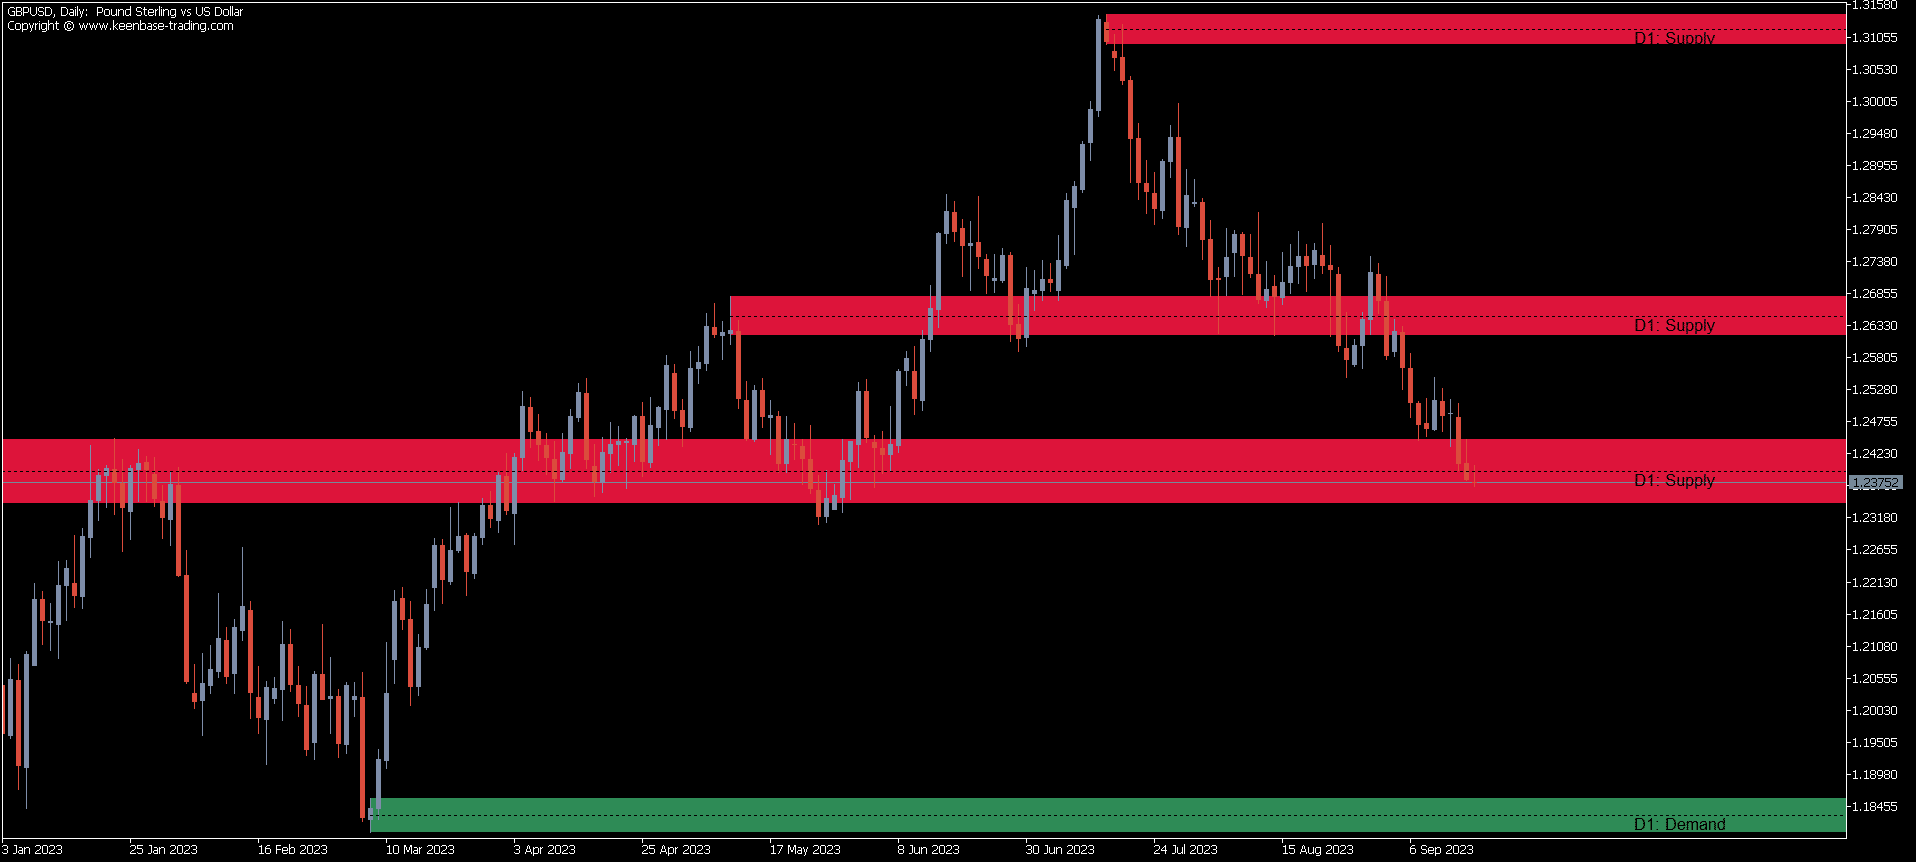
The screenshots on this page are historical illustrations of how the indicator displays zones. They do not represent guaranteed future reactions or expected trading performance. For more background on the concept, see understanding supply and demand zones.
Limitations
The indicator works from price-derived swing information. It does not measure exchange-wide forex volume, identify hidden institutional orders, predict reversals or guarantee that a zone will hold. Zones can be broken, market conditions can change and trading losses remain possible.
Use the indicator as one part of a tested process. Independent validation, position sizing and risk controls remain the trader's responsibility.
Frequently Asked Questions
Does the indicator work on MT4 and MT5?
Yes. Separate MT4 and MT5 versions are available, as well as an MT4 + MT5 option.
How many timeframes can it show at once?
It can display zones from the current chart timeframe plus a second and third timeframe. H4 and D1 are the default higher-timeframe selections.
What do Amplitude and Confirmation change?
They affect how the swing logic qualifies the points used to create zones. Higher values generally make the selection more restrictive, while lower values can produce more responsive and more frequent zone markings.
Does it use volume or ZigZag to find zones?
No. The verified MT4 and MT5 builds derive zones from confirmed price swing or fractal logic. Trading volume and ZigZag are not part of the zone calculation.
Does a zone predict a reversal?
No. A zone records a historical price area. Price may react, pause or break through it, so every setup needs independent confirmation and risk management.
Can it alert me when price reaches a zone?
Yes. Alerts can use the zone boundary or midpoint and can be delivered through popup, email, push notification and sound, depending on your settings and platform configuration.










 Great Indicator