How the Indicator Confirms Swing Points
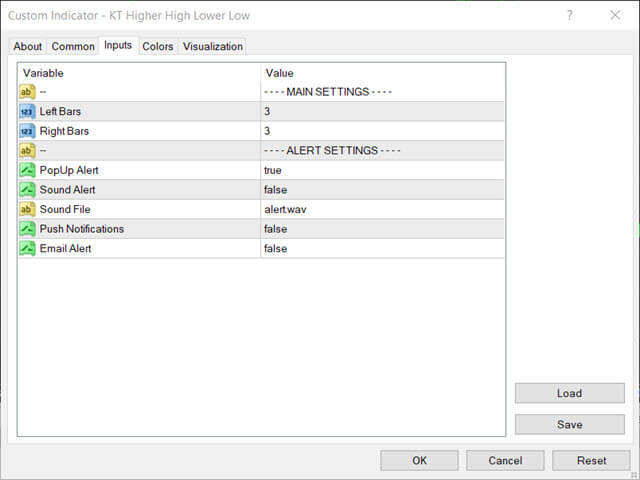
A candidate pivot must be the highest high or lowest low across the configured left-and-right window. With the default Left Bars set to 3 and Right Bars set to 3, confirmation requires three completed bars on each side of the candidate swing.
Increasing either value filters out smaller swings but produces fewer labels. Increasing Right Bars also delays confirmation because more bars must close before the swing can be accepted.
What HH, HL, LH and LL Mean
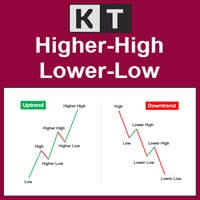
- HH: The new confirmed swing high is above the previous confirmed swing high.
- HL: The new confirmed swing low is above the previous confirmed swing low.
- LH: The new confirmed swing high is below the previous confirmed swing high.
- LL: The new confirmed swing low is below the previous confirmed swing low.
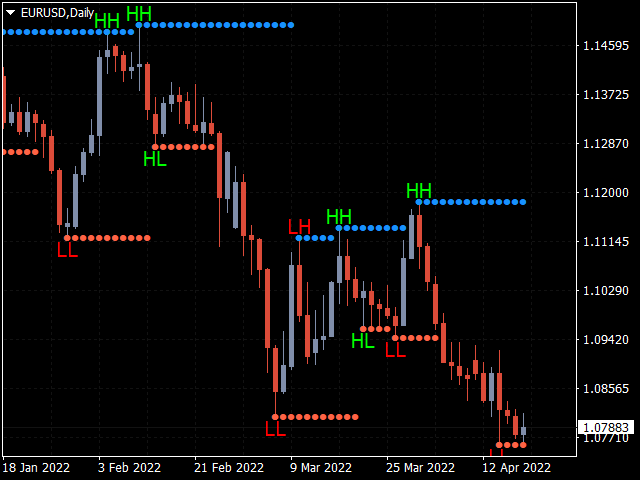
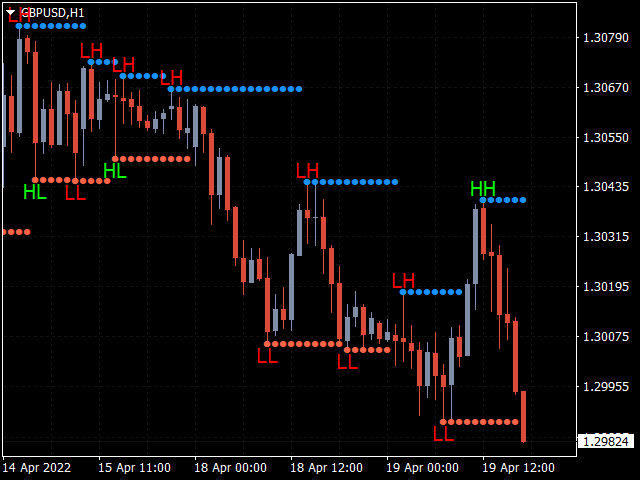
Lime labels identify HH and HL points, while red labels identify LH and LL points. Read the sequence across several swings instead of treating one label as a complete trend signal.
How Support and Resistance Levels Behave
Each confirmed swing high becomes a resistance level and each confirmed swing low becomes a support level. The indicator carries that level forward until price crosses it, then removes the broken level.
These levels can help organize a chart review alongside the support and resistance indicator, but they do not place trades, stop losses, or profit targets.
Main Settings
- Left Bars, default 3: Number of bars checked before a candidate swing.
- Right Bars, default 3: Number of bars that must appear after the candidate before confirmation.
- Lower values: More sensitive structure with more frequent swing labels.
- Higher values: Broader structure with fewer labels and a longer confirmation window.
Alerts
The indicator can alert when a new HH, HL, LH, or LL is confirmed and when price touches a carried support or resistance level.
- PopUp Alert: Enabled by default.
- Sound Alert: Disabled by default; Sound File selects the audio file.
- Email Alert: Disabled by default and requires MetaTrader email configuration.
- Push Notifications: Disabled by default and requires MetaQuotes ID configuration.
MT4 and MT5 Setup
- Place the supplied indicator file in the platform's Indicators folder.
- Restart MetaTrader or refresh the Indicators list in the Navigator.
- Drag the KT Higher High Lower Low Indicator onto the chart.
- Choose Left Bars and Right Bars for the structure scale you want to review.
- Enable only the alert channels you have configured and need.
Use the same process on MT4 and MT5. The chart symbol and timeframe determine which price series the indicator evaluates.
How to Interpret Trend and Pullbacks
A sequence of HH and HL labels can support a bullish-structure reading. A sequence of LH and LL labels can support a bearish-structure reading. Mixed labels usually indicate transition, consolidation, or a structure scale that needs adjustment.
For a trend-following test with a 100-period moving average, a bullish pullback hypothesis would look for price above the average and a confirmed higher low. A bearish hypothesis would look for price below the average and a confirmed lower high.
Those conditions are examples for testing, not automatic entries. Define the entry trigger, invalidation level, costs, and exit rules before comparing results.
Breakout and Counter-Trend Examples
A close above a carried swing-high resistance level can be tested as a bullish breakout condition. A close below a carried swing-low support level can be tested as a bearish breakout condition.
For a counter-trend hypothesis, a confirmed lower low near the lower Bollinger Bands area or a confirmed higher high near the upper area can identify a place to investigate. It does not show that price must return to a mean.
Validation and Limitations
- Swing labels require the configured Right Bars, so confirmation is delayed by design.
- The indicator identifies chart structure; it does not predict reversals or determine position size.
- Support and resistance lines are chart references, not automatic stop-loss or take-profit orders.
- Results change with the symbol, timeframe, market conditions, and Left Bars and Right Bars settings.
- Test fixed rules on historical data, include spread and other trading costs, and confirm behaviour on a demo account before live use.