

We hope you enjoy reading this blog post.
Become a Pro Trader by using our fine-tuned Indicators and Expert Advisors.
How to Use Waddah Attar Explosion Indicator Like a Pro
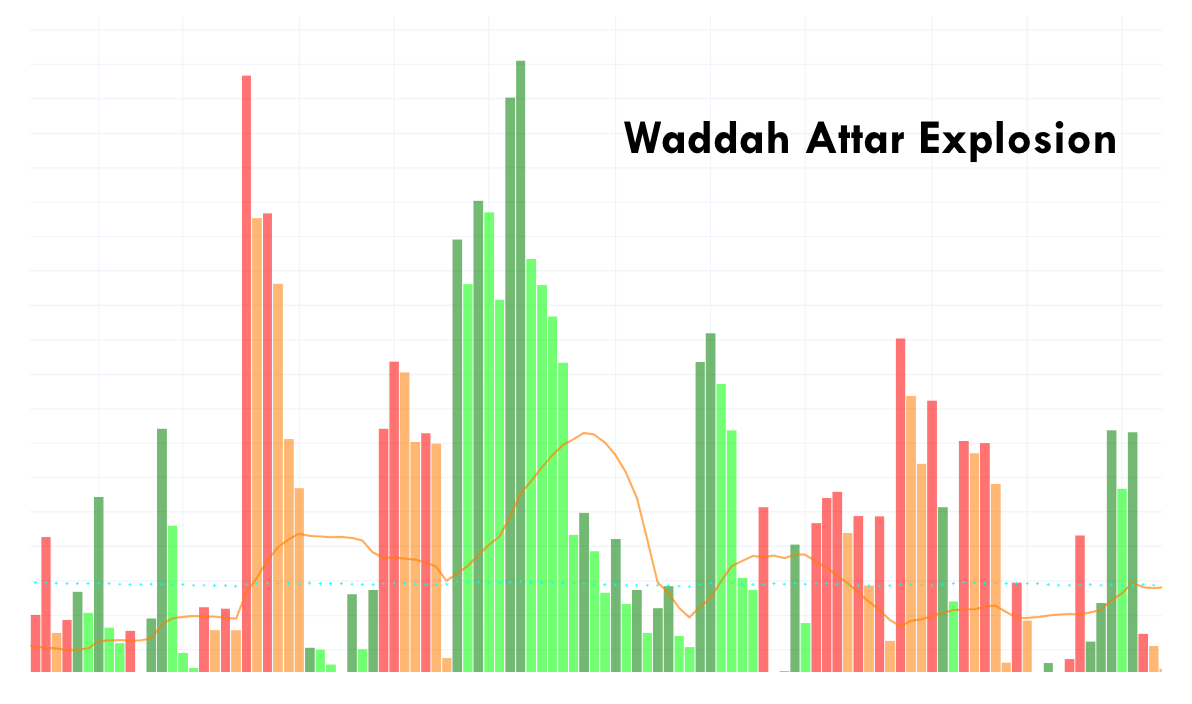
If you’re a Forex trader, the Waddah Attar Explosion Indicator helps you compare directional momentum with current price volatility.
It is not a trading-volume indicator. Its main calculations come from MACD-derived momentum and Bollinger Band width.
This guide explains what the histogram, Explosion line, and Dead Zone mean and how to read a possible setup.
Treat the signals as confirmation tools, not predictions, and check the rules used by your installed version.
What is the Waddah Attar Explosion Indicator
The Waddah Attar Explosion (WAE) indicator combines price-based momentum with volatility in one window. Unlike a dedicated volume indicator, it does not measure positive and negative trading volume.
Its histogram is derived from changes in a MACD calculation.
The Explosion line is derived from Bollinger Band width, so it expands when price volatility increases and contracts when volatility falls.
The Dead Zone filters weak movement before a possible setup is considered.
Its formula depends on the version: the installed KT build uses a configurable fixed threshold, while some later ports use a true-range-based threshold.
Check the inputs in your installed version before applying any rule. The indicator highlights conditions to investigate; it does not predict the next price move.
Exploring Different Colors of the Red or Green Histogram Indicator
The green and red columns show the direction of the MACD-derived momentum calculation, not traded volume.
Green columns represent positive momentum.
Red columns represent negative momentum.
A taller column means the calculated directional momentum has strengthened compared with the zero line. A shorter column means it has weakened.
Color alone is not an entry. Compare the histogram with the Explosion line and Dead Zone, then confirm the setup on the price chart.
How to Use Waddah Attar Explosion Indicator
Start by checking whether the relevant histogram is above both the Explosion line and the Dead Zone.
A stronger setup has an expanding histogram and an expanding Explosion line. If either remains inside the Dead Zone or begins contracting, momentum or volatility may be too weak for a new signal.
Confirm the direction with market structure, a breakout, or support and resistance on the price chart. Read the signal in the context of the active Forex markets, and match the exact colors and Dead Zone rule to your installed version.
Buy Example
The chart below is a historical EUR/USD buy example, not a forecast.
The green histogram moved above both the Explosion line and Dead Zone while momentum and volatility were expanding.
A bullish confirmation candle on the price chart provided additional context before the illustrated entry.
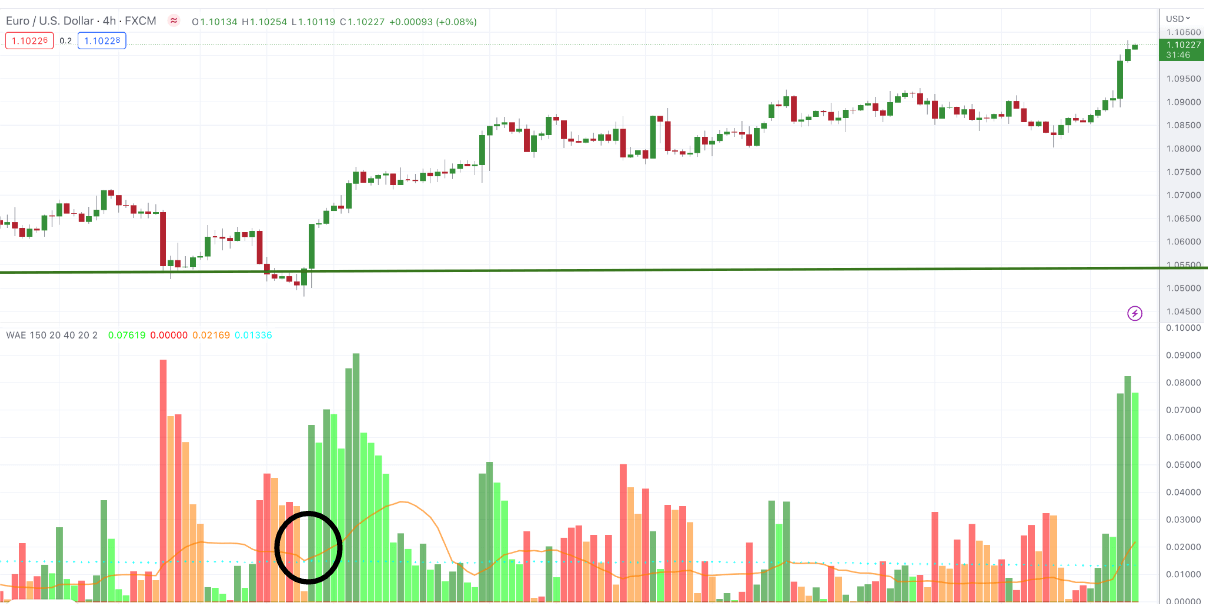
After the confirmation, price moved higher in this historical example. That outcome illustrates the setup, but the same conditions can still fail in live trading.
Use a stop and invalidation level defined by your trading plan rather than assuming an “explosion” will continue.
Sell Example
The chart below is a historical EUR/USD sell example, not a forecast.
The red histogram moved above both the Explosion line and Dead Zone while directional momentum and volatility were expanding.
The Dead Zone filtered weaker movement below its threshold. Its exact calculation depends on the indicator version.
A bearish confirmation candle on the price chart provided additional context before the illustrated entry.
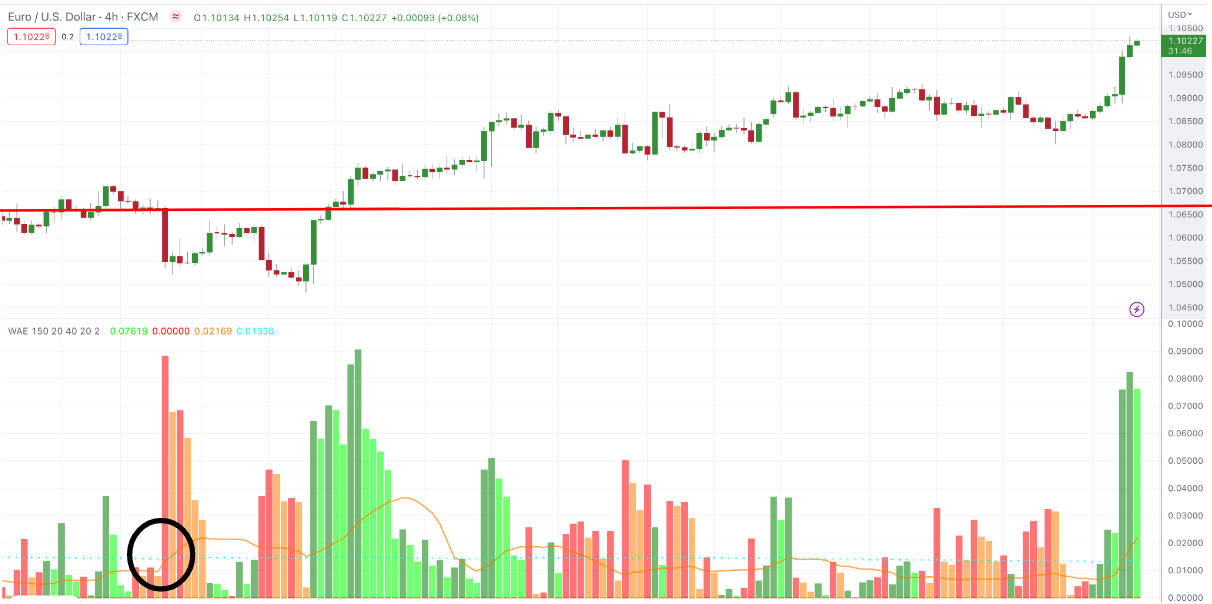
After the confirmation, price moved lower in this historical example. It should be treated as an illustration, not proof that every similar signal will work.
Define the stop, invalidation level, and target before entering a trade.
Tips to Use the Indicator Effectively in the Dead Zone
- Watch whether the histogram and Explosion line are expanding or contracting. Expansion suggests strengthening momentum and volatility; contraction suggests they are fading.
- Ignore a setup while the histogram or Explosion line remains below the Dead Zone. Confirm direction with a breakout or clear support and resistance level on the price chart.
- Treat Waddah Attar signals as confirmation rather than standalone trading signals.
- Check whether your version uses a fixed or true-range-based Dead Zone before changing its settings.
Bottom Line
Waddah Attar Explosion combines MACD-derived directional momentum with Bollinger Band volatility in a compact display. It does not measure buying and selling volume or predict future prices.
Its value is in showing when momentum and volatility are expanding together, which can help you filter possible setups.
Test the indicator on historical data and a demo account before adding it to your trader’s arsenal.
Take Your Trading to Next Level
Get Access to all our Products

Take Your Trading to Next Level
You Might Also Like: