We hope you enjoy reading this blog post.
Become a Pro Trader by using our fine-tuned Indicators and Expert Advisors.
MACD Trading Strategies: How to Trade using MACD.
This article will be going through the basic to advanced concepts of the MACD (Moving Average Convergence Divergence) oscillator.
Introduction
There are several indicators used by traders for various reasons. One of the most popular indicators is the Moving Average Convergence and Divergence oscillator. It is commonly referred to as the MACD indicator.
MACD is a powerful indicator as it can be interpreted in many ways to speculate on the financial markets. In this article, we will be going through the fundamentals of MACD, different ways to interpret it and understand how to trade using the MACD indicator.
What is MACD?
As the name suggests, MACD is an advanced derivation of the moving averages developed by Gerald Appel in 1979. The indicator depicts the relationship between two moving averages of an instrument. It was primarily created as a tool for timing the market.
How is the MACD Created?
The MACD indicator is built using two exponential moving averages with a different period, where the difference between them yields the Fast line. Another average of the specific period becomes the Slow line.
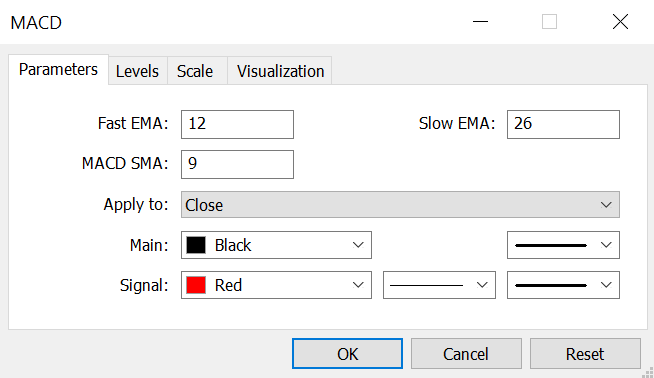
Following are the steps to build a MACD with the standard settings (find the best MACD settings here):
- Determine the 12-period and the 26-period Exponential Moving Average of the instrument.
- Calculate the difference between the moving averages. The resulting line will be the fast MACD line.
- Find the 9-period Exponential Moving Average of the determined fast MACD line. This will provide the slow Signal line.
Luckily in Metatrader and most of the other trading platforms, MACD comes as a standard indicator, so you don't have to carry out the above calculations manually.
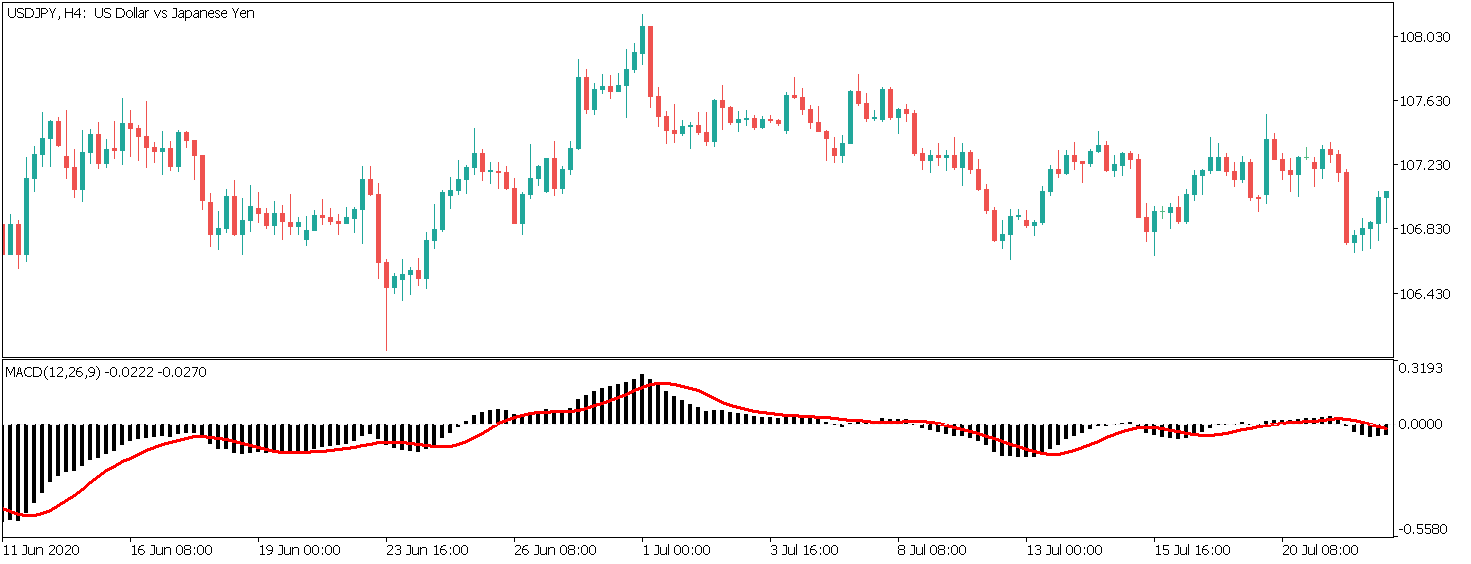
In the below example, the red line on the MACD is the slow signal line, while the histogram represents the fast MACD.
Interpreting the MACD
To learn how to trade using the MACD indicator, interpreting the MACD is critical. Unlike other indicators, there are several ways to interpret the MACD indicator.
The price of the instrument depicts a consensus of value for a given period. And a moving average determines the mean consensus for that period.
A long period Exponential Moving Average on the MACD reveals a long-term consensus, while a short period EMA manifests the consensus in the recent market.
In other words, the fast MACD line formed by the subtraction of the averages discloses the short-term price action, while the other assesses the long-term price evaluation.
Some of the most used interpretations of the MACD indicator include:
- Signal crossovers
- Overbought and Oversold indicator
- MACD histogram
- Divergence between the price and oscillator.
With every interpretation, there are several strategies on how to trade using the MACD indicator. Let’s dive into each method and a strategy supporting the same.
The MACD strategies work best when used with multi-timeframe analysis. Each MACD interpretation is better with MTF, so we also offer an MTF MACD indicator in our store.
How to trade using MACD with Signal Crossovers
The simplest way to trade using the MACD indicator is by signal crossovers.
In a sense, when the fast MACD (main) line passes over the slow signal line, it signifies that the market has begun to show bullish sentiment, and the same is expected to continue in the coming sessions as well.
Conversely, when the mainline crosses below the slow line, it indicates that the sellers have begun to dominate the market.
MACD Trading Strategy 1
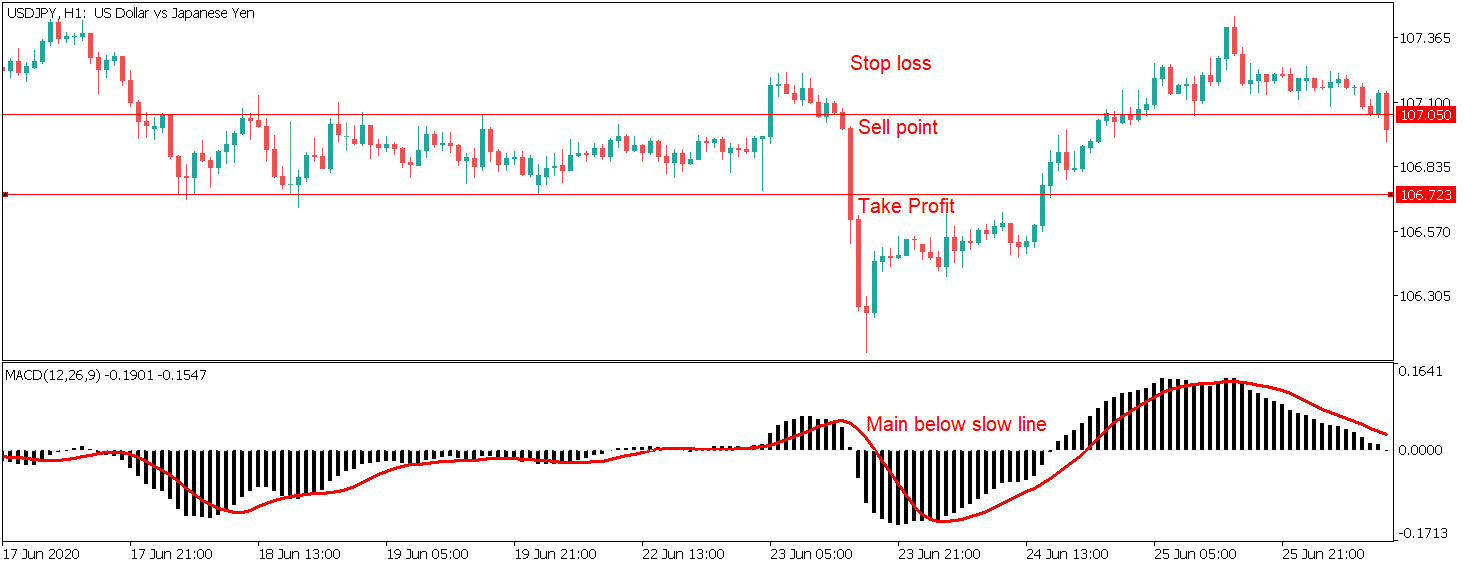
Consider the below chart of USDJPY on 1-Hour time-frame. The price was moving in a narrow range, with the red lines representing the support and resistance level.
At one point, the price tried to break above the resistance but failed to hold above it effectively.
When the market broke back below the resistance, the fast MACD, which was trading above the slow line, crossed through the slow line.
This indicates that the sellers at the resistance are still not done yet. Thus, one can trigger a sell nearby the top of the range.
Stop-loss Placement
The stop-loss must be placed right above the resistance level, as shown.
Take-Profit Placement
The take profit for such trades can be placed at the bottom of the range. If the sellers' momentum is coming strong, you might as well hold let the trade run longer until the subsequent hurdle point.
How to trade using MACD as an Overbought and Oversold Oscillator
The MACD can be interpreted as an oscillator as well. It can be employed to determine oversold and overbought levels in the market.
Unlike oscillators like RSI, MACD does not have any specific overbought and oversold values. Due to which traders use the MACD with RSI to generate buy and sell signals.
Instead, let’s look at a strategy that provides trading signals solely based on overbought and oversold regions on the MACD.
MACD Trading Strategy 2
Since there are no specific overbought and oversold values, we obtain them using the extreme.
Open a chart with the MACD indicator and zoom out to the maximum point. Then find the peak and trough on the MACD oscillator.
These levels hence become the overbought and oversold areas of that instrument. Subsequently, we incorporate the crossover method at these locations to enter a trade.
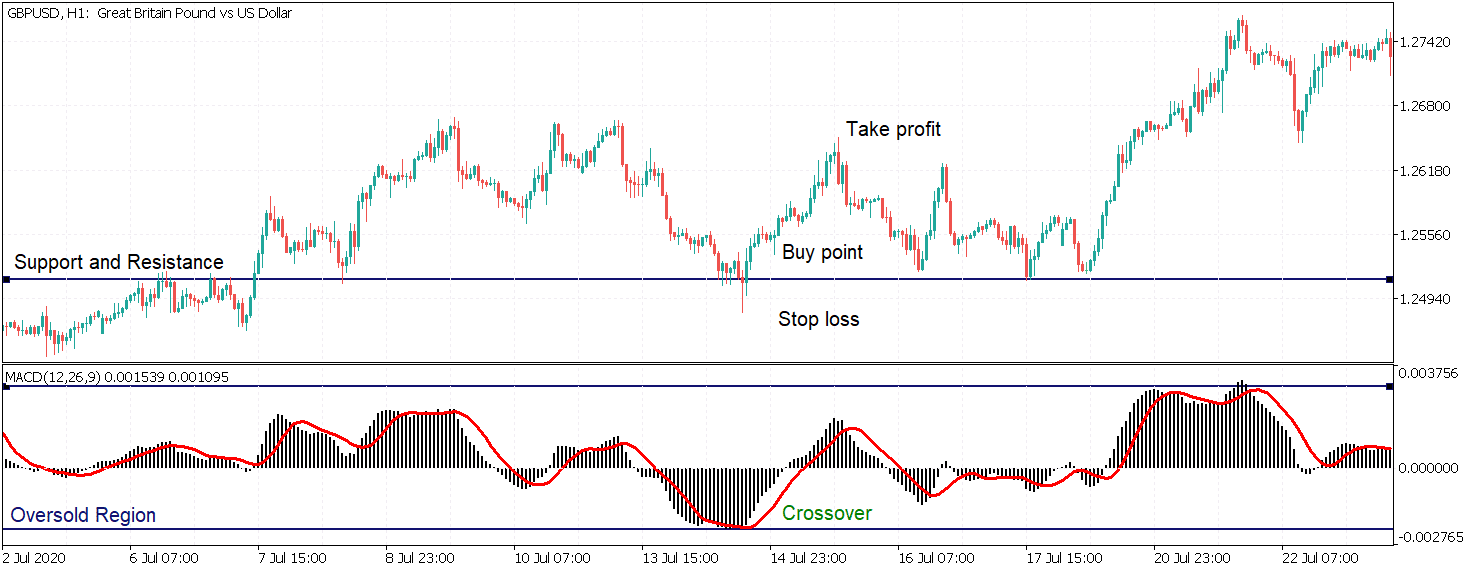
Below is the chart of the Great British Pound against the US Dollar on the 1-Hour time-frame. The chart is zoomed out completely to determine the overbought and oversold regions.
Once these levels are spotted, we wait for the price to reach one of these levels.
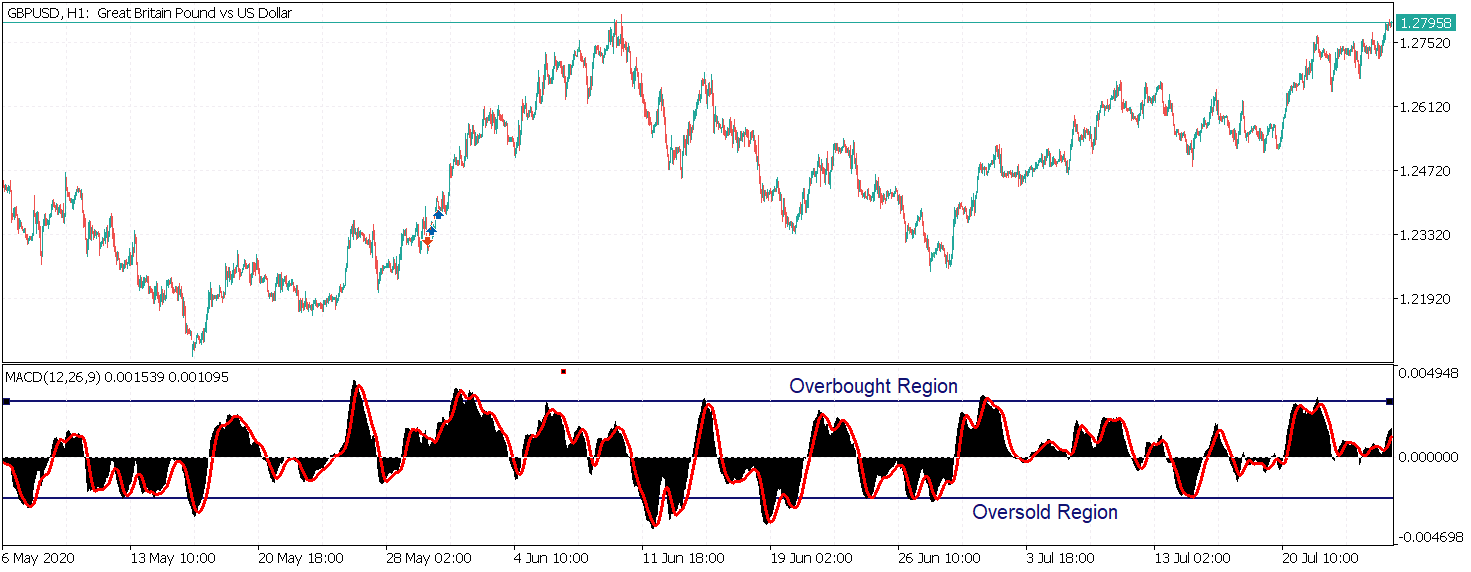
Focusing on the price chart, we see that the market broke above the Support and Resistance, indicating that the buyers dominate the market.
After a few swings, the price dropped until the Support and Resistance level. At the same time, the market reached the oversold region.
Thus, when the fast line crossed over the slow line, we can prepare to go long as it is a confirmation that the big buyers are back in the market to shoot it north.
Stop-loss Placement
The ideal stop-loss for such trades would be few pips below the Support/Resistance level. For this trade, it would rather be safer to place it below the tail of the candle.
Take-Profit Placement
The logical take profit placement would be at the demand areas. However, based on the momentum of the market, you can adjust the TP level accordingly. That said, the risk-reward ratio must be monitored as well.
How to use MACD oscillator to Trade Divergences
Divergence is the most popular and effective technique to trade using the MACD oscillator. MACD Divergence indicates both reversals and trend continuation. Before getting right into the strategy, lets touch base on the theory of Divergence.
What is Divergence in Trading?
Divergence is a scenario in the market where the price movement disagrees with the oscillator movement. As a result, they move apart in the opposite direction.
It usually occurs during a trending market and signifies that there can be an upcoming reversal around the corner.
There are Two Types of Divergence
1. Regular Divergence
Regular divergence hints an upcoming reversal in the market. It gives signs that the market which is in an uptrend is preparing to trend south and vice-versa. They are referred to as regular because they appear often and are easy to spot.
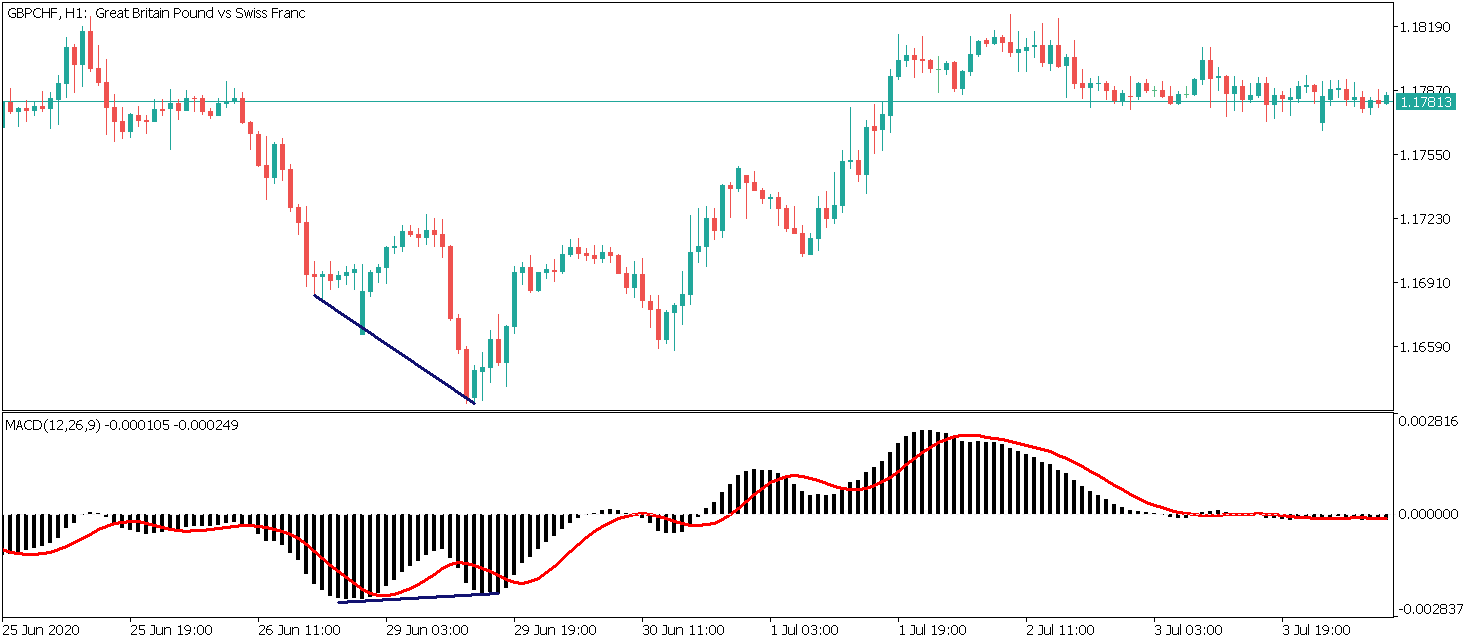
Regular Bullish Divergence: Price makes lower lows, while the MACD makes higher lows.
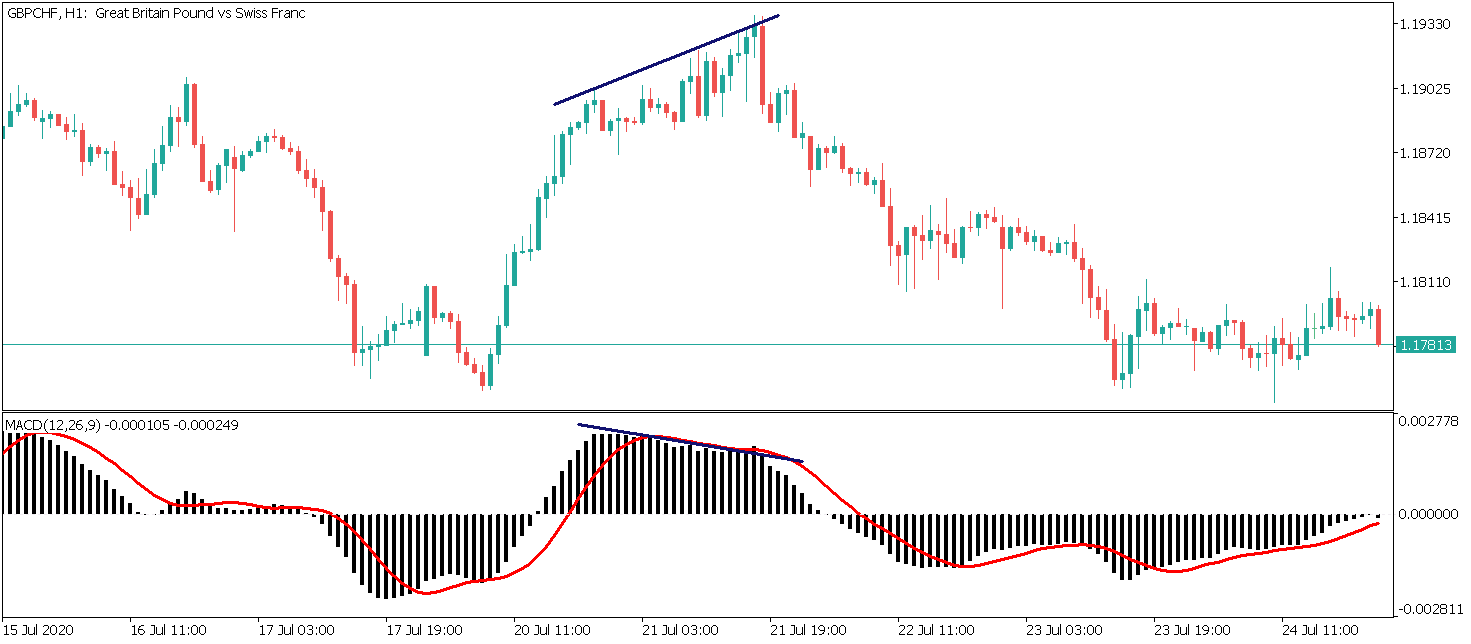
Regular Bearish Divergence – Price makes higher highs, while the MACD makes lower highs.
2. Hidden Divergence
Hidden divergence is found in a newly formed trend or middle of it and indicates the continuation of the same trend. They occur occasionally and are challenging to spot.
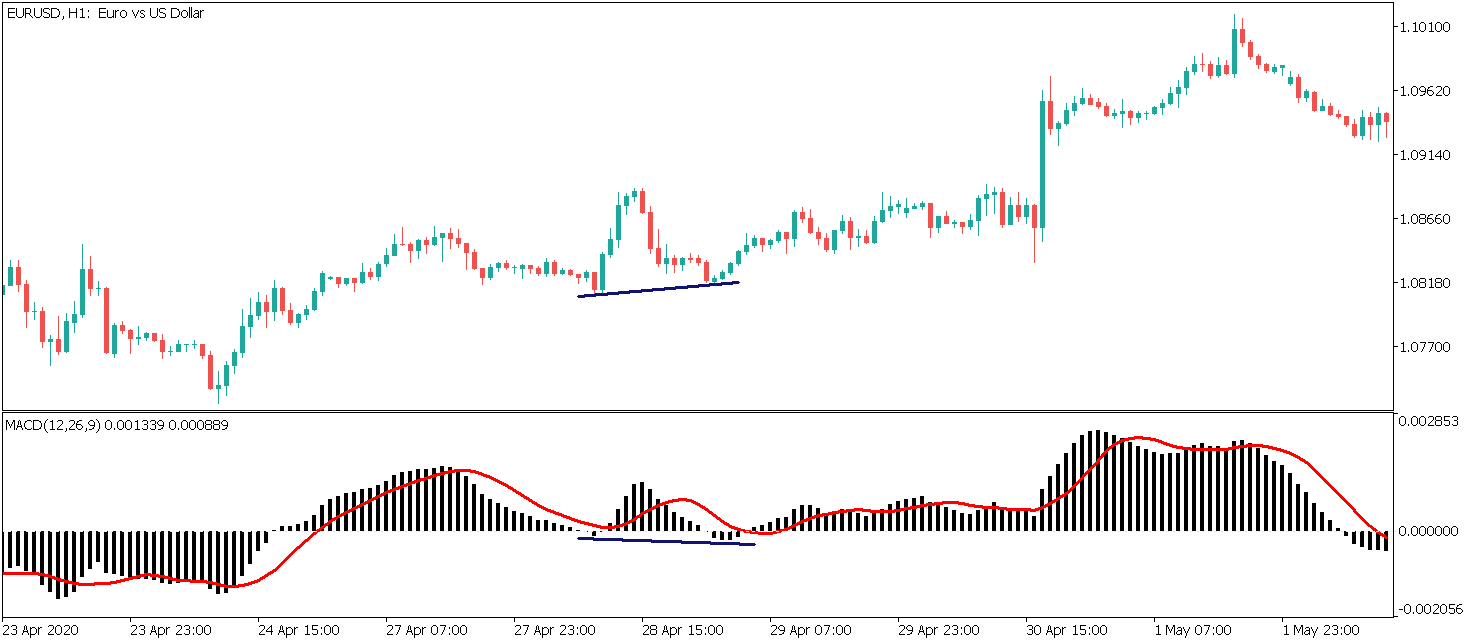
Hidden Bullish Divergence – Price makes higher lows, while the MACD makes lower lows.
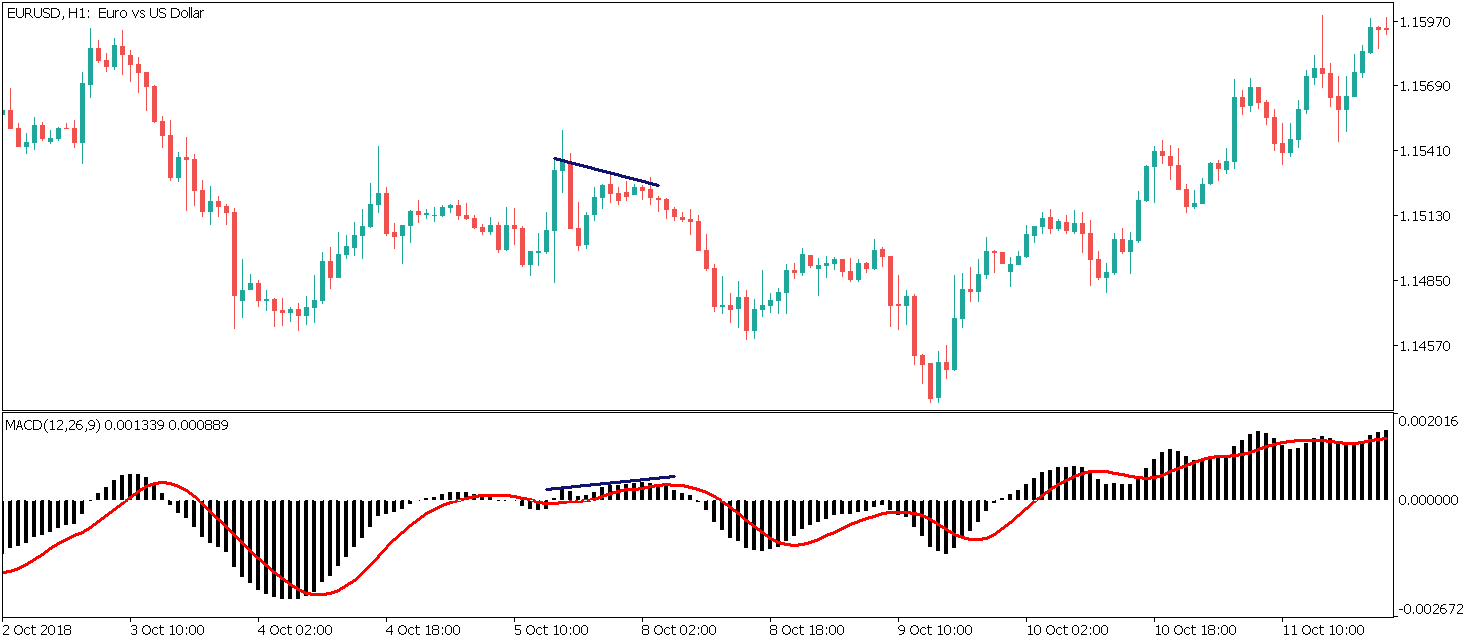
Hidden Bearish Divergence – Price makes lower highs, while the MACD makes higher highs.
Plotting Divergence on the MACD can be extremely difficult at times. In fact, a divergence drawn incorrectly could generate failing signals.
We have a MACD Divergence indicator that shows regular and hidden divergences. And an MACD Divergence EA for those who want to trade fully automated.
The algorithm of this indicator is designed to avoid unsymmetrical divergences and displays only the potential ones, making it an exceptionally reliable indicator. Here is a compelling trading strategy on how to trade using this indicator.
MACD Trading Strategy 3
A downtrend does not turn into an uptrend instantly and vice versa. Instead, it consolidated before beginning a new trend. And a divergence on MACD can give hints and clues that the market is preparing to start a new trend.
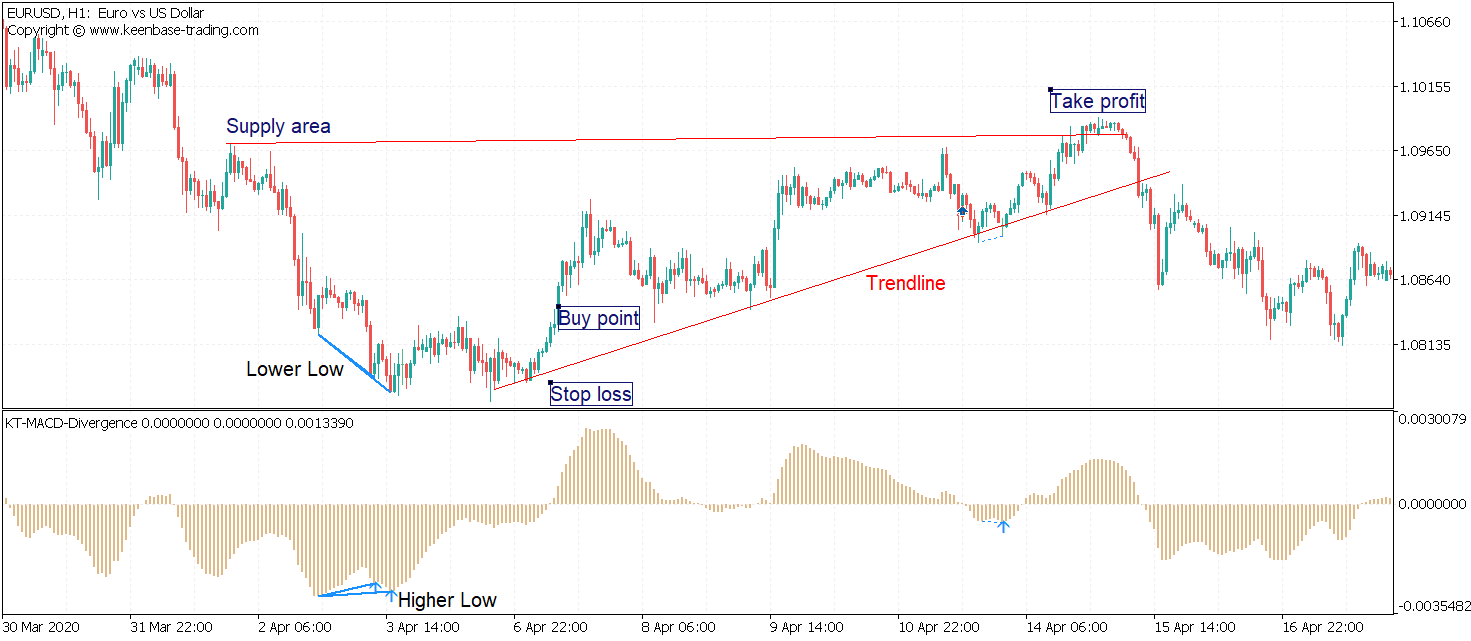
Consider the situation shown below of EURUSD on the 1-Hour time-frame. Observing the price from left, we can see that the market in a downtrend, making lower lows and lower highs. On the latest lower-low, the MACD has made a higher-low. This is a sign that the market is gradually preparing to switch direction.
Note that one cannot open a buy trade right after the divergence shows up. There are a few more confirmations that are needed to confirm the same.
After the divergence has occurred, we wait for the price for failing to make a new lower low. Later, when the breaks above support/resistance level, we can trigger the long positions as marked on the chart.
Stop-loss Placement
Logically, one must place the stop loss at the recent low. Because if the price breaks below the low, it would mean that the downtrend is not done yet.
Take-profit Placement
The take profit can be placed at a potential supply area. Else one could partially book profits and close the rest after the market breaks below the trendline.
Advantages and Disadvantages of using the MACD
Now that we’re cemented on how to trade using the MACD indicator let's conclude the article with some pros and cons.
Pros
- One indicator with several interpretations: One can trade using the MACD indicator by comprehending it in many ways.
- Simple and effective: The MACD indicator is simple to apply and comprehend. Also, it provides effective results when used rightly.
- High risk-reward ratio: Since MACD indicates reversal occurrence, traders can be part of the trade at the very beginning of a trend.
Cons
- Subjective in nature: there are no fixed rules to draw divergences on MACD. Thus, not all marked divergences can turn to correct.
- Lagging indicator: Since MACD takes into account of moving averages for its formation, it is lagging in nature. Hence, traders trading MACD crossovers may get late entries in the market.
We hope you got a clear idea of how to trade using the MACD. Please make sure to practice these strategies on a demo account before trading them on a live market.


