Ready to act? Get ACB Breakout Arrows Indicator Now
Breakout Confirmation Indicator Explained: Simple Steps to Better Entries
Serious traders wait for breakouts to position early and capitalize on high-momentum moves. In a nutshell, it’s about jumping in when the price breaks free from a tight trading range, breaking through support or resistance with intent which is basically high volume signaling the start of a new trend.
A breakout confirmation indicator helps verify that the move is genuine before you commit to the trade entry.
Done right, breakout trading offers a clean entry, limited downside, and the kind of upside; that’s why confirmation is a requirement, otherwise you are just a gambler
But let’s not sugarcoat it: the market loves to fake you out. One minute, it looks like a clean breakout. The next, price snaps back, stops you out, and leaves you wondering what just happened.
That’s why confirmation is a requirement, otherwise you are just a gambler risking it all for a few extra pips.
In this guide, we’ll show you what real breakouts look like, how to confirm them with precision, and how to trade them like a pro.
What is Breakout Trading and Why It Matters
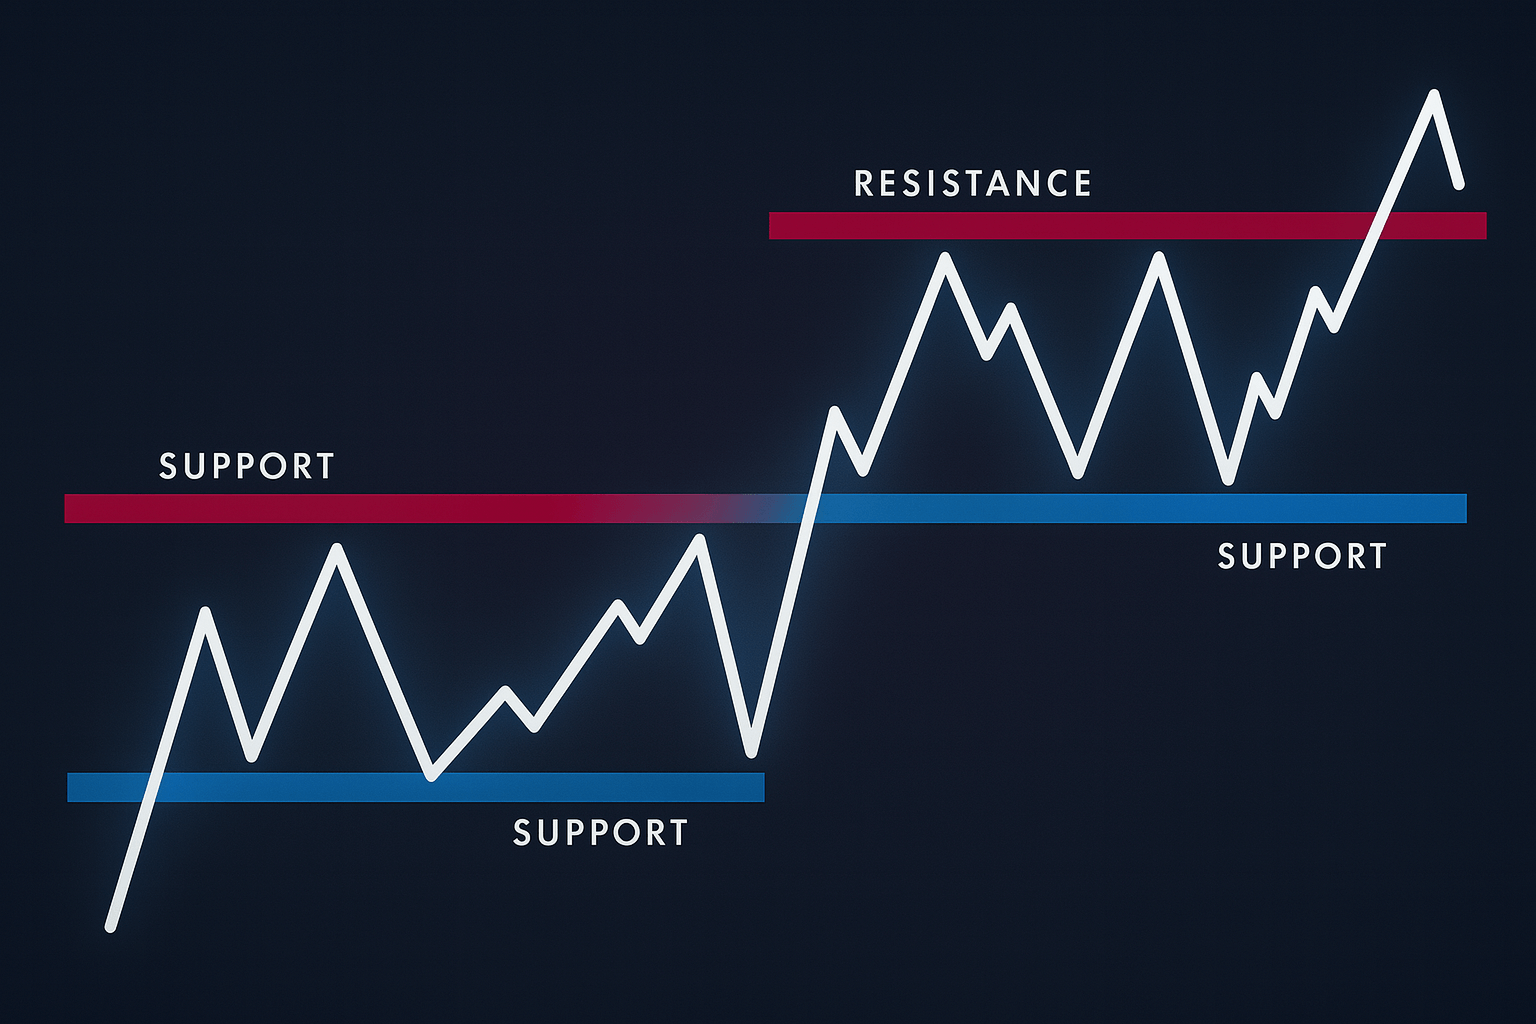
Breakout trading is about identifying the moment when the price breaks out of consolidation and real money enters the market. After ages of consolidation comes the breakout, the decisive move that signals a fresh opportunity.
These are the moments when momentum shifts, volume surges, and the market begins to reveal its hand. If you're in early, you're riding the wave. If you're late, you're chasing scraps and will get slaughtered with the crowd.
Here’s the truth: no one can perfectly time the market. Most traders either jump in too soon or hesitate too long.
Why? They trade breakouts without a real system. No plan, no confirmation, just hope.
Breakouts can be powerful, but they’re not magic. If you want to survive and thrive, you need a process that tells you when to act and when to wait.
For a deeper dive into breakout psychology and strategy, check out our full guide [here].”
Now let’s talk about the real game-changer: confirmation, because that’s what separates the setups that run from the ones that fake grab your Stop-Loss and fail.
The Role of Breakout Confirmation Indicators
The truth is anyone can catch a breakout, it’s not even that hard. Catching the right breakout is the hard part.
That’s where confirmation indicators come in. Their purpose is to validate the move. These tools step in when price breaks a level and answer the one question every trader should ask:
Is this real, or is the market faking me out?
A good confirmation indicator acts like a filter. It doesn’t react to every flicker on the chart. It waits for clear signals of commitment:
- A surge in volume shows the market is backing the move.
- Volatility expansion where the price feels like it’s charging through the level.
- Directional follow-through spotting that momentum is building.
You’re not trying to be first in, you’re trying to be right. Breakout confirmation indicators help you avoid the setups that look perfect on the surface but fall apart the second you’re in.
Think of confirmation like the engineer who signs off before construction. Without it, everything collapses the moment pressure hits.
Confirming Breakouts Like a Pro
Breakout confirmation is more than just price crossing a line. It’s about momentum and intent. It’s price movement with force. You’re looking for commitment, a candle that closes beyond a key level with the kind of energy that only volume and momentum can deliver.
A textbook breakout confirmation looks like this:
- Clean close above (or below) a support/resistance.
- A spike in volume as the move happens.
Without those elements, you’re rolling the dice. With them, you’ve got a trade worth paying attention to.
Understanding Volume and Price Action
Volume is the heartbeat of every real breakout. Without it, even the cleanest chart setup is just noise, a pretty pattern with no backing.
What you’re looking for is simple but critical: a clear spike in volume right at the breakout point. That’s the tell, the signal that real money is stepping in and the market is waking up.
No volume? No conviction. No trade.
Pair that with a clean candle structure, like a wide-range breakout bar, a bullish engulfing, or a strong close above resistance and now you’ve got something worth acting on.
This is what traders call confluence: when volume, price action, and structure all fire in the same direction. That’s when the edge shifts. That’s when you’re no longer guessing you’re aligned with the flow of the market.
Ignore volume, and you're chasing shadows. Understand it, and you're finally trading with purpose.
OBV and Momentum Indicators Explained
Now let’s talk about tools that actually matter. One of the most slept-on confirmation weapons? On-Balance Volume (OBV).
OBV shows where that volume is flowing. Is it pushing with the breakout? Or quietly diverging behind the scenes?
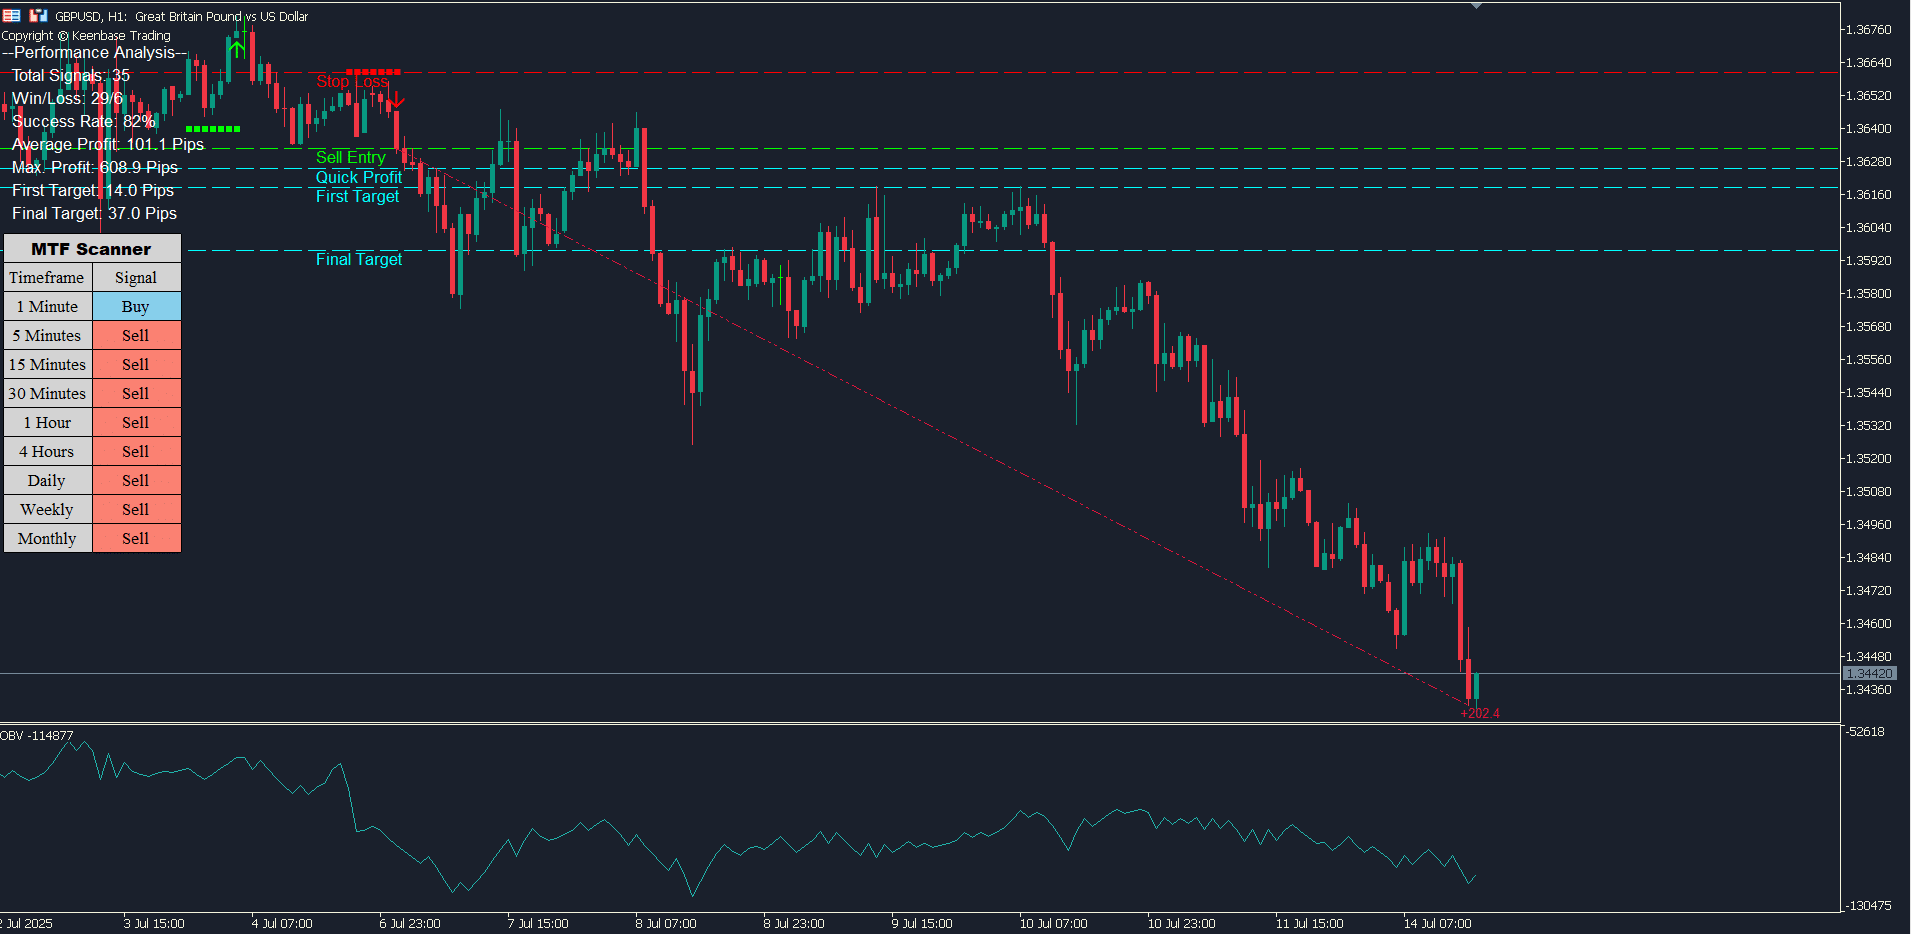
- If price breaks out and OBV climbs with it, that’s confirmation.
- If price breaks out but OBV stalls or dips, consider it a warning flare.
- And if OBV moves before price does? That’s your early signal, smart money is already positioning.
Then you’ve got momentum indicators like RSI or Stochastic. They’re not confirmation tools on their own, but they amplify your read. If RSI is rising into the breakout or breaking out of a range too? That’s another green light.
Used together, OBV and momentum indicators give you a deeper look at how much force is behind the move. And that’s the difference between chasing and capitalizing.
Key Technical Indicators That Pair Well with Confirmation
Price action breakout confirmation tells you something’s happening. But to know if it’s worth trading, you need context: trend, structure, and strength.
Start with the structure: Is this breakout happening at a key support or resistance level? That’s non-negotiable. If price is breaking through a level that’s been tested multiple times, that’s a sign the market is finally ready to move.
Then layer in trend confirmation with a clean moving average setup. Is the breakout with the trend or fighting it? You want alignment, not a million contradictory questions.
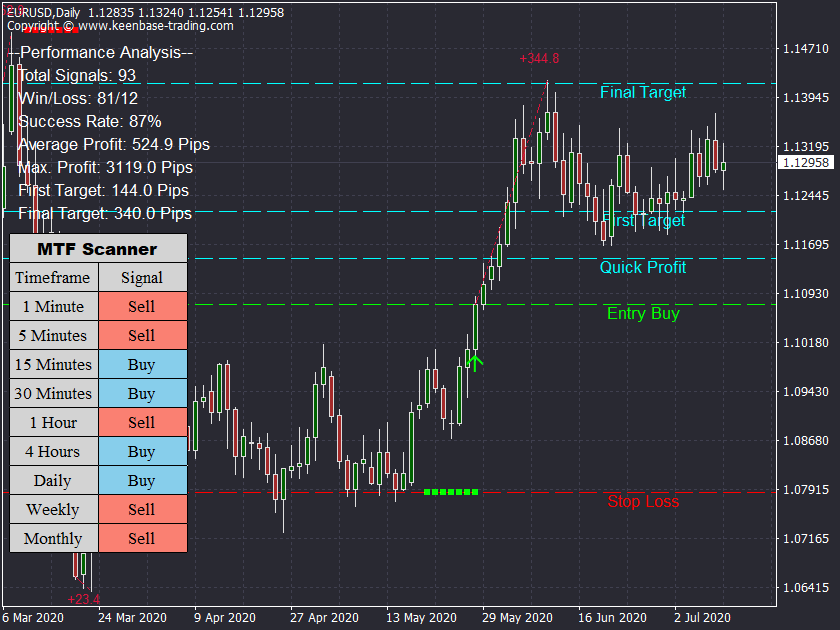
And instead of manually stitching together a dozen indicators, tools like the ACB Breakout Arrows Indicator can do the heavy lifting. It identifies high-conviction breakout zones, tracks volume strength, and fires clean signals when the odds are in your favor.
It’s built to recognize breakouts off meaningful support/resistance zones, with suggested stop-loss and take-profit levels already dialed in.
Combining Indicators for Stronger Signals
Here’s the sweet spot: confirmation + structure + momentum.
- Confirmation = price breaks a key level with volume.
- Structure = the level matters (tested support/resistance).
- Momentum = there’s follow-through, not hesitation.
The ACB Breakout Arrows indicator checks all three and gives it to you on a gold plate, keeping your charts clean and your decisions clear. When it fires, it’s because the market gave you three reasons to pay attention, not one.
Optimizing Settings and Managing Risk
Keep in mind that trading is subjective, everyone sees a different thing, that is why we have buyers and sellers in the most liquid market in the world. This is another reason why optimization and risk management are a very important part of the job.
Here’s what to do: start by backtesting your confirmation settings on your preferred timeframes. What works on a 15-minute chart won’t behave the same on the 4-Hour. You want to find the sweet spot between responsiveness and reliability, not too slow to miss the move, and not so sensitive it picks up noise.
Make sure to avoid the trap of curve-fitting, tweaking your settings to perfection in hindsight, only to watch them fall apart in live markets. Your goal isn’t to build a perfect system or the next hedge fund, but a consistent one that works in the wild.
Stop Losses, Position Sizing, and Common Pitfalls
Risk is where most breakout traders get wrecked not because the setup was bad, but because the risk wasn’t managed and traders build castles in the air for themselves.
Use structure-based stop losses. For bullish breakouts, that’s just below the breakout level or pattern base. For bearish ones, above the resistance. Then calculate position size so you’re risking no more than 1–2% per trade. That’s how you stay in the game when the market plays rough.
Or,let your tools do it for you. The ACB Breakout Arrows takes the guesswork out of trade management by automatically placing stop-loss and take-profit levels directly on your chart based on the setup’s structure and momentum. To further optimize your strategies, consider using trading filter techniques alongside such indicators.
You’ll know where to enter, where to get out, and how much risk you’re taking before you even click the button.
Avoid the usual mistakes:
- Overtrading on every signal without confirmation.
- Emotional decisions, like doubling down after a loss.
- Ignoring volume and structure, and trading every pop like it’s a breakout.
Master the risk game, and you’re no longer a gambler. We can officially say Welcome to trading.
Conclusion: Make the Confirmation Work for You
Breakout trades can change the game but only if you’re trading the right ones. Using a breakout confirmation indicator as part of a clear confirmation process, along with smart indicator choices and tight risk control, helps you stop reacting and start executing with precision.
Whether you're using your own system or relying on tools like the ones Keenbase offers, the key is the same: clarity over noise, confidence over chaos.
Stick to your rules. Trust your edge. Let the breakout come to you.
Take Your Trading to Next Level
Take Your Trading to Next Level
You Might Also Like:

