
15-Minute Opening Range Breakout Strategy: Rules and Risk

A 15-minute opening range breakout (ORB) strategy marks the high and low of the first complete 15-minute candle after a chosen market session begins. A trade is considered only after a later 15-minute candle closes outside that range.
There is no universal ORB success rate. Results depend on the market, session, entry, stop, exit, trading costs, and test period, so the rules must be validated on the market and session you intend to trade.
Use one fixed rule set for testing. Define the session boundary and timezone before the day starts, then keep the same entry, invalidation, position-risk, and exit rules throughout the sample.
The ACB Breakout Arrows Indicator can be used as an optional visual aid for breakout bars, but it does not replace these rules or prove performance.
Breakout Trading Explained
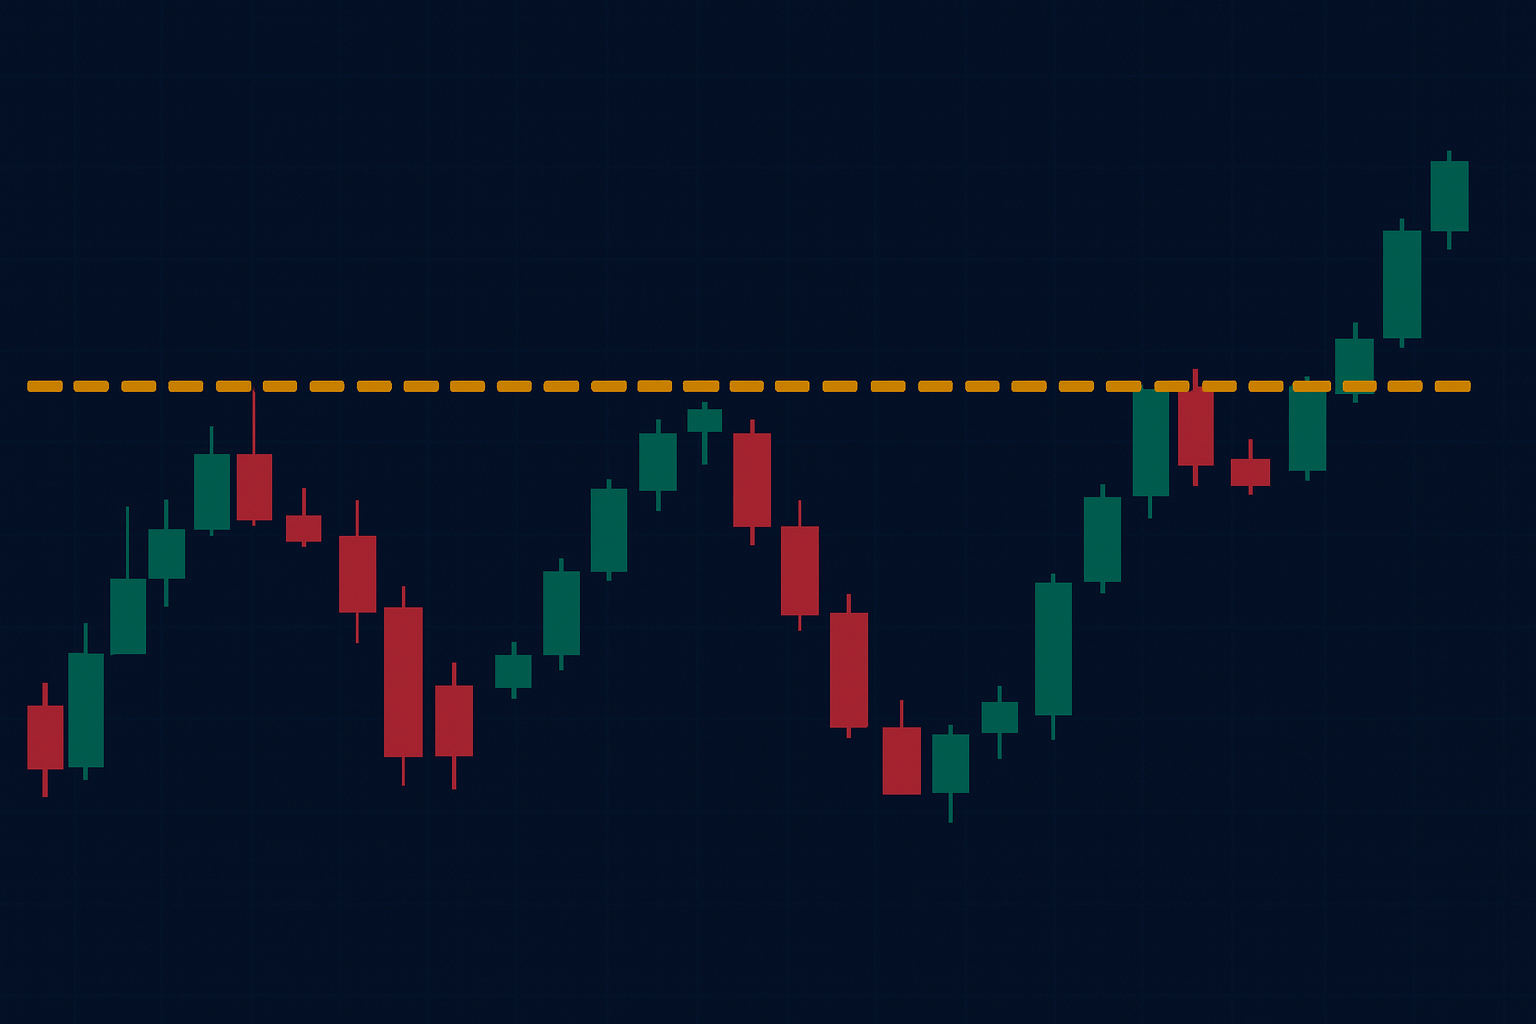
At its core, any sort of breakout trading is solely about capturing moments when the market participants shift gears and a tug-of-war starts between buyers and sellers to move the price in a certain direction, out of the current trading range.
The 15-minute orb strategy zeroes in on these moments immediately after the market opens, leveraging the fact that early trading often sets the tone for the day.
But what truly distinguishes breakout trading from simply chasing price moves is the understanding that breakouts represent more than just price exceeding a level.
They reflect the total market sentiment beneath.
This conviction stems from traders digesting overnight news, reacting to economic data releases, or adjusting positions in response to global events that unfold before the market bell.
Imagine the opening range as a contained pressure cooker.
Price action within this range reflects hesitation and balance.
When price escapes this containment, it’s akin to releasing built-up steam, often propelling sharp, directional moves.
Experienced breakout traders understand that timing is everything.
Rather than jumping in at the first sign of breakout, the market shows, they wait and watch for the market's heartbeat.
The heartbeat is a mix of market conditions, including volume surge, rapid order flow shifts, and volatility spikes. These cues express the shift in the supply-demand curve that is occurring under the skin of the indicators and candles.
Beyond the technical part, breakout trading is also a psychological game.
It rewards patience to let the range develop and discipline to avoid false starts.
Demanding a keen sense of market sentiment and the humility to accept that not every breakout will lead to a home run.
For traders looking to deepen their mastery, exploring price action in context offers invaluable insights.
Our Price Action Breakout Strategy delves into the art of reading price structure and momentum nuances that bring breakout setups to life, complementing the fast and focused nature of the 15-minute orb approach.
Trading with the ORB Strategy
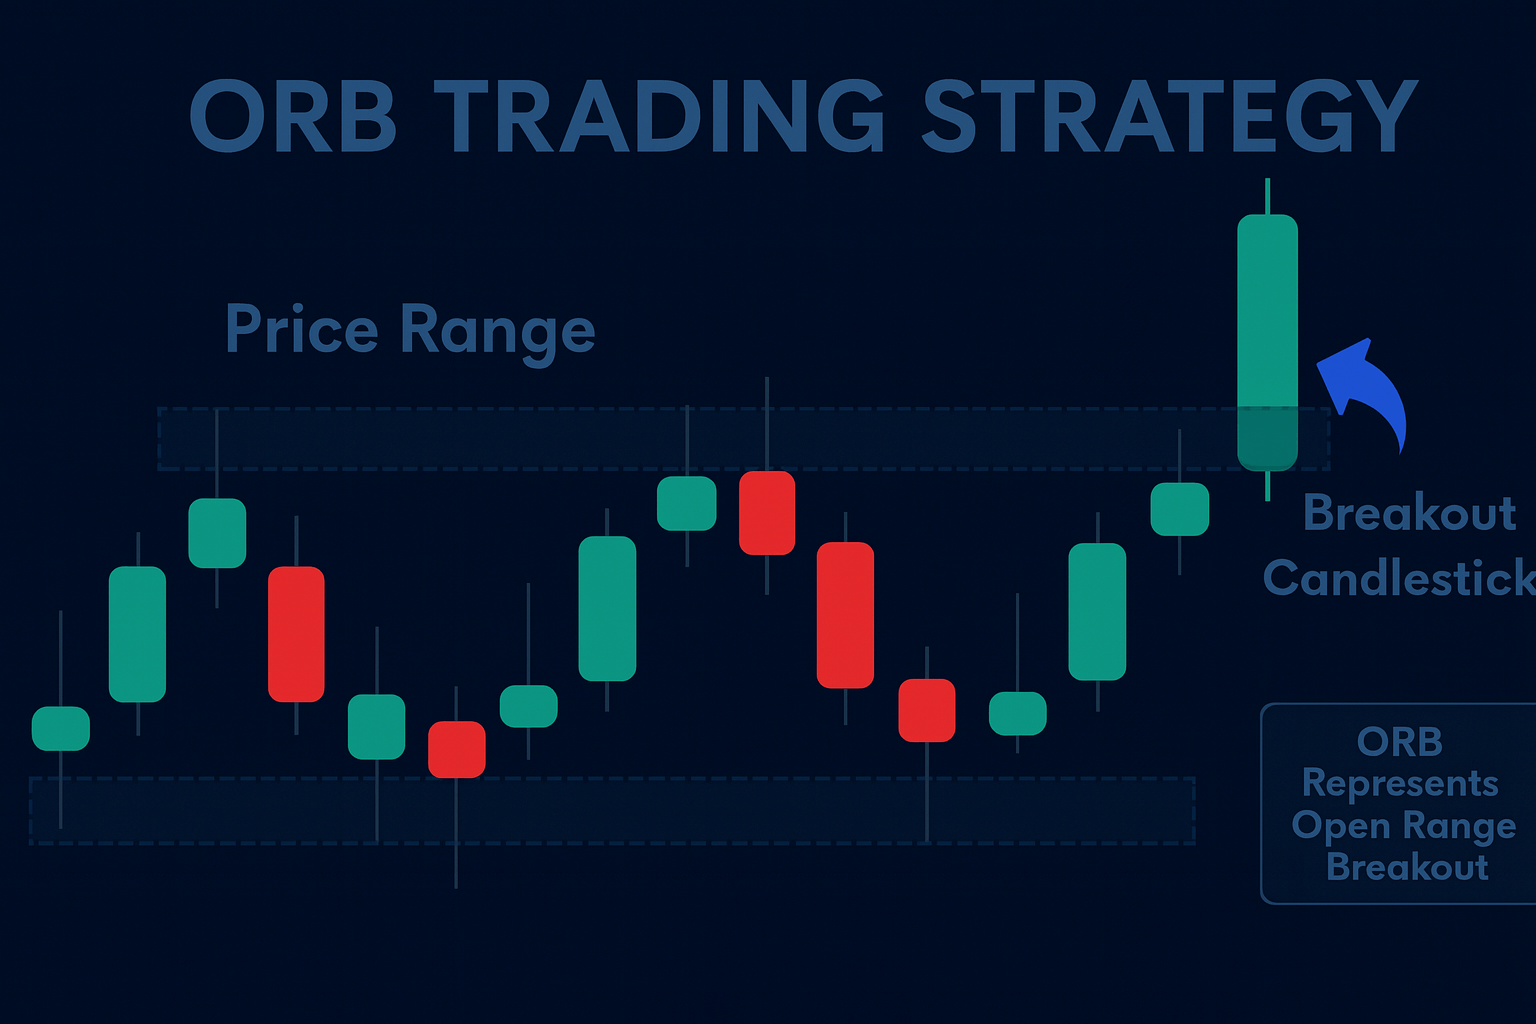
The opening range is only testable when the market, session, entry, stop, and exit remain fixed. The rules below define one baseline that can be applied consistently.
15-Minute ORB Rules
- Market and session: Choose one market. Record the session start, timezone, and equivalent broker server time. Mark the high and low of the first complete 15-minute candle after that boundary.
- Breakout confirmation: Wait for a later 15-minute candle to close beyond the range. A wick beyond the line is not a confirmed breakout under this rule.
- Entry: Choose one method before testing. Enter at the confirming candle close, or wait for the first retest of the broken boundary. Do not switch methods after seeing the outcome.
- Invalidation and risk: Place the stop beyond the opposite side of the opening range and size the position so a stopped trade risks the same fixed fraction of the account.
- Exit and costs: Choose one exit before testing, such as a fixed risk-to-reward target or a fixed session exit. Include spread, commission, and slippage in every result.
Optional variables to record:
- Range Width Analysis: Record the opening-range width and compare results across predefined groups. Do not assume that a narrow or wide range performs better without market-specific evidence.
- Volume Dynamics: If volume is part of the rule set, define its measurement and threshold before the sample starts. Test whether it changes results for the chosen market and session.
- Multiple Timeframe Confirmation: If higher-timeframe alignment is included, define the exact condition and apply it to every trade in the sample.
- Re-entry and Pullback Strategies: Treat a close entry and a pullback entry as separate rule sets. Combining them makes the result harder to interpret.
- Session and Market Specific Adjustments: Validate each market and session separately instead of combining unlike opening behaviors.
The ACB Breakout Arrows Indicator can mark breakout bars as an optional visual aid. It does not establish the strategy rules or prove that a signal has a higher probability of success.
Its visual markers can be reviewed alongside volume surges and trend context, but any filter must be defined and validated separately.
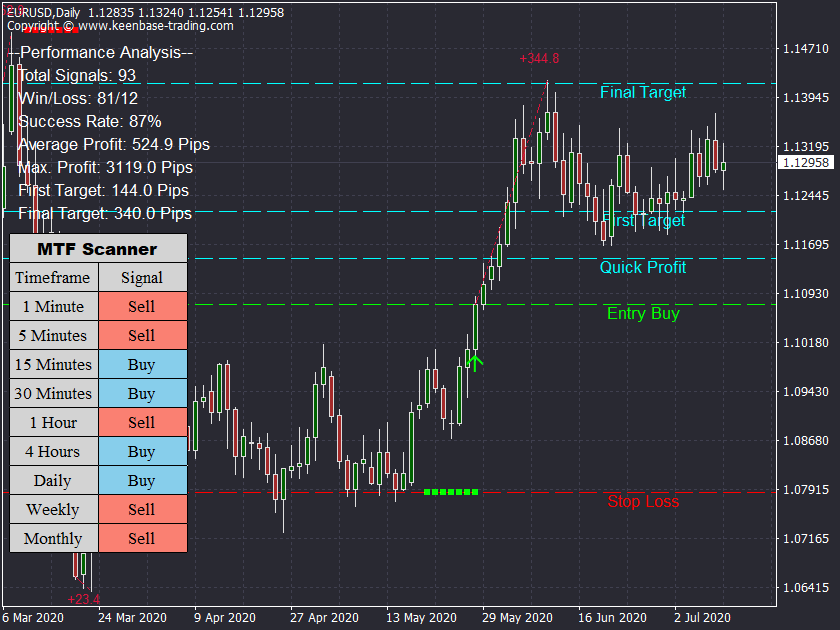
Treat the ACB marker as an optional visual cue only. Use the same entry, stop, exit, and cost assumptions when measuring any setup it highlights.
Day Trading Factors to Keep in Mind

A rarely discussed advantage is developing a session-specific sensitivity.
This requires knowing how the Opening range breakout behaves across different sessions, geopolitical events, and economic calendar events.
Let's have an example of this,
At the start of the Ukraine-Russia conflict, combined with a higher-than-expected U.S. CPI report, the New York session opened with significantly increased volatility.
This caused the opening range to be much wider and more unpredictable than usual.
On a normal day, with CPI meeting expectations and no geopolitical tensions, the opening range tends to be tighter and more stable.
Understanding this difference is critical for traders using the 15-minute orb strategy, as wider ranges require more cautious risk management and confirmation to avoid false breakouts.
Pairing the orb strategy with contrarian intraday setups or volume-weighted average price (VWAP) reversion trades can provide a balance, offering alternative pathways when the breakout fades or stalls.
This multi-pronged approach reduces the emotional strain that comes from relying solely on one pattern or strategy.
Managing Risk and Directional Bias
Beyond the conventional wisdom of placing stops inside the opening range, expert traders employ dynamic stop placement techniques that adjust in real-time based on volatility and market context.
For instance, instead of static stop distances, some traders use volatility corridors areas derived from recent Average True Range (ATR) calculations combined with volume profiles to position stops in zones that provide breathing room during sudden spikes but remain tight enough to limit damage.
Understanding directional bias goes deeper than identifying bullish or bearish trends.
It involves interpreting market microstructure cues, such as order flow imbalances and participant behavior shifts within the opening range.
This allows traders to assess whether a breakout is likely to be supported by sustained buying/selling pressure or if it’s vulnerable to quick reversals.
Ultimately, risk management in this strategy is not about book rules but about adaptive discipline being flexible enough to respect market signals while maintaining the courage to act decisively when conditions align.
Analyzing Trading Performance
Validate one fixed rule set on one market and session. Use an earlier in-sample period to choose the rules, then evaluate the unchanged rules on an untouched out-of-sample period.
Keep the test sample separate from the period used to choose the settings so the result is not fitted to the same data.
To elevate your 15-minute orb strategy, you must systematically track key performance metrics such as your win rate, average returns per trade, and maximum drawdown.
Record trade count, win rate, average gain, average loss, expectancy, maximum drawdown, spread, commission, and slippage.
Demo-test the final rules before using live capital. If an entry, stop, or exit changes, start a new test rather than combining the results.
By asking these questions and rigorously analyzing your trades, you transform raw statistics into actionable insights.
Regularly reviewing your trading journal with a critical eye allows you to identify strengths to build upon and weaknesses to address.
This data-driven feedback loop empowers you to fine-tune your strategy, optimize risk controls, and improve decision-making under pressure.
Conclusion
The 15-minute ORB is a rule framework, not a guaranteed edge. Use fixed definitions, controlled risk, and recorded results to decide whether it is suitable for the market and session you trade.
The more disciplined the further you will come.
Use the ACB Breakout Arrows Indicator only as an optional visual aid. Its markers do not replace fixed rules or validation.
Continue to review your performance, stay flexible, and remember that every trade is a step forward on your trading journey.
Take Your Trading to Next Level
Get Access to all our Products

Take Your Trading to Next Level
You Might Also Like: