Ready to act? Get ACB Breakout Arrows Indicator Now
Master the 4 Hour Breakout Strategy for Better Entries and Exits

The Forex market is a complex and dynamic environment, a space where traders compete with precision, speed, and strategy.
Yet, in the throes of short-term fluctuations and unpredictable market moves.
Hides a strategic gem that stands out for most traders as it offers clarity and a high potential win rate: The 4-hour candle breakout strategy.
This article breaks down the architectural mechanics behind the H4 breakout strategy, which is built to identify price breaks without relying on lagging indicators or getting distracted by short-term market chaos.
Introduction to Forex Trading
Forex trading is not gambling; it’s not placing a bet and starting to pray that it hits your target.
It’s about probability, performance, and precision
The forex market, formally known as the foreign exchange market, is the largest and most liquid financial market on Earth, with over $7.5 trillion traded daily.
That’s more than the stock market, futures market, and crypto market combined.
And it’s not slowing down.
What makes Forex even more intense?
- It's open 24 hours a day, five days a week.
- It never sleeps, because global currencies never stop moving.
- Central banks, hedge funds, corporations, and retail traders all play in the same sandbox.
But here’s the shocking part:
More than 90% of retail traders lose money in forex.
Not because the market is unbeatable, but because they lack a defined edge.
Most of them trade emotionally, without a tested framework, and blow up their accounts chasing short-term wins.
To survive and, more importantly, to profit consistently
You need a system
A framework that translates raw price movement into structured decision-making.
While many traders rely solely on naked chart analysis, the pros understand the value of tools that objectively confirm breakout setups, especially when volatility spikes and hesitation creeps in.
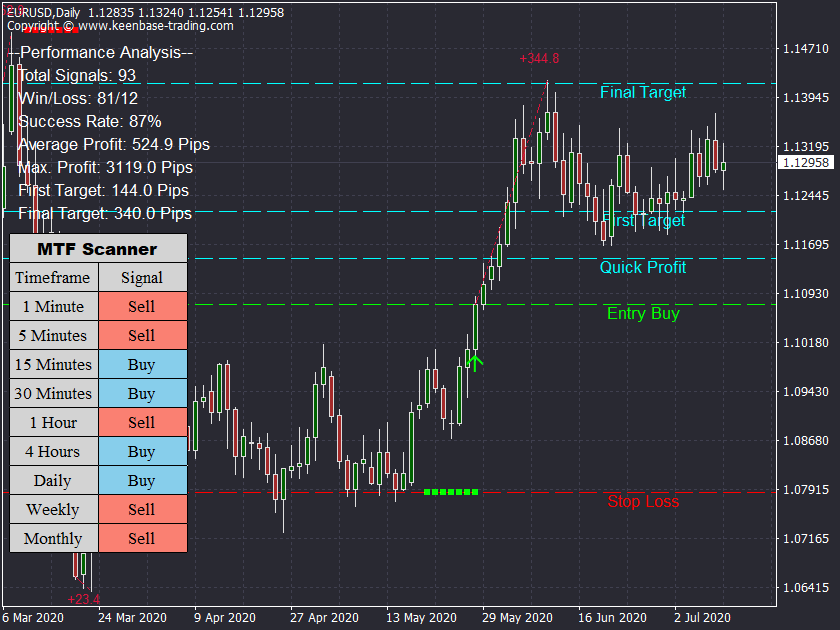
That’s where specialized tools like the ACB Breakout Arrows Indicator earn their keep, not as shortcuts, but as execution enhancers.

This indicator isolates clean breakout signals by scanning for price compressions near key levels, waiting for directional momentum to settle, and then firing a visual entry confirmation just before the breakout surge.
It's not predictive, but reactive, at the exact moment the price breaks through the wall.
Used properly, it becomes more than an indicator.
It becomes your confirmation filter, giving you the green light on breakouts that matter and silencing the ones that don’t
Understanding Breakout Strategies
A breakout strategy is exactly what you think: making money on the price movement of a pair beyond the predefined or set range.
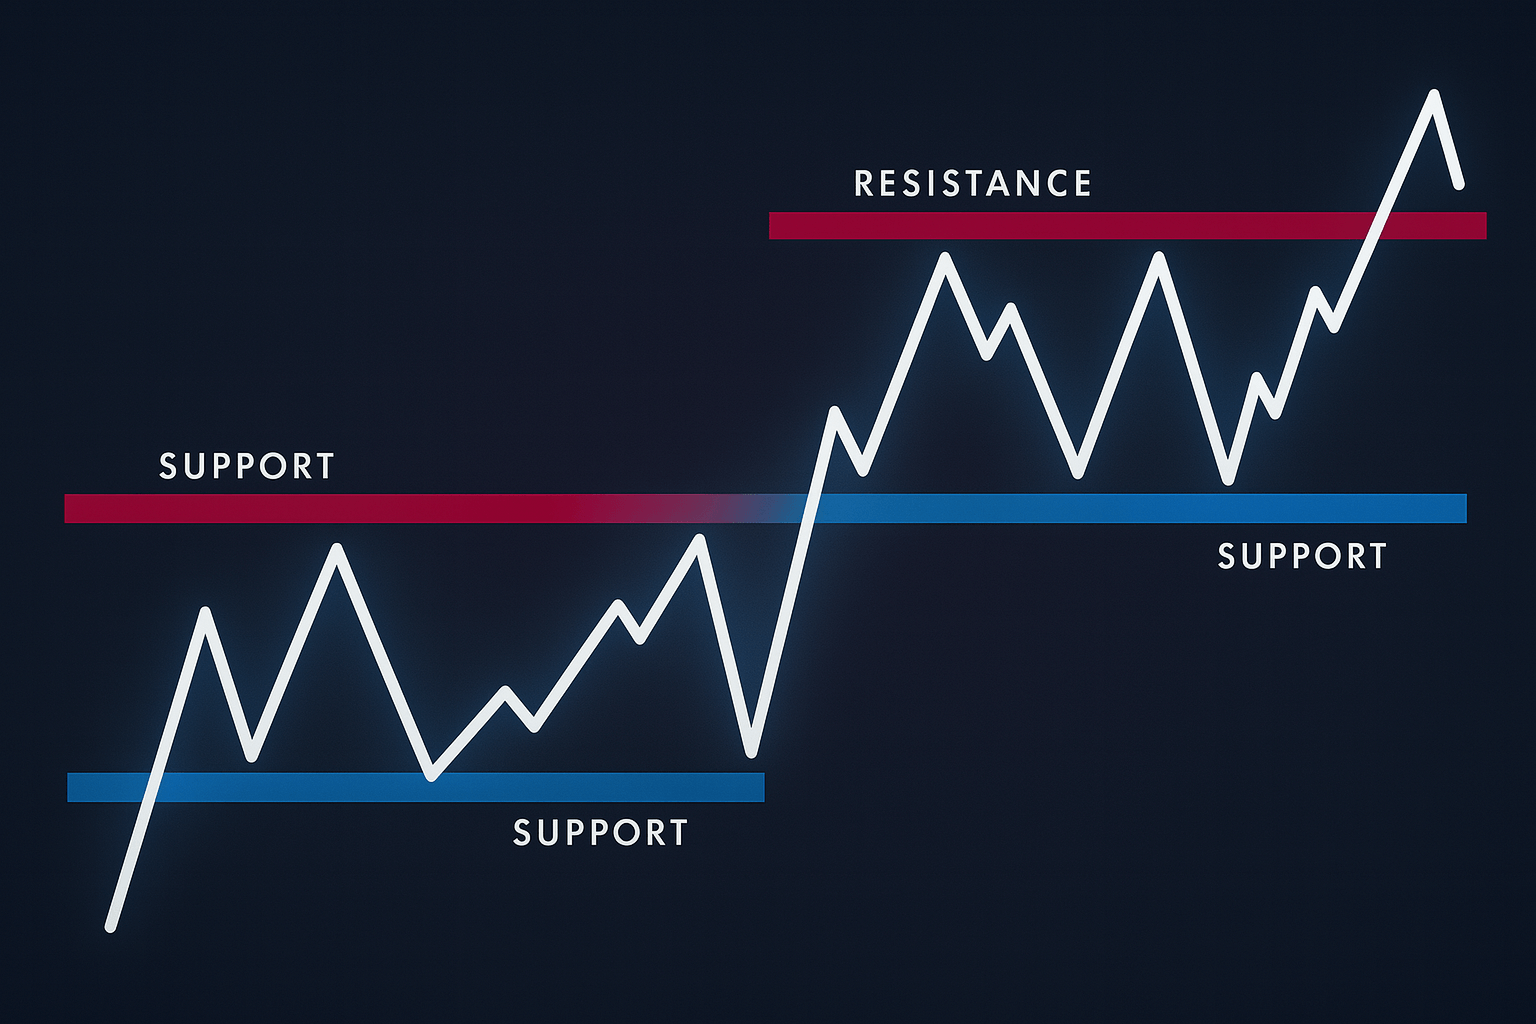
This typically happens when price breaks through key support and resistance levels, signaling either a trend reversal or continuation.
Most breakouts occur at areas of support or resistance, price either breaks up as the participants decide that the asset is worth more, or breaks down if they decide that it is overpriced.
The 4-hour chart is ideal here.
Why?
Because it strikes a golden balance between avoiding the whipsaws of lower time frames while not lagging behind like daily or weekly charts.
Using the 4 Hour Chart
Let’s get tactical.
All breakout strategies begin with one critical task, and the H4 breakout strategy is no different.
You should start by identifying the key price level
This area is where support and resistance intersect with recent swing highs or lows, which at most times aligns with MAs or prior session ranges.
Once identified, the game plan is simple: wait and observe.
No chasing breakouts.
No panic entries.
You want to see how the price behaves as it approaches the level. Are we building volume? Is there rejection? Is momentum drying out or building up?
This is where the 4-hour chart becomes lethal.
Why the 4-Hour Chart Works So Well:

- Filters out short-term market noise: Unlike the 5- or 15-minute charts, the 4-hour candle smooths out intraday whipsaws that lead to false breakouts.
- Reveals trend direction without the latency of daily charts: Perfect for catching momentum early, but not prematurely.
- Supports high-probability setups: Clean structure, multi-bar consolidation, and defined breakout levels.
- Provides time for strategic planning: You have a full four hours per candle to assess price behavior, adjust risk, and align your stop loss and take profit levels accordingly.
For traders who like breathing room between decisions without losing trade frequency, the 4-hour chart is the sweet spot.
Time Frame Analysis

The truth is, the one chart will never tell you the full story.
Professional traders are the ones who stay away from gambling, and they trade what the market is telling them across multiple time horizons.
How to Use Multi-Time Frame Analysis Like a Pro:
- Start with the Daily Chart: This is your trend filter. It tells you whether you're swimming upstream or down. If the daily trend is up, you only look for long breakouts on the H4. No counter-trend ego trades.
- Zoom into the 4-Hour Chart: Here’s where you define the breakout range, draw your levels, and assess price structure. It’s your execution prep zone.
- Refine with the 1-Hour or 15-Minute: These charts help you fine-tune the timing of your entry, spot rejection candles, and catch volume spikes or fakeouts before the move starts.
Stacking Time Frames Gives You:
- Directional bias.
- Confirmation.
- Timing.
When all three align, breakout levels on H4, a strong daily trend, and volume momentum on lower time frames.
You are on the right path.
Price Action Mastery
Price action is the skill of interpreting market psychology from the raw movement of price, without relying on lagging indicators or overloaded screens.
You’re reading how buyers and sellers are interacting to push the price up or down based on the parties' demands.
Key Price Action Signals for Breakout Traders:
- Pin Bars or Rejection Candles near breakout zones signal hesitation or traps. If you see a long wick pushing into resistance and closing weakly. Chances are, buyers are getting absorbed.
- Bullish/Bearish Engulfing Candles indicate strength and conviction. When a strong candle eats the prior bar completely, it often precedes aggressive continuation.
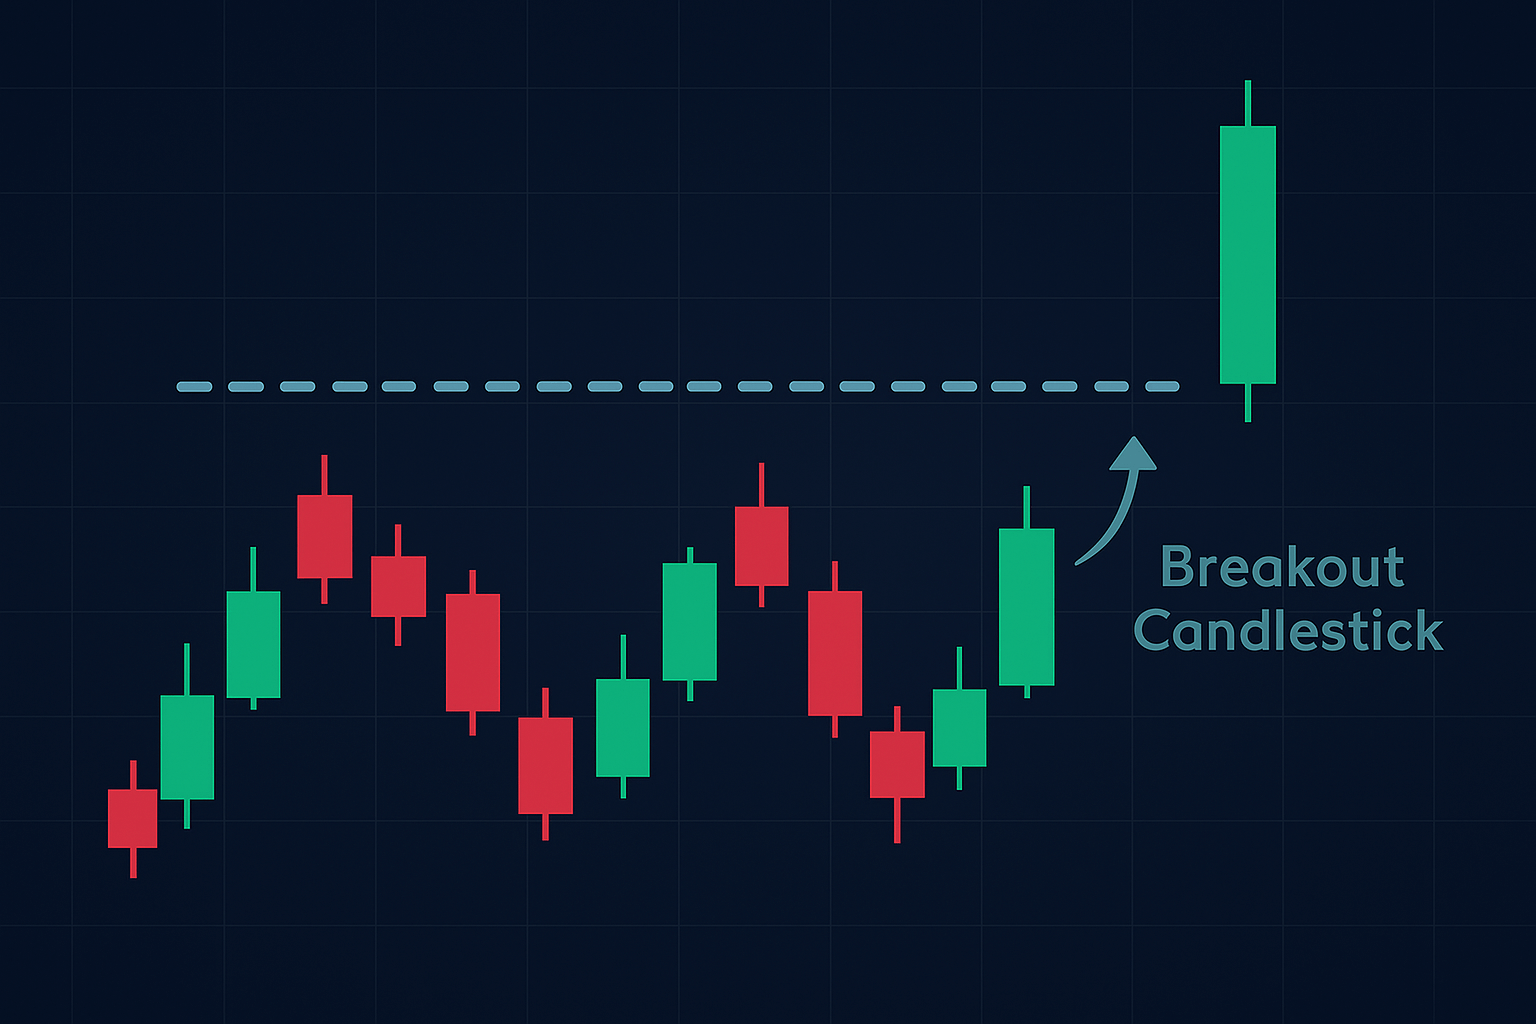
- Candle Close Above or Below Breakout Level: This is your confirmation. Wait for a full candle to close beyond the breakout zone, not just a wick poke or intra-candle spike.
- False Breakout Clues: Price breaks out but fails to close above the level, or immediately retraces with a heavy counter candle. This signals a failed attempt, stand down, or consider fading it.
By studying the previous bar and current candle structure, you gain insights into market pressure, intent, and momentum.
Combined with volume and session timing, this becomes your crystal ball for breakout validation.
Support and Resistance Precision

If you're not identifying support and resistance zones with sniper-level accuracy, you're not trading, you’re gambling.
These aren’t just lines on a chart. They're battlefields, where liquidity pools, algorithmic traps, and institutional orders collide.
Here’s what most traders never learn:
S/R are zones of decision-making, where traders are forced to commit, hedge funds place layered orders, and algorithms trigger massive fakeouts before the real move begins.
You want to map these levels before the move, not during the chaos.
How to Chart Them Like a Pro Operator:
- Dynamic Trendlines: Don’t just draw diagonal lines; connect points of swing agreement where price reacted and volume confirmed. These trendlines should adapt to volatility and intersect with other key zones.
- Horizontal Breakout Zones: Go beyond textbook highs and lows. Scan for consolidation clusters, failed breakout attempts, and candle body closes. These are the true pain points where market makers defend or surrender territory.
- Moving Averages (Properly Used): Don’t use the 200 EMA because YouTube said so. Match your MA to your strategy’s time frame. For 4-hour breakout trading, the 21 EMA or 50 EMA often acts as a magnet during pullbacks and a springboard during breakouts.
Elite-Level Tip: Watch the Re-Test Behavior
When price breaks out, watch how it retests the broken level.
Is the retest clean and shallow? Or deep and chaotic? That reaction reveals everything:
- Clean retest = conviction.
- Messy retest = manipulation.
This micro-behavior around your support/resistance lines is the difference between a high-probability trade and a landmine.
Another Overlooked Edge? Liquidity Voids
Most traders only draw levels where the price has touched before.
But smart money often targets the liquidity voids and gaps between clustered price action.
These empty zones are where stop hunts occur and fake breakouts trap retail traders.
Anticipate these zones, and you’ll trade where institutions are active, not where retail traders hope.
Risk Management: Your Survival Kit

Forget strategies. Forget setups.
Without risk management, none of it matters.
Every consistently profitable trader you’ve ever heard of?
They mastered one thing first: not losing big.
Risk management isn’t about playing it safe; it’s about playing to stay in the game long enough to let your edge unfold.
Because even a flawless 4-hour breakout strategy will have losing streaks.
The difference is: pros plan for them. Amateurs panic and blow up.
Here’s what top-tier risk management looks like:
- Stop Loss is Non-Negotiable: If you’re trading without it, you’re not trading, you’re volunteering for liquidation.
- Position Size is Calculated, Not Felt: Use a position size calculator. Your exposure must be scaled to your risk per trade, not your confidence per setup.
- 1–2% Rule Is Gospel: That’s your max loss per trade, even if the setup is textbook perfect. Why? Because survival > conviction.
Elite Insight: Risk of Ruin Formula
Want to know how close you are to blowing your account?
Use the Risk of Ruin formula.
It calculates the mathematical probability that your trading account will hit zero based on your win rate and average reward-to-risk ratio.
Stop Loss Logic: Your Last Line of Defense
A stop-loss is like the line of integrity.
Placed correctly, it shows you’re trading with structure, not emotion.
Placed carelessly, it becomes either a leash that chokes your trades too early… or a trapdoor to catastrophic loss.
Here’s how to stop placing dumb stop-losses:
- Place It Outside the Breakout’s Failure Zone: Look beyond the candle. Identify where the breakout would truly be invalidated. That’s where your stop should sit and not inside noise or typical wick ranges.
- Let Market Structure Guide You: Use recent swing highs/lows, breakout box boundaries, or ATR (Average True Range) to calculate logical distance, not your personal comfort zone.
- Respect It Religiously: No dragging it wider. No removing it “just for this one trade.” The moment you violate your stop rules, you break the core of risk discipline, and that bleeds into every future trade.
Pro Tactic: Stop Placement = Trade Filter
Some setups look beautiful… until you try to place a reasonable stop.
If your valid SL sits 80 pips away, and the reward is 40 pips away.
A good trade must offer at least a 1:2 risk-reward.
A well-placed stop loss does two things:
- Defines your edge: You're only in the trade if the market behaves a specific way.
- Affirms your discipline: You're in control of the risk, not the outcome.
Breakout Strategy Examples
Let’s say EUR/USD has been ranging between 1.0830–1.0865.
Price closes a 4-hour candle above 1.0865, on high volume. RSI confirms, no major news events are pending, and structure supports the breakout.
That’s a trade. Enter on the candle closing, stop just below the resistance area, and target 1.0900 or higher based on previous structure.
Breakouts are clean. But only when they’re real.
That’s why context, market dynamics, session timing, and confirmation matter.
Advanced Trading Techniques and Metrics
Want to push the envelope?
Blend your 4-hour opening range breakout with:
- Position trading for longer-term bias.
- Scalping around breakout zones for fast profits.
- News filtering to avoid getting trapped in volatility spikes.
If you don’t track, you don’t grow.
Key performance indicators:
- Win rate
- Risk/reward ratio
- Expectancy
- Drawdown
The 4-hour breakout strategy often delivers higher accuracy and cleaner entries if you track it. Use journals. Study your own edge. Treat trading like a real business, not a side hustle.
The Unspoken Edge of Trading Psychology
You can have the best breakout strategy in the world, but if you can’t control your impulses, it means nothing.
- Don’t revenge trade.
- Don’t skip setups.
- Don’t override your system after one bad trade.
Practice mental resilience the same way you backtest your charts.
Because your mindset is the most profitable tool you own.
Conclusion: From Strategy to Consistency
The 4-hour candle breakout strategy isn’t just a setup.
It’s a system rooted in price action, built on key price levels, and confirmed by logic, not emotion.
To master it:
- Understand your charts.
- Obey your risk rules.
- Track your performance.
- Stay calm under pressure.
When those align, trading moves from chaotic to calculated.
From noise to clarity. From gambling to mastery.
And for traders who value structured execution, tools like the ACB Breakout Arrows Indicator can serve as a tactical companion, quietly validating breakout conditions and helping you execute with clarity, not second-guessing.
Take Your Trading to Next Level
Take Your Trading to Next Level
You Might Also Like:

