Ready to act? Get ACB Breakout Arrows Indicator Now
Trading with the Breakout Momentum Strategy: Step-by-Step Guide

Breakout trading isn’t about predicting the market; it’s about reacting to what price action is telling you in real time.
When price punches through a well-established level of support or resistance with momentum, it signals a shift.
That’s your window and the light at the end of the tunnel.
Breakout trading has been a fundamental and major part of any technical analyst's momentum breakout trading strategy.
It’s the moment a forex pair or the traded asset breaks free from the consolidation warzone and steps into an open territory, backed and supported by volume, momentum, and emotion.
What sets this apart from standard momentum trading?
Good question, it’s all about the trigger point.
While momentum traders look for acceleration and a hard adrenaline rush, breakout traders act when a barrier breaks.
Usually, a level where price has stalled or reversed in the past.
When that line gives way, especially with strong follow-through, it often marks the beginning of a significant move.
Just how effective can it be?
An opening-range breakout system shows win rates of 78%–89%, depending on timeframe, with average daily profits between $30–$51 per trade and a profit factor up to 1.59.
That’s not theory, that’s what’s possible with a structured, data-backed approach to breakout momentum.
When executed the right way, breakout strategies offer clean entries, manageable risk, and real upside. Whether you’re scalping short-term spikes or riding a wave on the 4H chart, mastering this approach is essential for any trader chasing an edge in volatile markets.
In this guide, we’ll break down not just how to spot breakouts, but how to confirm them with momentum and volume.
Because in today’s market, the right breakout momentum strategy filters the noise, avoids the traps, and gets you in when it matters to make money.
Momentum Breakout Trading Strategy
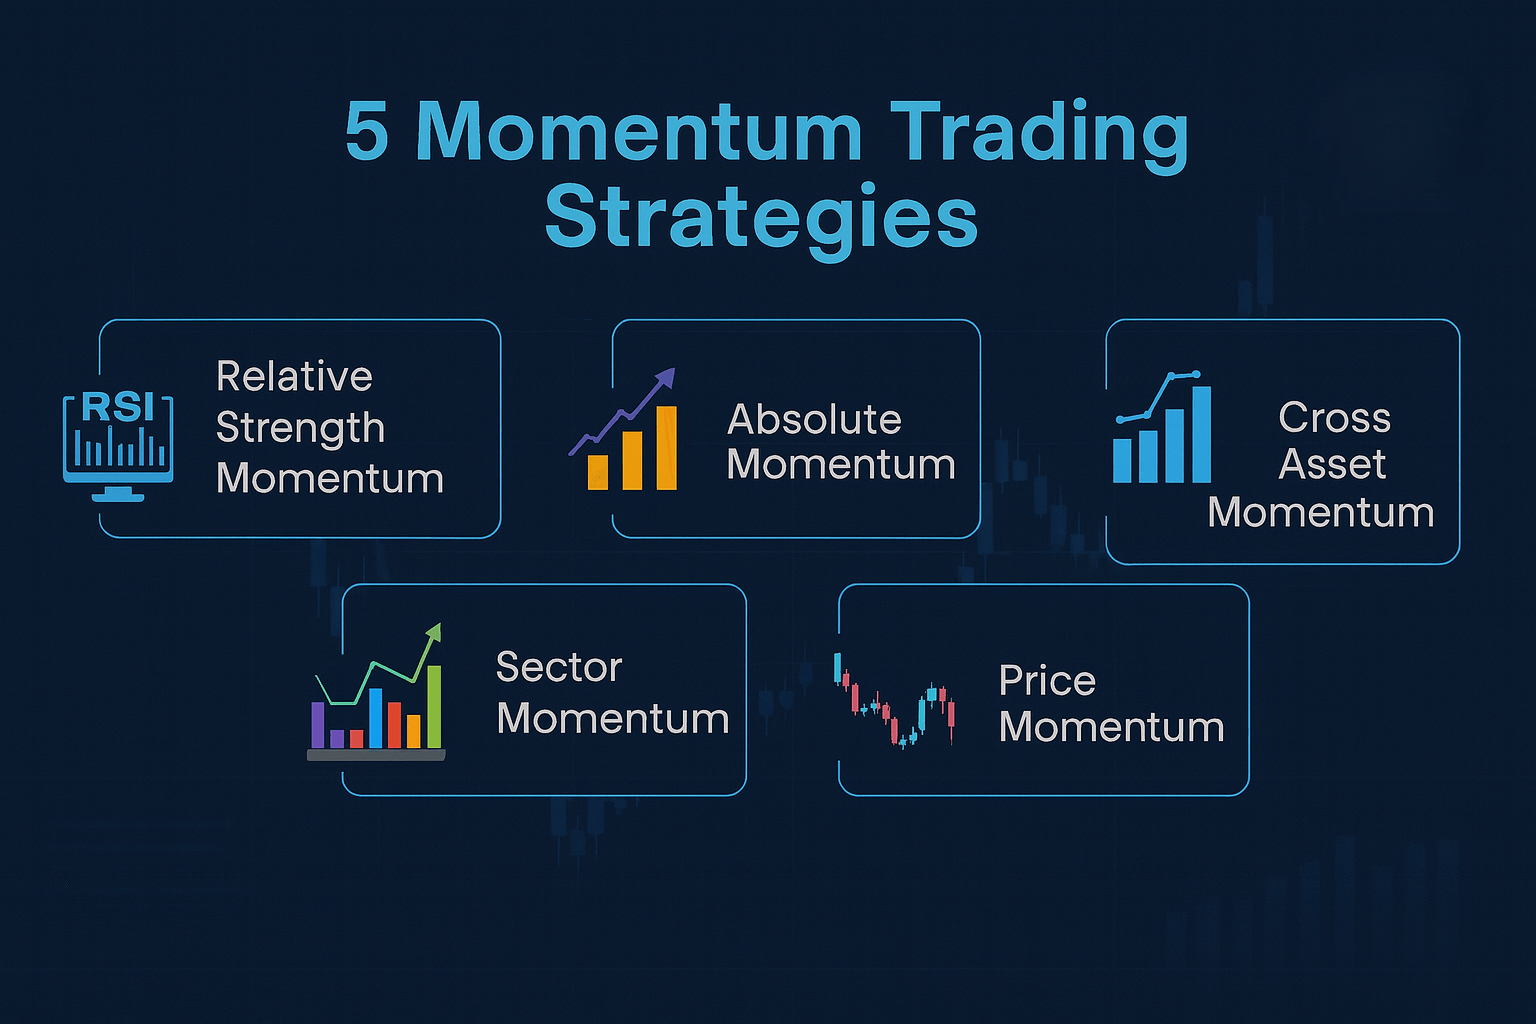
Some people don’t understand momentum; some think that momentum, as in motion alone, is enough, but momentum with actual structure is where the edge lives.
The momentum breakout trading strategy is built on this principle: find assets that aren’t just moving fast, but breaking free with conviction.
If you think about it outside the box, you are not trying to catch the pump; you are chasing the market psychological shift.
The moment a stock tears through resistance on rising volume, it signals that the crowd is no longer hesitating; they're committed, and they’re pushing on a preagreed price.
Here’s the anatomy of a powerful momentum breakout trade:
- Price surges through a clean level that’s been tested and rejected multiple times.
- Volume backs the move increasingly, think of it as the crowd stampeding through the door, not a few early runners.
- Momentum is building and hasn’t peaked yet. Confirm this with indicators like RSI, but also visually through candle structure and price velocity.
RSI isn’t just about “overbought” and “oversold.”
In breakout conditions, an RSI above 70 isn’t a sell signal; it's a dominance signal.
It tells you the buyers are in control and staying in control.
Similarly, when RSI climbs from a reset zone and breaks key thresholds, it’s often the start of the real move.
But there is a misunderstanding among traders that most get wrong; they see momentum and jump into the chaos right away.
That’s reckless and irresponsible trading; it’s like jumping into the sea the moment a tsunami hits.
A systematic momentum breakout strategy uses a clear forecast of rules to filter fakeouts from the real plays:
- Only trade breakouts that occur in alignment with the broader trend. For example, if the price has been dropping across London, Asia, and New York sessions, and you see an unusual price increase that’s ready to break out on the Sydney session, stay away.
- Volume must expand into the breakout; no volume, no trade. The breakout is the rocket ready to launch, and the volume is its fuel.
- Define your risk before you enter. Know your stop. Know your size. No exceptions. Don’t set sail without a map, a lifeboat, and a limit to how far you’ll go; you’re not Columbus.
What sets elite traders apart is that they treat momentum like an opportunity. They wait for alignment: price, structure, and energy. Only then do they strike.
In the next section, we’ll talk about how to combine breakout triggers with smart setups and how volume is the silent confirmation most traders ignore until it’s too late.
Breakout Trading Strategies Explained

Breakout trading is combat.
You stalk key support and resistance levels like a sniper tracking a border.
When price invades with conviction, hesitation is the enemy.
It's about catching the precise moment when order flow erupts, liquidity vanishes, and momentum ignites.
You’re reacting to structural violations with discipline and speed.
Elite breakout traders hunt liquidity via complex computing-powered trading tools.
They study where retail traders stack their stop-losses, because that’s where the institutions strike.
Equal highs or lows? Double tops and bottoms?
That’s bait, designed to trap amateurs.
Watch for wick traps, fake breakouts that snap back, only to reverse again with a violent engulfing candle.
That’s the kill signal.
And when price breaks out of consolidation after a high-impact news release, it’s no longer technical but full-on chaos.
Chart patterns are psychological maps.
An ascending triangle?
It’s a coiled spring waiting to detonate.
A bull flag?
Controlled pullback under pressure, primed for vertical liftoff.
But none of these patterns means anything if the breakout isn’t backed by volume, intent, and confirmation.
The battlefield favors two environments.
In trending markets, breakouts are momentum-driven.
You ride the force that breaks the wall and don’t look back. Example: Tesla in 2020, or Bitcoin surging past 87,000.
In range-bound markets, you’re watching for trap breakouts, moments when price plays dead, lullabies the traders into complacency, and then detonates into life.
Use volume spikes as your litmus test: no fuel, no fire. Watch for VWAP breaks and retest its the institutional line in the sand.
Use ADX above 25 to confirm trend strength; weak trends lead to fakeouts.
And when the TTM Squeeze fires after volatility contraction?
Confusion is over, big players have decided.
Avoiding False Breakouts
False breakouts occur when the price temporarily moves beyond a key level and quickly reverses.
To avoid them, you need confirmation.
Volume should increase sharply on the breakout; if it doesn’t, stay out.
Low-volume moves often lack commitment and are more likely to reverse.
Breakout candles should close cleanly beyond the level. Long wicks or hesitation candles near the breakout zone are dangerous, and we don’t advise trading them.
If price breaks and immediately returns to the range, it’s a trap.
Always check higher timeframes.
A breakout on the 5-minute chart means nothing if the 1-hour is in consolidation.
Multi-timeframe alignment reduces noise and confirms trend integrity.
Avoid trading into known high-impact news events unless it’s part of the setup.
Post-news breakouts with follow-through and volume are stronger and more reliable.
Only act on breakouts that meet strict criteria: aligned trend, clean structure, volume confirmation.
If any of these are missing, step aside.
Entry and Exit Points
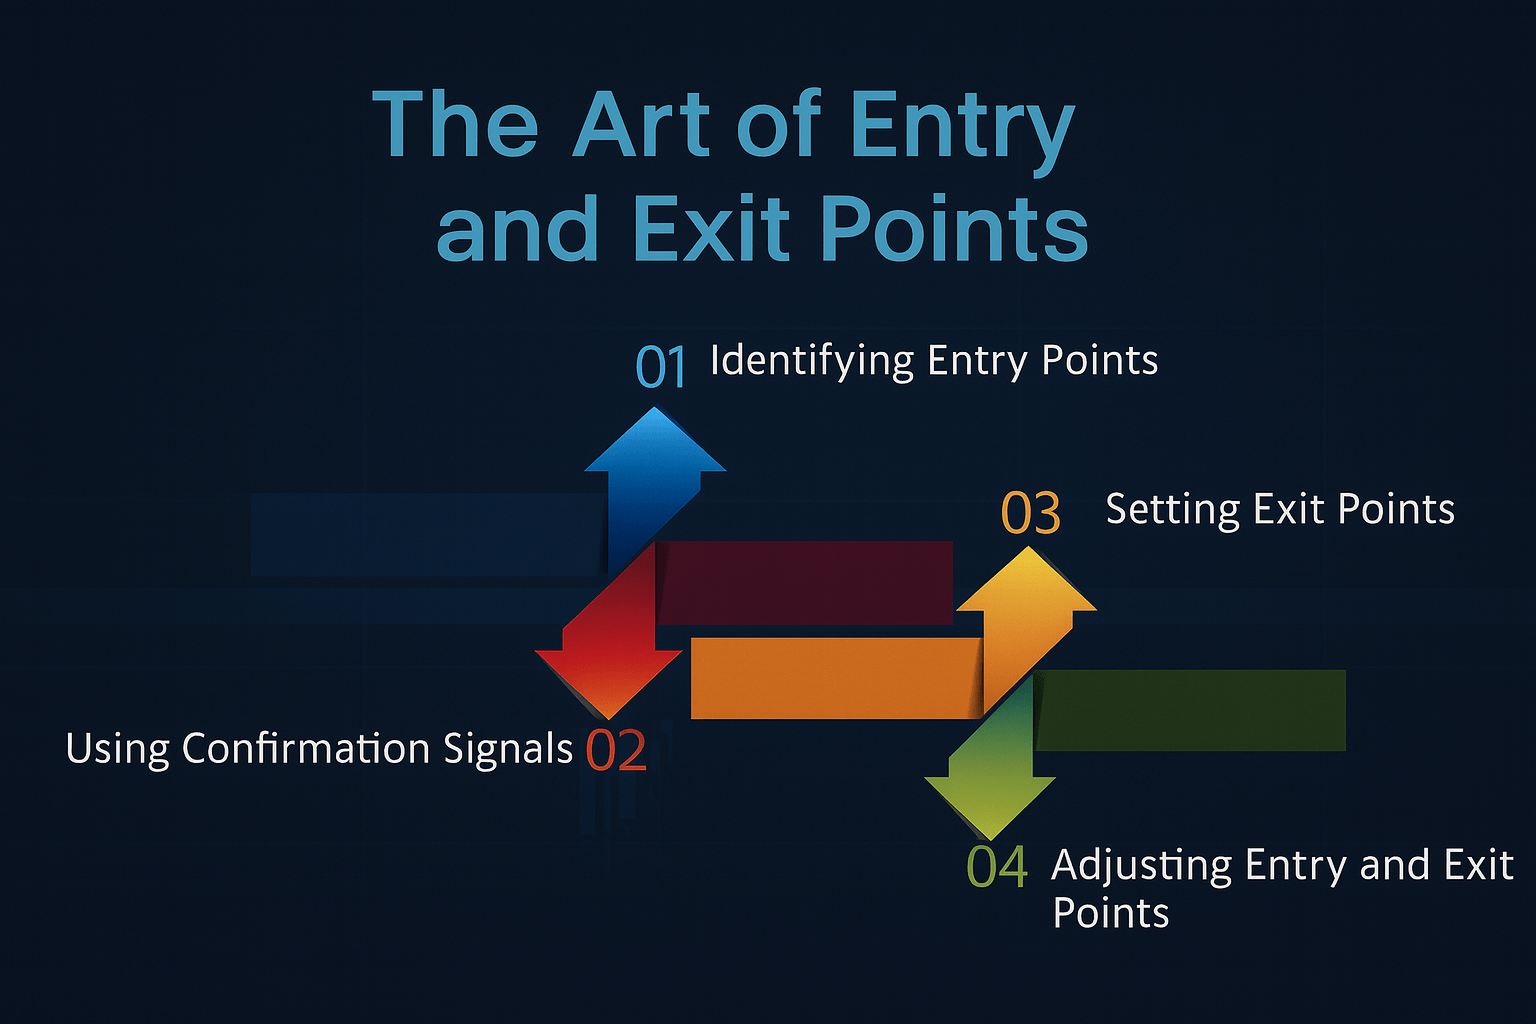
Entries must be rule-based. Wait for a confirmed break of structure with a candle close beyond the level.
Place entries slightly above resistance or below support, not inside the zone.
Use limit or stop orders
Never go into the market based on emotion
Stop-loss placement depends on the structure.
Use the last swing low (for longs) or swing high (for shorts).
Position size must be calculated around that stop to control risk exposure.
Profit targets should be based on measured moves or volatility-based ranges.
If price approaches a key resistance/support or volume profile edge, manage the position proactively.
Do not hold breakouts blindly, or go into a breakout and rush to the club to party.
Monitor continuation strength.
If momentum fades or price stalls near expected targets, reduce size or exit.
Every entry must have a defined exit plan before execution.
Trading Psychology and Momentum in Forex Pairs
In forex, breakout trading is a precision game.
Currency pairs behave differently from equities.
Macroeconomic flows, interbank liquidity, and institutional positioning drive them.
During momentum phases, they become high-speed vehicles for traders who understand not just the technical structure, but the psychology behind the move.
What Happens During a Momentum Breakout in Forex?
When a major pair like EUR/USD breaks a significant resistance, it's often the result of:
- Institutional order blocks are being triggered.
- Cross-market arbitrage (e.g., divergence with DXY or related pairs like USD/CHF).
- Macro data (NFP, CPI, central bank decisions) are causing re-pricing of rate expectations.
This creates high-velocity movement, especially during overlapping sessions (London/New York) when liquidity and volume peak. Real data shows:
- GBP/USD average breakout range post-London open: 40–70 pips within the first 90 minutes.
- EUR/USD 15M ORB (Opening Range Breakout): 63% continuation success rate when confirmed by volume and DXY divergence.
- USD/JPY post-FOMC breakout moves: average 80–120 pips within 2 hours on strong directional bias days.
During these breakouts, spreads can temporarily widen, slippage increases, and price snaps past key levels in seconds, often gapping through retail stop clusters.
Behavioral Edge Through Structure
Elite FX traders don’t chase. They mark their levels pre-session, define triggers, and only act when criteria are met:
- Confirmed candle body close beyond structure, not wick violation.
- Volume confirmation via tick volume or broker data (e.g., MT4/MT5 broker-provided feed).
- Confluence with trend direction on higher timeframes (H1, H4).
FX Breakout Behavior by Pair (Based on Backtest Data: 2021–2024)
Pair | Breakout Window | Avg. Range After Break | Retest % | Continuation Probability | Notes |
|---|---|---|---|---|---|
EUR/USD | London open (08:00 GMT) | 50–70 pips | 76% | 62% | Reacts to ECB/US data divergence |
GBP/JPY | NY-London Overlap | 80–100 pips | 58% | 67% | High volatility, strong trend extension |
USD/CHF | Post-NY open | 30–45 pips | 64% | 55% | Reacts inversely to risk-on sentiment |
AUD/USD | Asian Session | 25–40 pips | 71% | 61% | Strong correlation to Commodities/China |
These patterns show that each pair has its rhythm.
Trading psychology becomes dangerous when you treat every breakout the same.
Adjust your mindset and execution style based on the pair’s personality, session dynamics, and event context.
Breakout Trading Tools and Resources
Breakout trading demands more than intuition and a sharp eye; some steps are extremely difficult for a group of people.
It requires sharp tools that offer clarity, speed, and confidence in volatile environments.
From technical indicators and volume overlays to multi-timeframe scanners and execution platforms, the right tools make the difference between catching a move early and chasing after it's gone.
Effective breakout strategies rely on indicators that can identify pressure zone areas where price coils before an explosive move.
Tools that detect momentum buildup, plot actionable support/resistance zones, and confirm volume surges are key.
Traders working on lower timeframes, in particular, benefit from optimized algorithms that cut through market noise and highlight clean breakout conditions.
One such tool is the ACB Breakout Arrows Indicator, a non-repainting breakout system for MT4/MT5 that scans for breakout patterns across forex pairs.
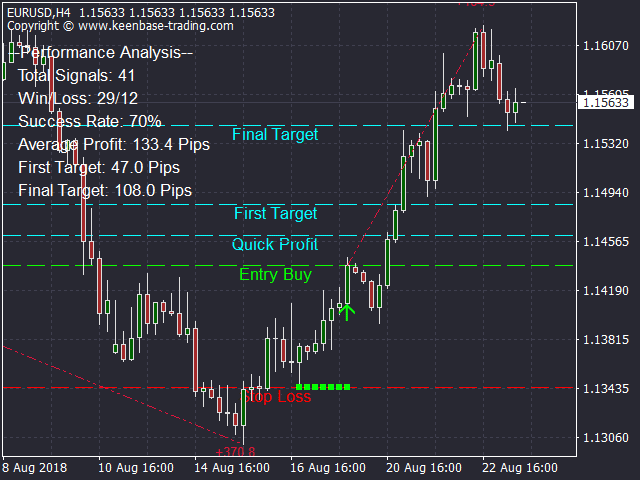
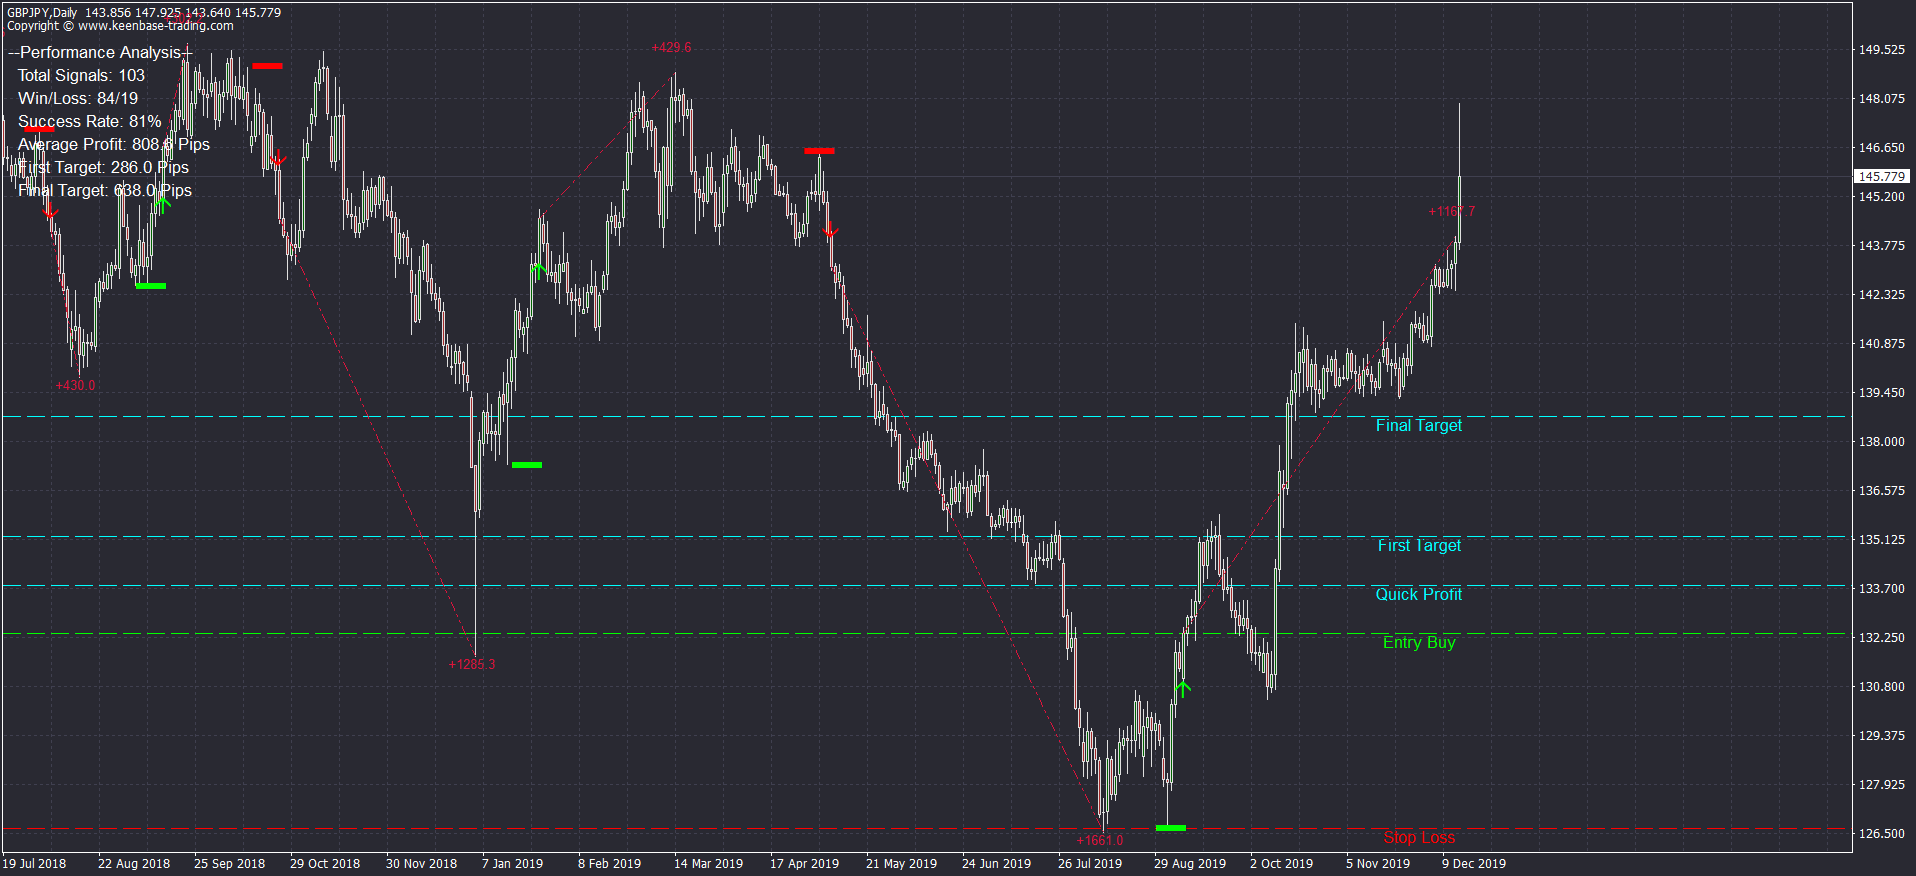
It comes equipped with automatic stop-loss and take-profit levels, a quick profit zone for scalping, and built-in performance tracking metrics.
Designed for all sorts of traders, it functions as a breakout box indicator with added signal intelligence, particularly effective below the one-hour mark.
Traders using a multi-timeframe approach can also benefit from scanners that monitor multiple charts simultaneously, allowing faster decision-making and signal confirmation across correlated pairs.
When paired with disciplined execution and strong risk management, these tools turn breakout setups into repeatable, trackable opportunities.
The goal isn’t to rely on tools blindly; it's to use them as part of a structured process.
When the chart aligns with the data, and your system confirms the move, that’s when precision becomes profit.
Breakout Trading Tips and Best Practices
Below are tips that are rarely discussed online, yet define high-performance breakout trading.
1. Don’t enter the breakout: enter the failure of the retest failure
Everyone wants to buy the breakout.
Smart traders wait for the retest of the breakout zone, but elite traders go one layer deeper: they wait for the retest to fail, and then enter on the confirmation of the second rejection.
This filters out low-conviction breakouts and avoids getting caught in liquidity sweeps.
Entry trigger = failed retest → rejection candle → break of that candle’s low/high
2. Use time-based filters
Price breaking a level isn’t enough.
Time at level matters. If the price hangs too long near a breakout zone without committing, the breakout is weakening.
A breakout that holds above resistance for more than 12–15 minutes on the 5M chart without expanding is suspect.
3. Anchor your breakout zones to liquidity events — not just chart structure
Most traders draw breakout zones on swing highs/lows.
That’s surface-level.
Real breakout zones are where liquidity is taken to look for candle bodies that close through high-volume nodes, or stop hunt wicks that never got reclaimed.
4. Kill the trade fast if it pauses — breakouts that hesitate often reverse
The longer a breakout stalls after triggering, the more likely it's a trap.
If price breaks, pulls back, and then stalls near your entry without progression, exit quickly or reduce size. Don’t “hope.”
You’re trading momentum; it either moves or it's invalid.
5. Structure your sizing around probability tiers
Not every breakout deserves full size. Categorize your trades:
- A+ setups: All confluences aligned: max size (Based on your avg. trade size).
- B setups: Clean level, decent volume: 50% size.
- C setups: Looks good, but lacks alignment: skip or take micro size.
Sizing based on confidence and conditions keeps drawdowns shallow and conviction high.
Conclusion: Precision Over Prediction
Breakout trading isn't for gamblers or guessers; it's for executors.
You’ve now seen that success doesn’t come from chasing charts or copying flashy setups.
It comes from discipline, data, and system-level thinking.
If you want cleaner entries, controlled exits, and a breakout system you can trust, you need to operate like a technician, not a tourist.
Breakouts will continue to be one of the most explosive setups in any market: forex, crypto, or equities.
But they only work for those who respect the conditions that make them real.
So as you move forward:
- Build your trading system.
- Use indicators that support it (like the ACB indicator).
- Backtest, log, and refine.
- Act only when price and probability align.
Master the process. Trade with intention. And when the breakout comes, be the ready one.
Take Your Trading to Next Level
Take Your Trading to Next Level
You Might Also Like:

