
MSNR Trading Strategy: Exact Malaysian SnR Entry Rules, With a Printable Playbook (PDF)
Every MSNR video shows the levels. Few of them answer the question a trader has a minute later: which of these levels do I trade, and when exactly do I press buy?
Here is the short answer. Trade only a fresh level in the direction the higher timeframes agree on, and enter only when the lower timeframe confirms the reaction, never at the touch itself.
MSNR stands for Malaysian Support and Resistance. MSNR is easy to mark and hard to trade, because the method gives you many levels and few rules about which one matters.
Below are the complete rules for one MSNR routine on MetaTrader 4 (MT4) and MetaTrader 5 (MT5), from the direction to the exit, with real chart examples. There is also a printable MSNR Trading Playbook (PDF) to keep beside your screen.
What MSNR Levels Are
Classic support and resistance is drawn through wicks and turning points. MSNR draws its levels at candle closes instead, where one candle colour changes to the other. If you have used classic support and resistance strategies, this is the main difference.
A level and V level
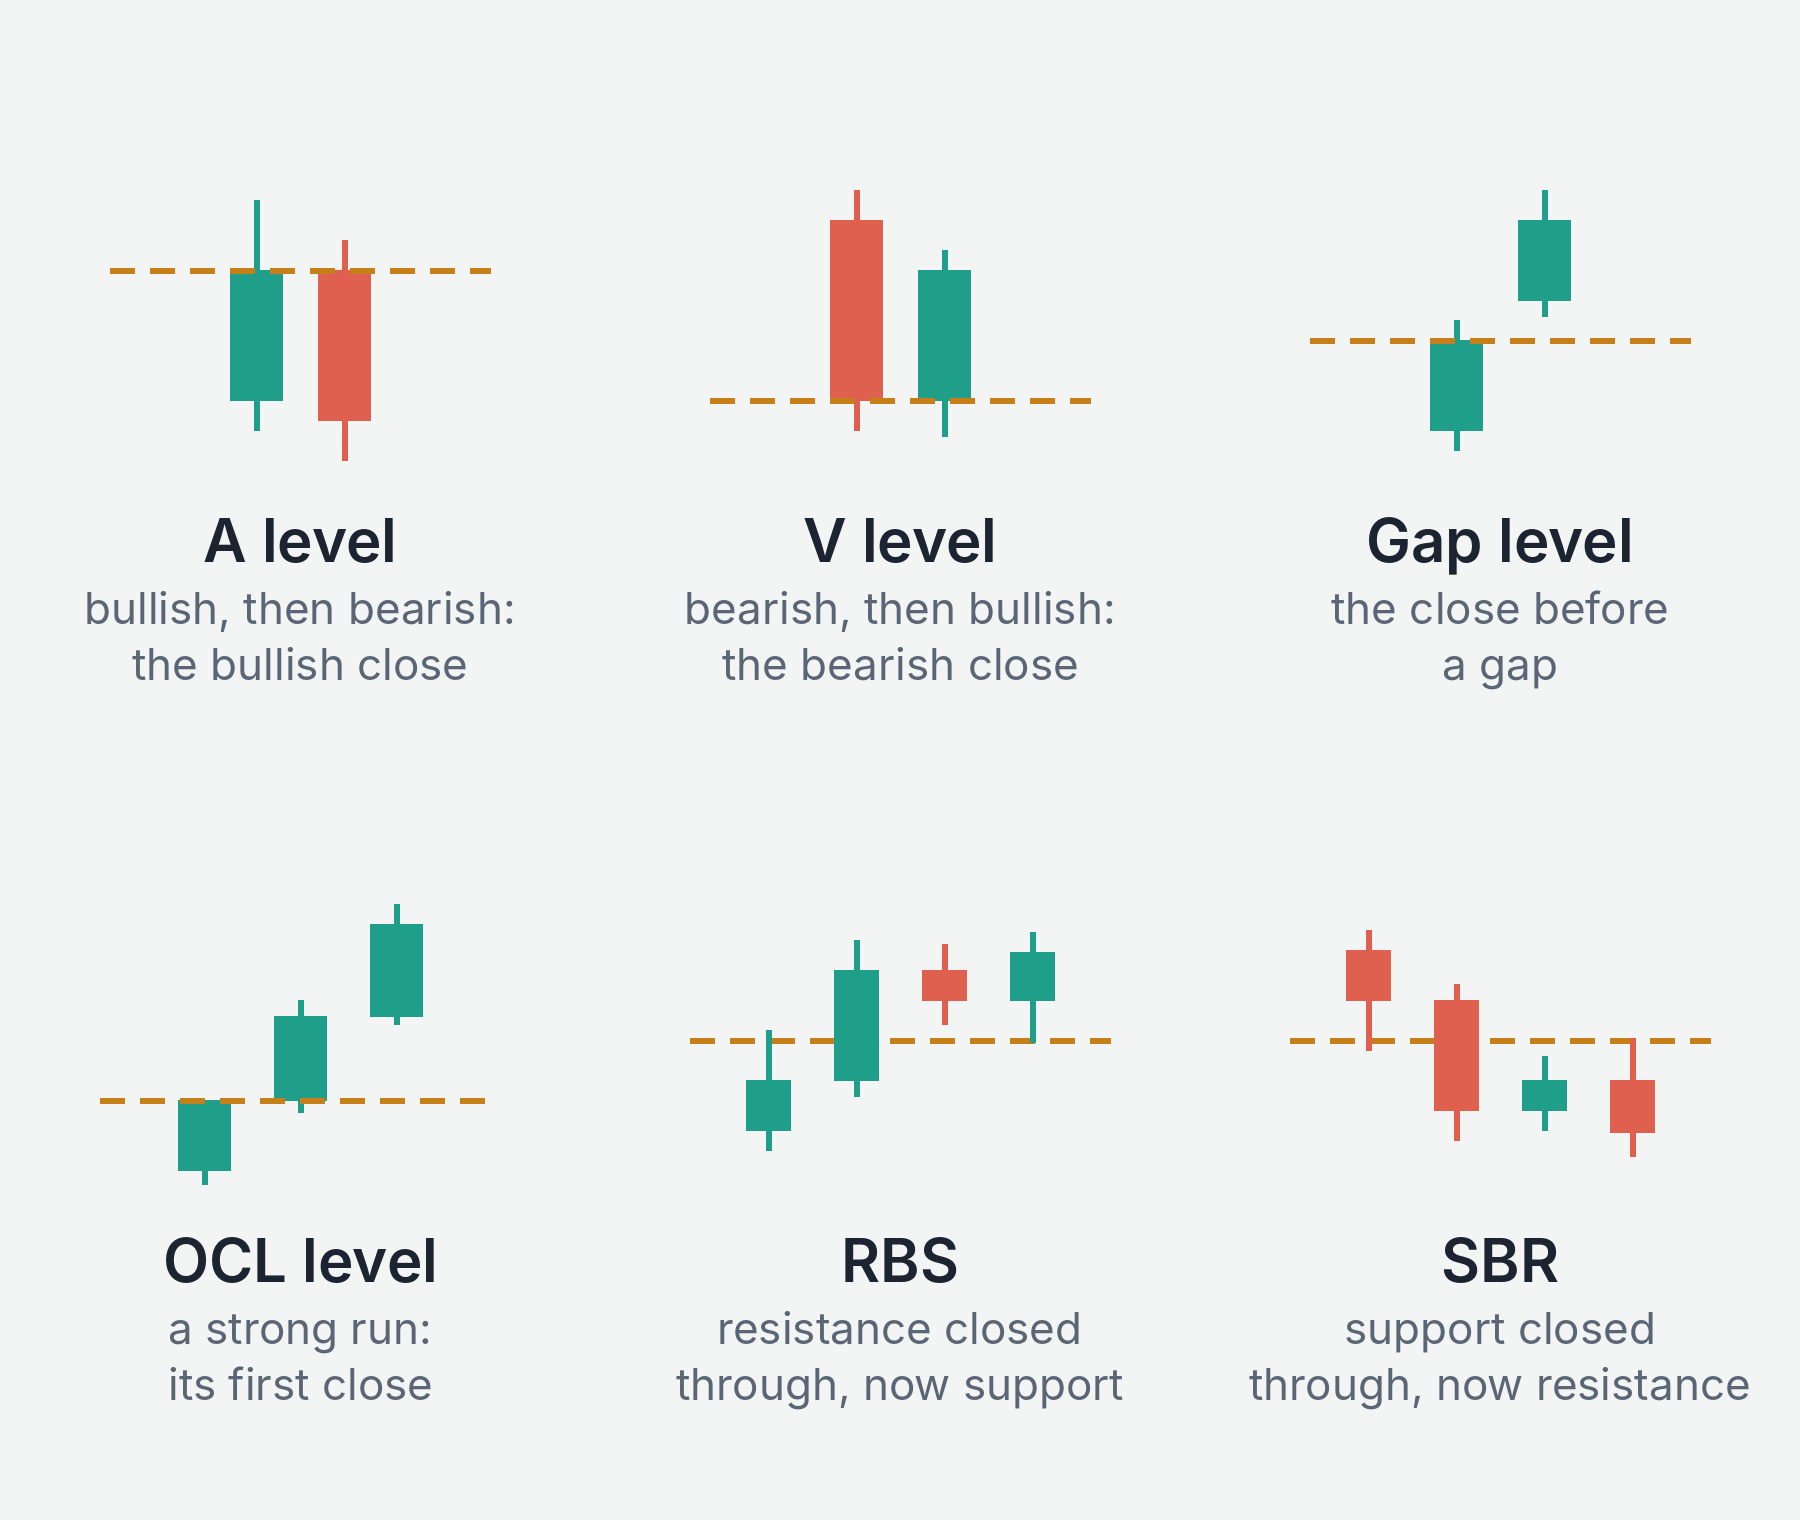
- A level: a bullish candle followed by a bearish candle. The level sits at the close of the bullish candle. The two candles look like the top of the letter A, so an A level is a resistance.
- V level: a bearish candle followed by a bullish candle. The level sits at the close of the bearish candle. The two candles look like the bottom of the letter V, so a V level is a support.
Gap level and OCL level
- Gap level: when a candle opens away from the previous candle’s close, that previous close becomes a level.
- OCL level (open close level): when a run of candles of the same colour makes a strong move, the close of the first candle in the run becomes a level.
Fresh and unfresh
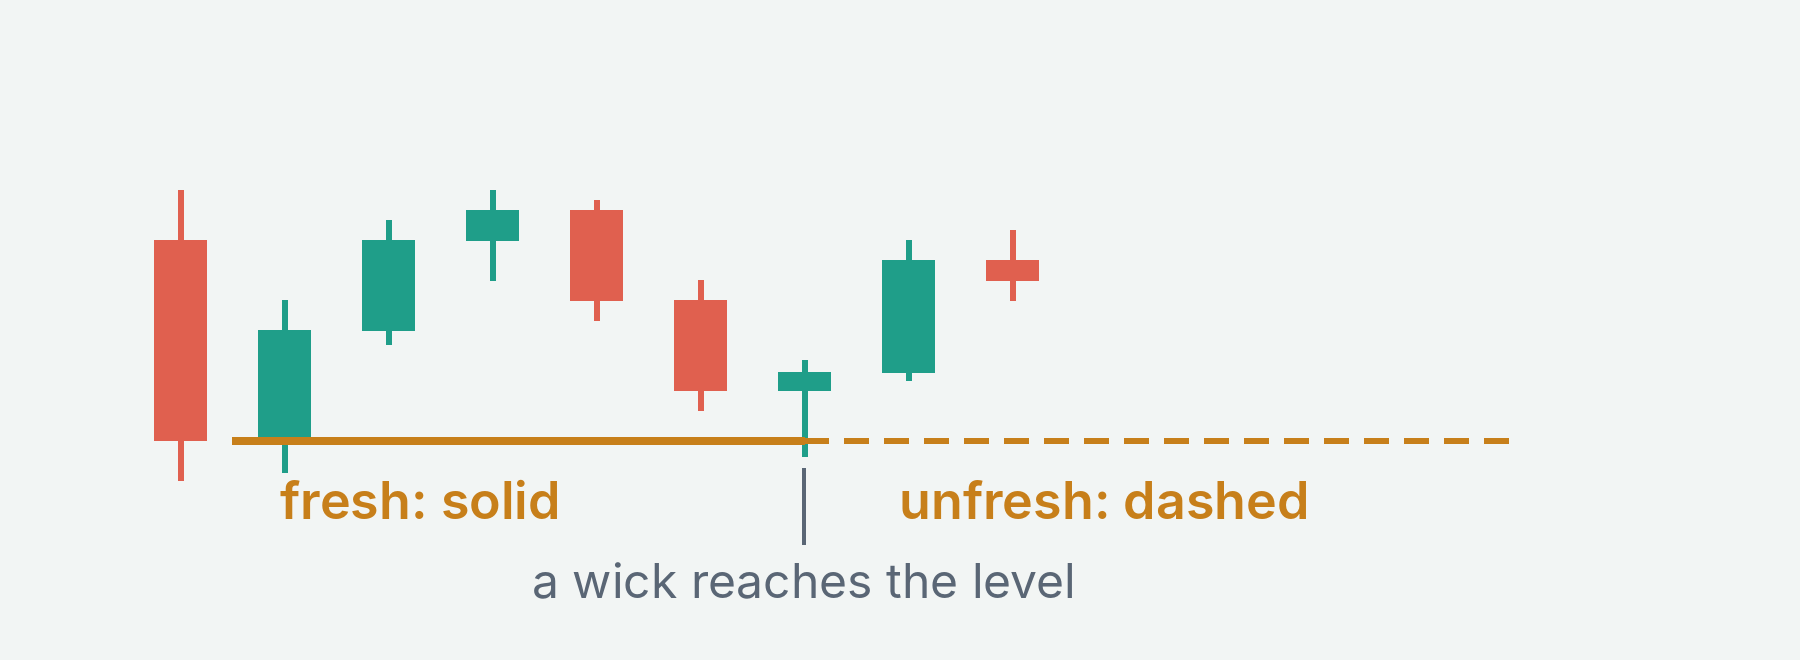
A level is fresh from the moment it forms until a wick reaches it. After that it is unfresh. A fresh level is one that price has not come back to since it formed, so a reaction there is the first reaction the level has had.
RBS and SBR
When a candle closes through a level, the level changes its role and counts as fresh again:
- RBS (resistance becomes support): a resistance level that price has closed above.
- SBR (support becomes resistance): a support level that price has closed below.
KT MSNR Indicator draws all of these levels from the D1, H4 and H1 timeframes. It keeps each level solid while it is fresh and dashed once a wick touches it, and relabels it RBS or SBR after a close through. It also shows the storyline, described next.
The Storyline: Which Way the Market Is Leaning
In MSNR, the storyline is the direction of the market on a pair of timeframes. A higher timeframe candle reacts at a fresh level, and the lower timeframe candles confirm that reaction. The storyline then points in the direction of the reaction until another reaction turns it.
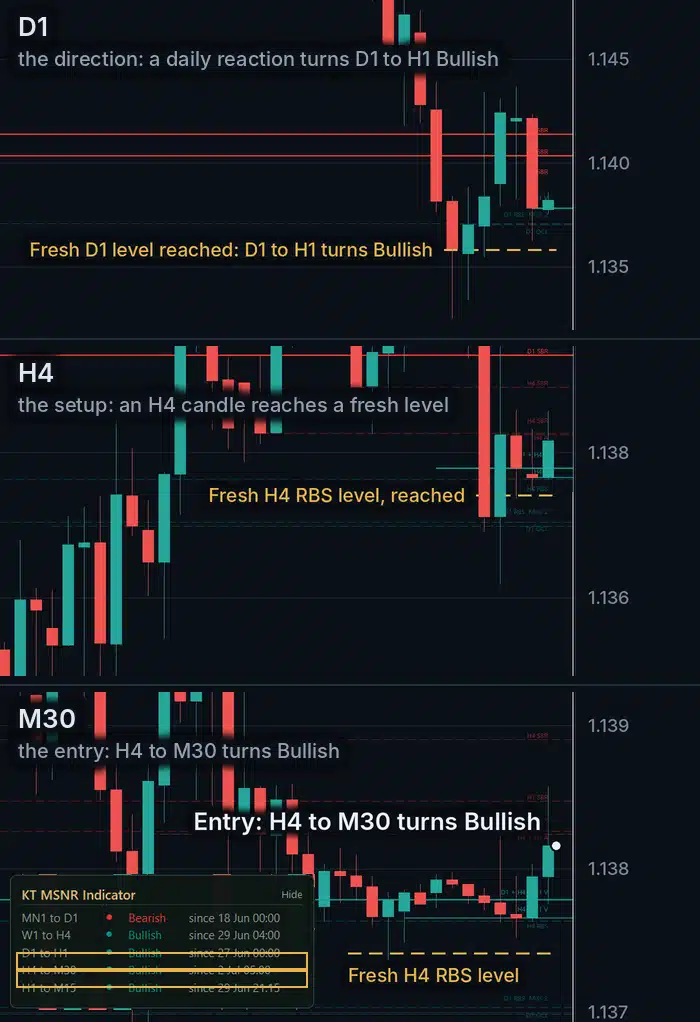
KT MSNR Indicator shows the storyline as a panel of five rows, from the slowest to the fastest: MN1 to D1, W1 to H4, D1 to H1, H4 to M30 and H1 to M15. Each row reads Bullish, Bearish or No trend, with the time it last turned. The panel is enlarged in the M30 part of the first chart on this page.
This routine uses two of the five rows:
- The D1 to H1 row gives the direction: it moves slowly. It changes only when a daily candle has reacted at a fresh daily level and the hourly candles have confirmed that reaction.
- The H4 to M30 row gives the entry: when it turns to the same direction as the D1 to H1 row, a 4 hour candle has just reacted at a fresh H4 level and the 30 minute candles have confirmed the reaction. That turn is the trade.
The slower row keeps you on the side of the bigger reaction. The faster row tells you when a smaller reaction in that same direction has actually started, instead of when price merely touched a line.
The MSNR Storyline Entry, Step by Step
These rules use an M30 chart with KT MSNR Indicator on its default settings: levels from D1, H4 and H1, and the storyline panel switched on.
If neither the target nor the stop loss is reached within 200 M30 candles, which is about four trading days, close the trade. The reaction the trade was built on has run out of time.
Where the Stop Loss Goes
For a buy, the stop loss goes below the lowest point price reached on M30 between the first touch of the level and the entry. For a sell, it goes above the highest point. Add one tenth of the M30 ATR(14) as an extra distance.
ATR(14), the Average True Range over 14 candles, is a standard MetaTrader indicator that shows how far price usually moves in one candle. The extra distance keeps the stop loss just outside the normal movement around that low or high.
The stop loss goes there, and not at the level itself, because price has already traded at and around the level. The low of that reaction, for a buy, is the price the setup says should not be reached again, so it is where the setup is shown to be wrong.
This makes the stop loss different on every trade. Size the position from the stop loss: choose the lot size so that a stop loss hit loses the fixed amount of money you have decided to risk on one trade.
Where the Target Goes, and Why 1.5
The target is the nearest fresh level beyond the entry: the nearest solid H4 level above the entry for a buy, or below the entry for a sell. If no fresh H4 level is drawn in that direction, use the nearest fresh D1 or H1 level.
That level is where the next reaction is likely to start, so it is where the trade has done its job.
Then compare the two distances, the idea behind the reward to risk ratio. If the target is less than 1.5 times as far from the entry as the stop loss, skip the trade.
Here is why 1.5 matters. A trade that can win 1.5 times what it risks breaks even, over many trades, when it reaches its target 40 times in 100. That figure comes from dividing 1 by 2.5, which is 1.5 plus 1.
A trade that can only win 0.7 times what it risks needs to reach its target about 59 times in 100. The closer the target sits, the more often the trade must work just to break even.
Spread, commission and swap are not included in those figures. They raise the share of trades that must reach the target, and they weigh more when the stop loss is small, as it often is on M30.
One Trade, From the Storyline to the Exit
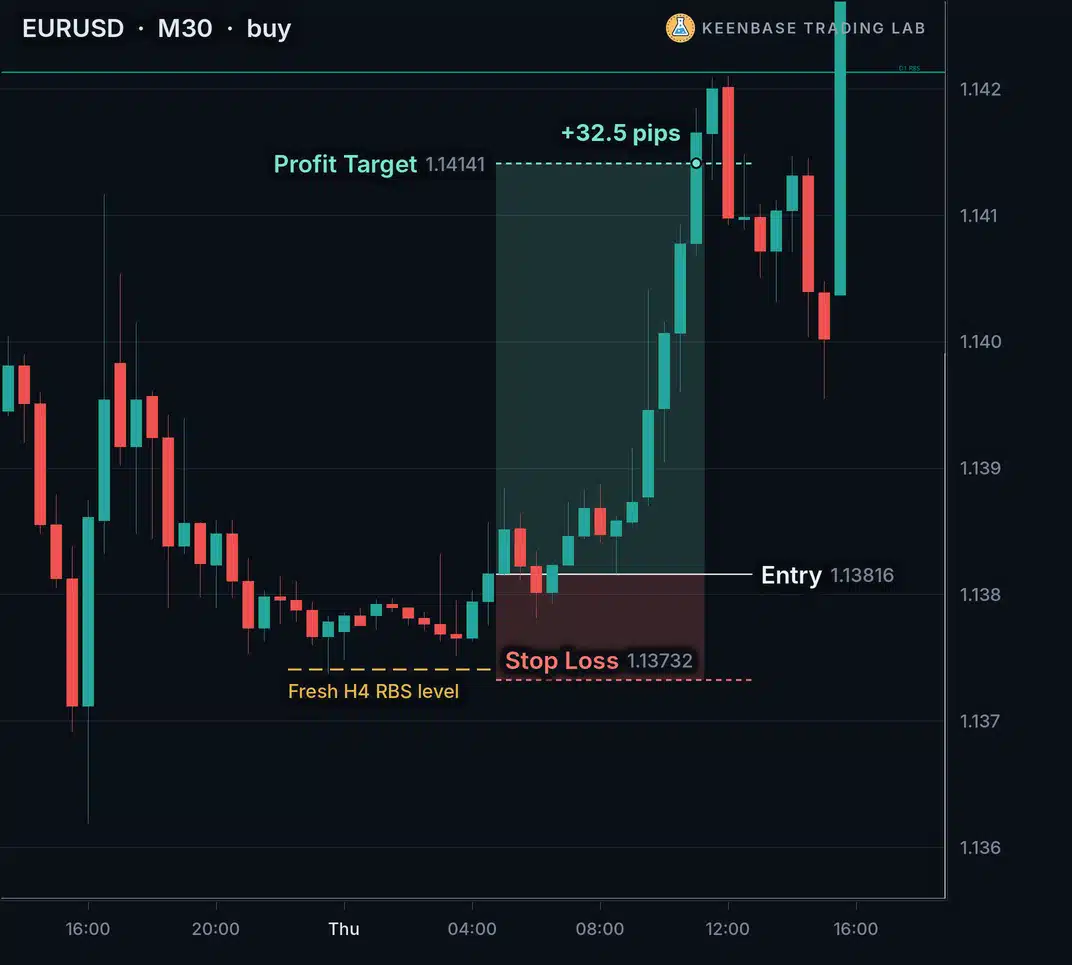
Here is the EURUSD buy from the first chart, step by step. On EURUSD, one pip is a price move of 0.0001.
The direction: on the daily chart, a D1 candle had reacted at a fresh D1 level, and the hourly candles had confirmed it. The D1 to H1 row read Bullish, so the routine looked only for buys.
The fresh level: earlier that day, a 4 hour candle closed above an H4 resistance level at 1.13741. That level became an RBS, a support that counted as fresh again. The next H4 candle came down to it: its low reached 1.13736, half a pip below the level, and it closed at 1.13778, back above the level. The level held on a closing basis.
The turn: for about five hours, the M30 candles moved just above the level. Then one M30 candle turned the H4 to M30 row Bullish. That candle closed at 1.13816, which was the entry.
The stop loss: the lowest M30 low since the first touch was 1.13736. One tenth of the M30 ATR(14) was less than half a pip, so the stop loss went to 1.13732, 8.4 pips below the entry.
The target: the nearest fresh H4 level above the entry was 1.14141, 32.5 pips away. 32.5 divided by 8.4 is 3.9, well above 1.5, so the trade qualified.
The outcome: price reached 1.14141 about six hours after the entry.
Three More Trades, and One That Failed
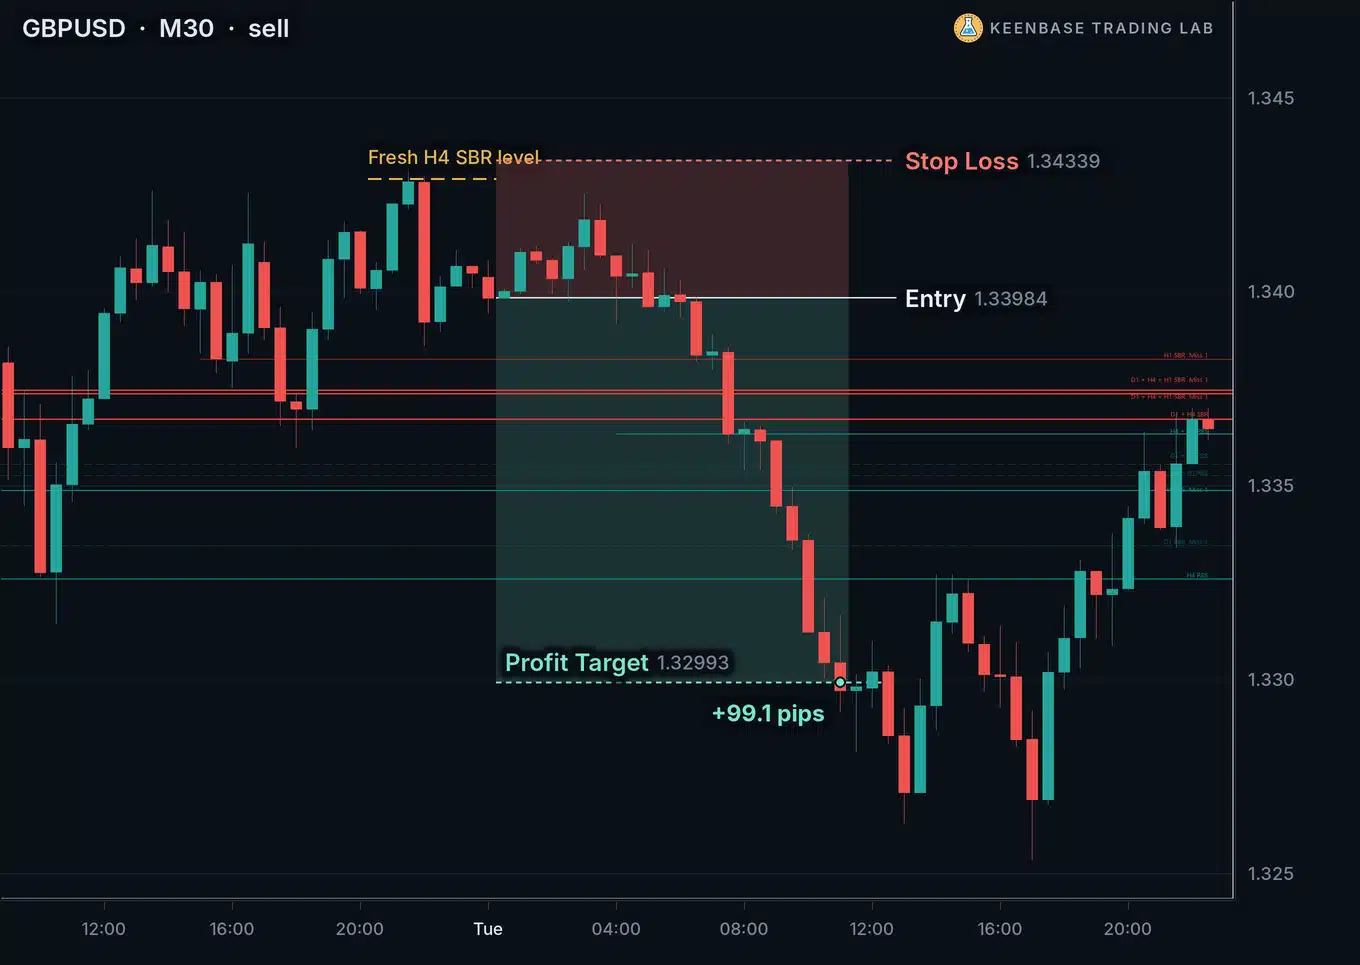
GBPUSD, a sell: the D1 to H1 row read Bearish. An H4 candle came up to a fresh SBR level at 1.34291, a support that price had closed below, and did not close above it. When the H4 to M30 row turned Bearish, the entry was 1.33984.
The stop loss sat 35.5 pips above the entry and the target 99.1 pips below it, so the target was 2.8 times the stop loss distance. These are the same rules as a buy, turned upside down.
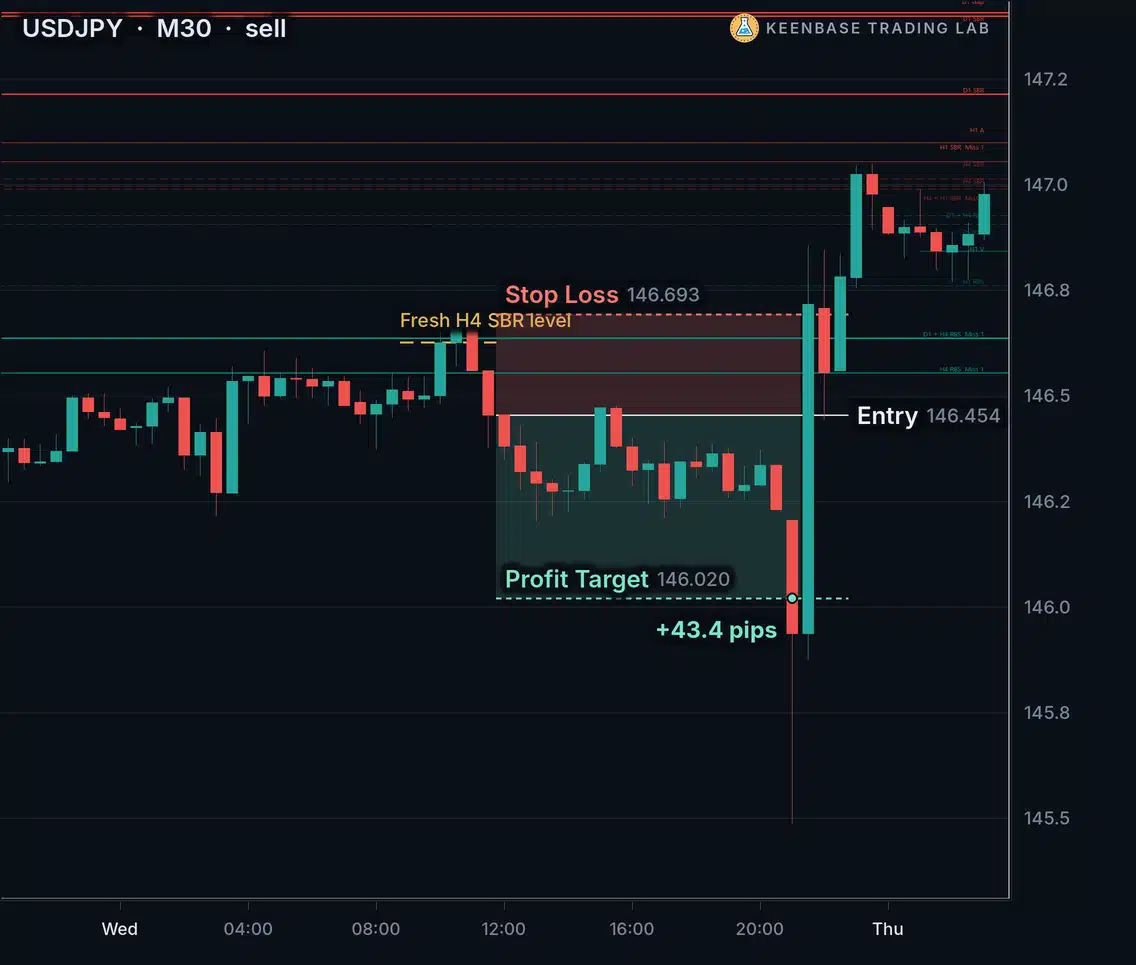
USDJPY, a sell: on USDJPY one pip is a price move of 0.01. The fresh level was an SBR at 146.627. The stop loss sat 23.9 pips above the entry at 146.454, and the target 43.4 pips below it, a ratio of 1.8. The target was reached on one fast candle, and the stop loss was never moved.
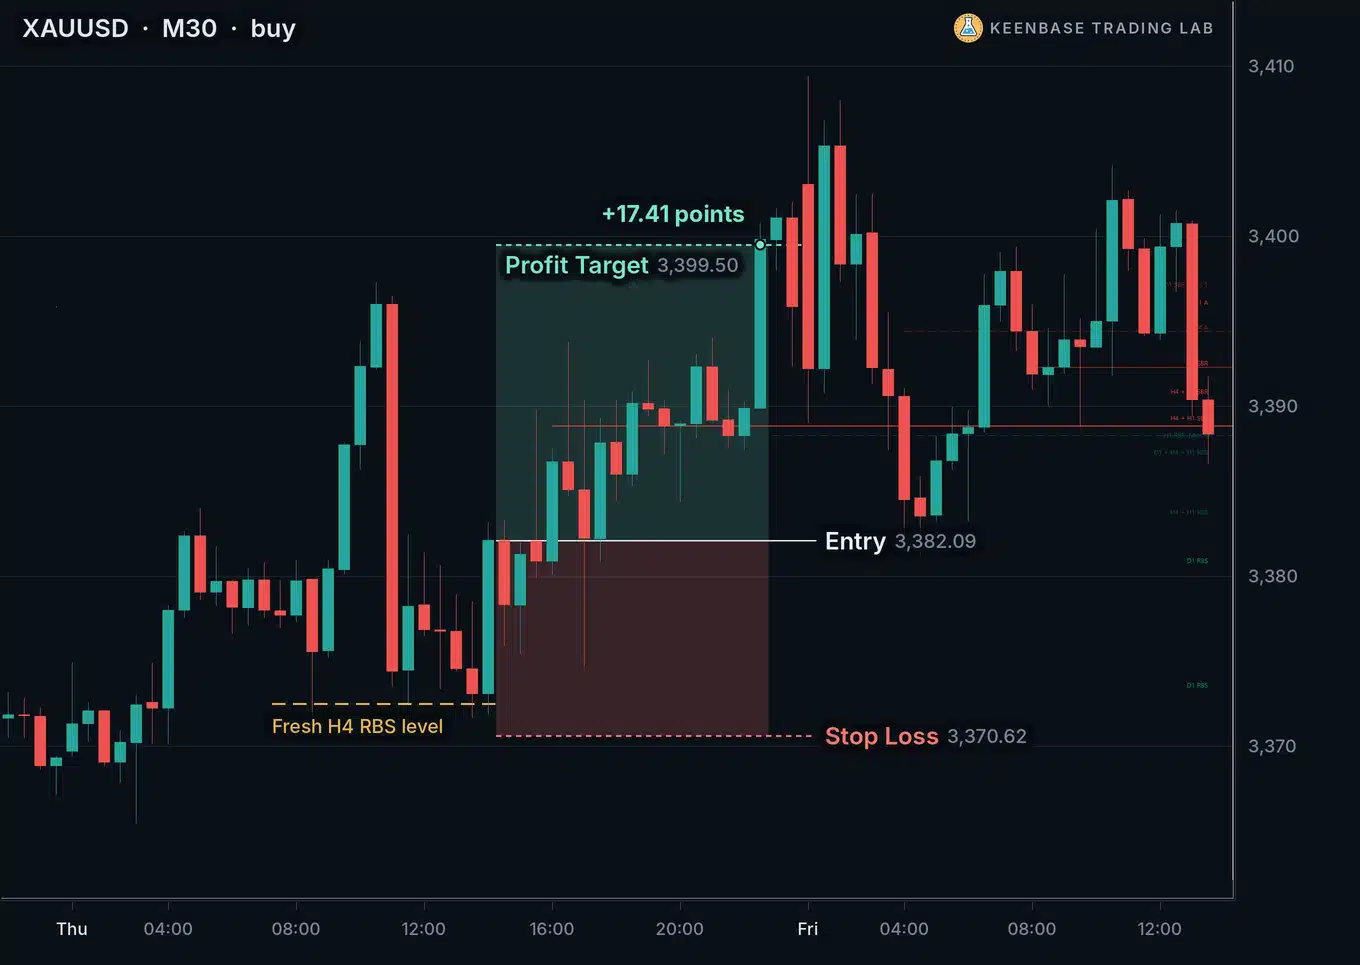
Gold (XAUUSD), a buy: on gold, one point is a price move of 1.00. The fresh level was an RBS at 3,372.49.
The stop loss sat 11.47 points below the entry at 3,382.09, and the target 17.41 points above it. That is a ratio of 1.52, just over the 1.5 minimum, so the trade qualified with almost no room to spare. The target was reached the same day.
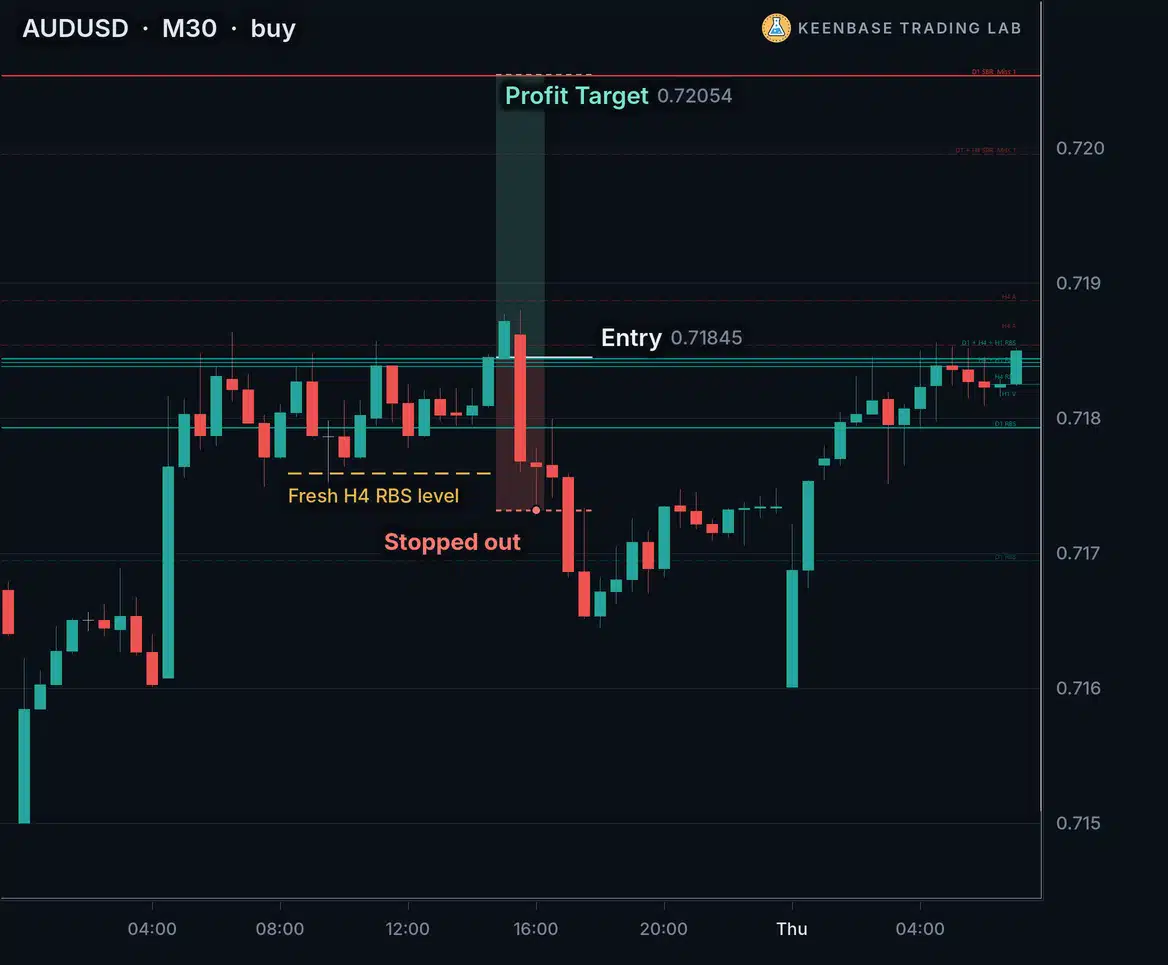
AUDUSD, a buy that failed: the D1 to H1 row read Bullish. An H4 candle reached a fresh RBS level at 0.71759 and closed back above it, and the H4 to M30 row turned Bullish at 0.71845. The stop loss was 11.3 pips below the entry and the target 20.9 pips above it, a ratio of 1.85. Every rule was met.
Price fell through the stop loss within about an hour.
A setup that meets every rule still loses the full stop loss distance when it fails. That is why the 1.5 check matters, and why every trade risks the same fixed amount.
Mistakes That Turn MSNR Into Guesswork
- Trading against the storyline: a V level under price looks like a buy whatever the higher timeframes say. In this routine, a buy against a Bearish D1 to H1 row is not a trade.
- Buying the touch: price reaching a fresh level is step 2 of 8. The entry is the turn of the H4 to M30 row, which often comes several candles later, or never.
- Treating a dashed level as fresh: once a wick has reached a level, its first reaction has already happened.
- Taking a target that is too close: a target nearer than 1.5 times the stop loss distance needs the trade to work far more often just to pay.
- Moving the stop loss: the stop loss marks where the setup is shown to be wrong. Moving it after the entry turns the trade into one with no rules.
Where to Start
Start with the major forex pairs and gold (XAUUSD), on an M30 chart.
These markets trade almost around the clock with a spread that is small next to an M30 stop loss, which matters in a routine where the stop loss is often short.
The indicator’s default timeframes, D1, H4 and H1 levels with the H4 to M30 row for the entry, are built for exactly this chart. Use one market you already know before you add others.
Then keep a record. Write down every setup the rules give you, not only the ones that look good, with the entry, the stop loss, the target and the outcome, including spread and swap. After a few dozen setups you will know how the routine behaves on your market, before it costs you anything on a live account.
Before every MSNR trade
- The D1 to H1 row points the way of the trade.
- Price has reached a fresh (solid) H4 level of the right side.
- The H4 candle at the level did not close through it.
- The H4 to M30 row has just turned the same way.
- The stop loss sits beyond the M30 low or high since the touch, plus one tenth of the M30 ATR(14).
- The target is the nearest fresh level, at least 1.5 times as far as the stop loss.
- The lot size risks only your fixed amount per trade.
The same checklist, the journal pages and the worksheet are in the playbook, ready to print.
The Rules on One Card
| Chart | M30, KT MSNR Indicator on its default settings. |
|---|---|
| Direction | The D1 to H1 row. Bullish for buys, Bearish for sells, No trend for no trade. |
| Level | A fresh H4 level of the right side, reached by an H4 candle that does not close through it. |
| Entry | At the close of the M30 candle that turns the H4 to M30 row to the same direction. |
| Stop loss | Beyond the lowest low (buy) or highest high (sell) of the M30 candles from the first touch to the entry, plus one tenth of the M30 ATR(14). |
| Target | The nearest fresh level beyond the entry, H4 first. |
| Filter | Skip the trade if the target is less than 1.5 times the stop loss distance. |
| Time limit | Close after 200 M30 candles if neither the target nor the stop loss is reached. |
The MSNR Trading Playbook (PDF) carries the level field guide on real charts and the routine on one page. It also has a printable pre-trade checklist, a stop loss and target worksheet, five real examples with their prices, and journal pages for your own record.
Many MSNR traders also study Candle Range Theory. It is a different method, built on the range of one candle rather than on close levels, and the CRT trading strategy page gives its rules.
| # | Name | Link |
|---|---|---|
| 01 | KT MSNR IndicatorDraws the A, V, gap and OCL levels from D1, H4 and H1, keeps them fresh or unfresh for you, and shows the storyline panel. MT4 and MT5. | Get Indicator |
| 02 | MSNR Trading Playbook (PDF)The level field guide, the routine on one page, a pre-trade checklist, a stop loss and target worksheet, five real examples and journal pages. | Download PDF |
Whatever market you trade, the routine comes down to three questions before every trade: which way is the storyline, is the level fresh, and has the lower timeframe turned?
 Built by the Keenbase Trading Lab
The Keenbase Trading Lab is the research side of Keenbase Trading, where trading methods are worked out in full before anything is published about them.
A method reaches this blog only once it is complete enough to trade without guessing. That is why the rules above are stated in full, and every chart on this page is a real setup with its symbol and timeframe named.
Keenbase Trading has more than 11 years of experience in algo trading and in building MetaTrader indicators and Expert Advisors. The methods published here come from the same people who build the indicators that run them.
Prices, candle times and market names differ from broker to broker, so check the rules on your own broker’s charts before you trade with real money.