
CRT Trading Strategy: The Exact Rules, and How to Judge a Setup
A CRT buy on the Dow (US30). Price went below the low of a 4 hour candle and then closed back inside that candle’s range. The trader bought at the open of the next 4 hour candle, and a little over an hour later price reached the middle of the range, the trade’s target.
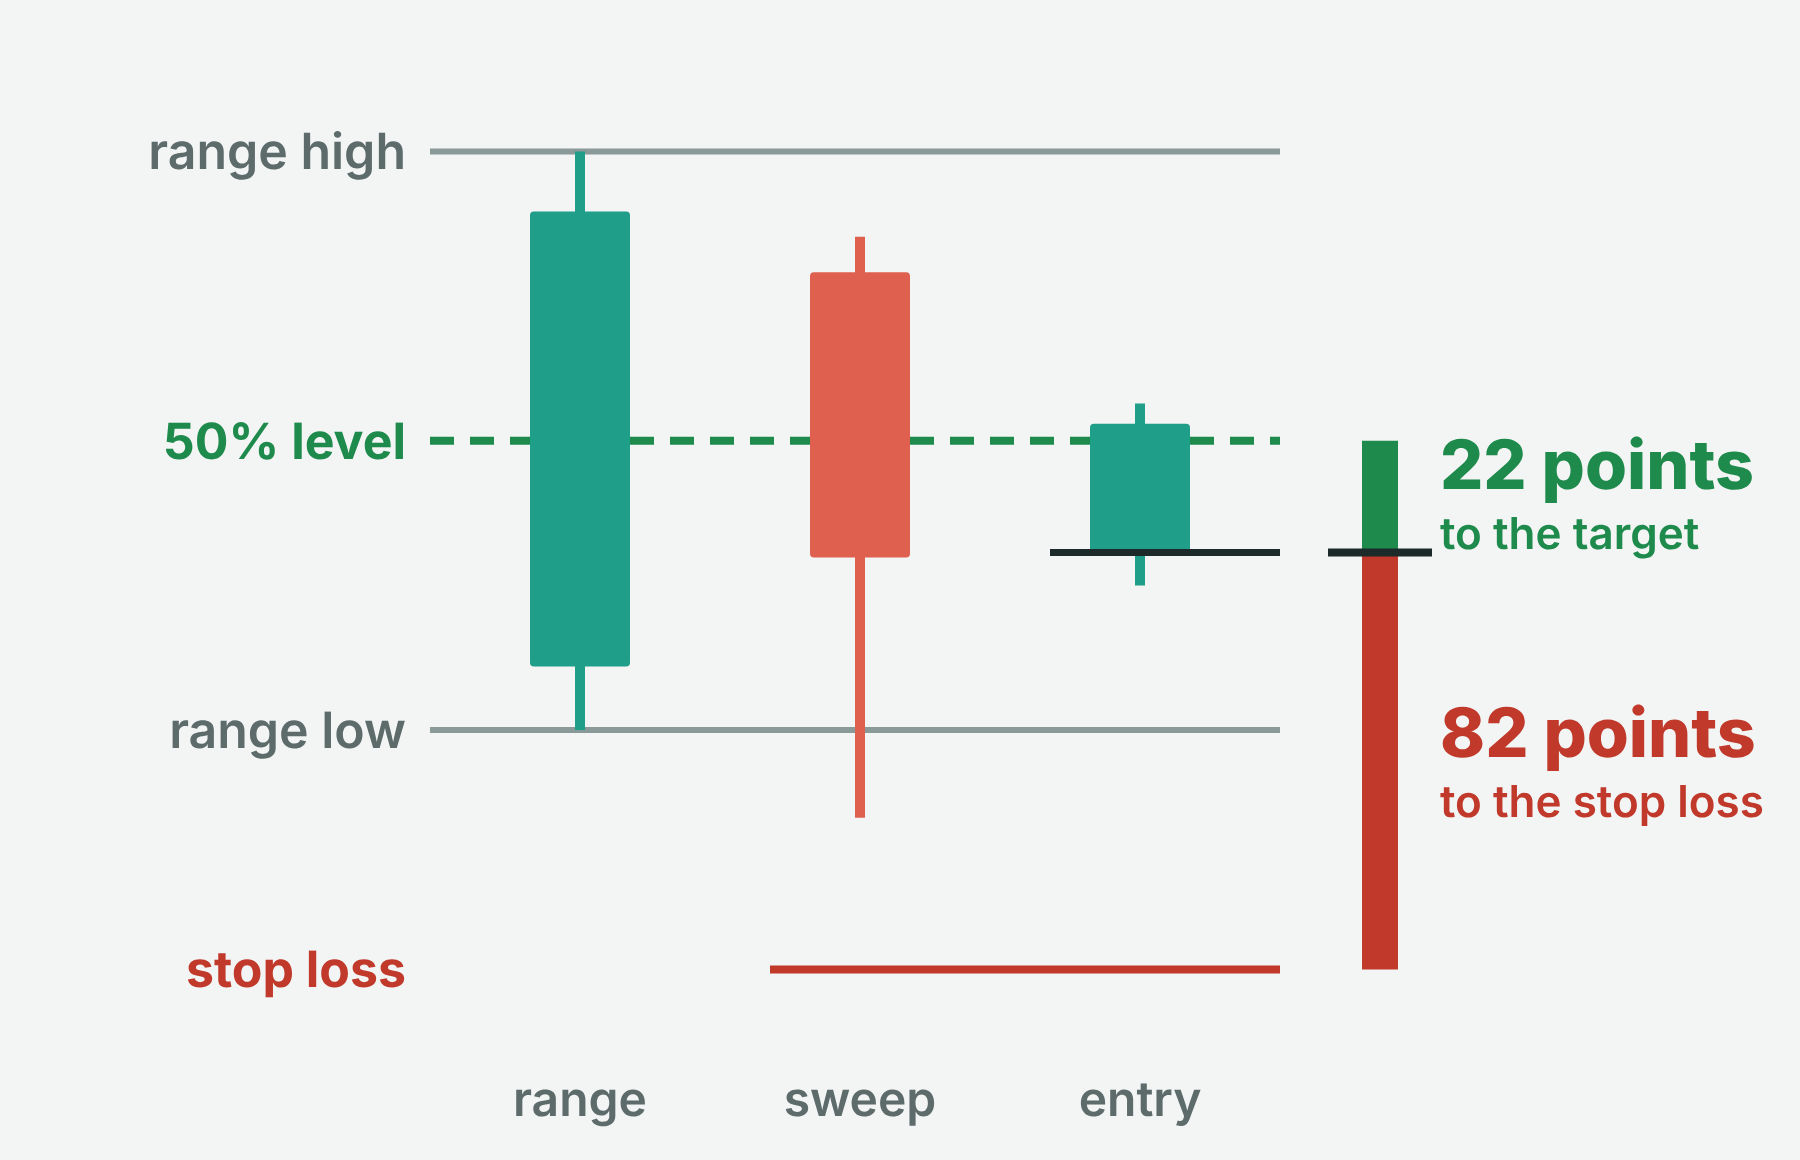
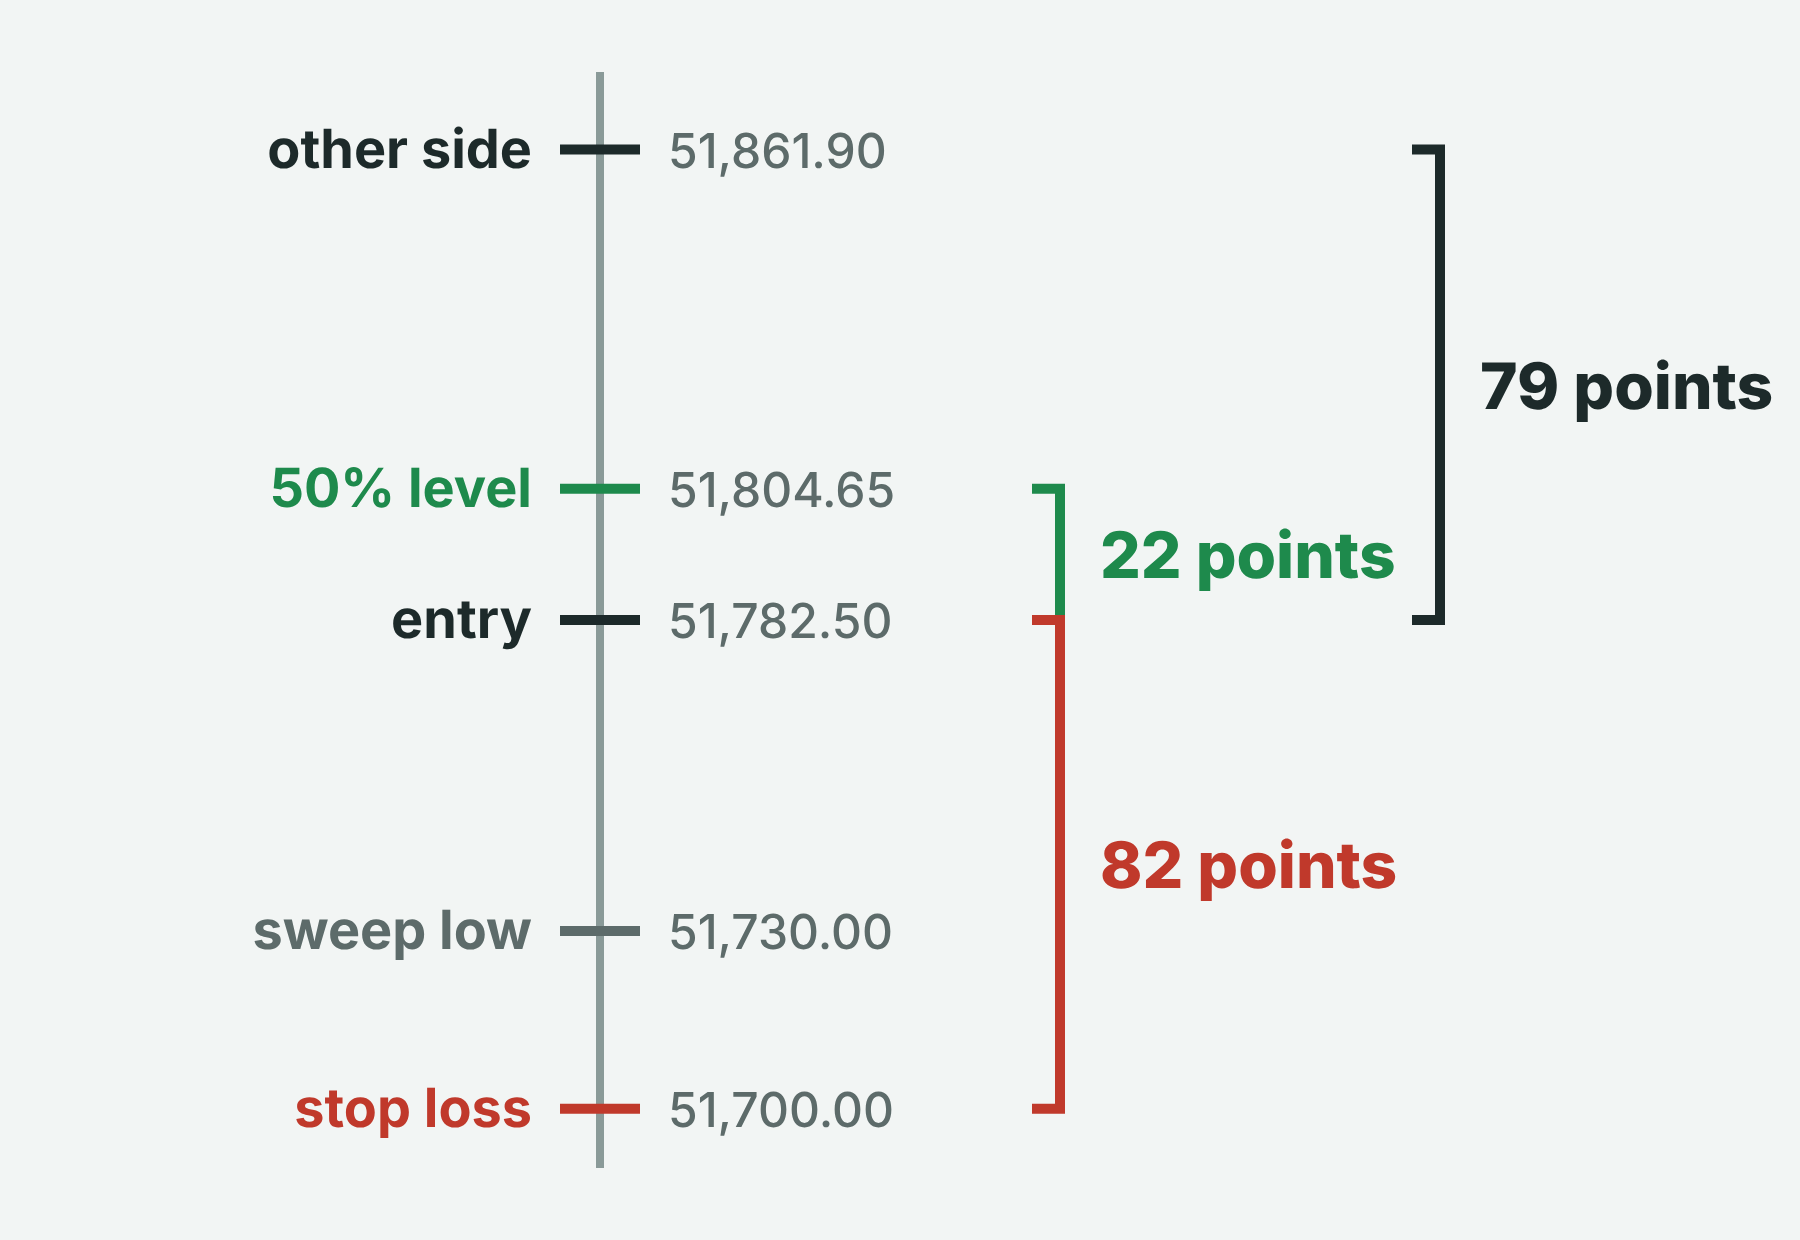
The trade reached its target and was still a poor trade to take. The target sat 22 points above the entry, and the stop loss sat 82 points below it. On the Dow, one point is a price move of 1.0.
Candle Range Theory (CRT) is easy to see on a chart and easy to trade badly. Below are the complete rules for trading it on MetaTrader 4 (MT4) and MetaTrader 5 (MT5), from the range candle to the exit.
Then comes the one check that decides whether a CRT setup is worth taking at all: the distance to the target against the distance to the stop loss.
What a CRT Setup Is
One candle on a higher timeframe is treated as a range. Its high and its low are the edges of the range, and the price halfway between them is the 50% level.
The next candle is the sweep candle. It pushes beyond one edge of the range, where many traders keep their stop loss orders and pending orders, and then closes back inside the range.
The idea behind CRT is this: once price has gone beyond one edge of the range and closed back inside it, CRT traders expect the next move to run back across the range. First to the 50% level, then to the opposite edge of the range, which this page calls the other side.
- If the sweep candle goes below the range low and closes inside the range, it is a CRT buy.
- If the sweep candle goes above the range high and closes inside the range, it is a CRT sell.
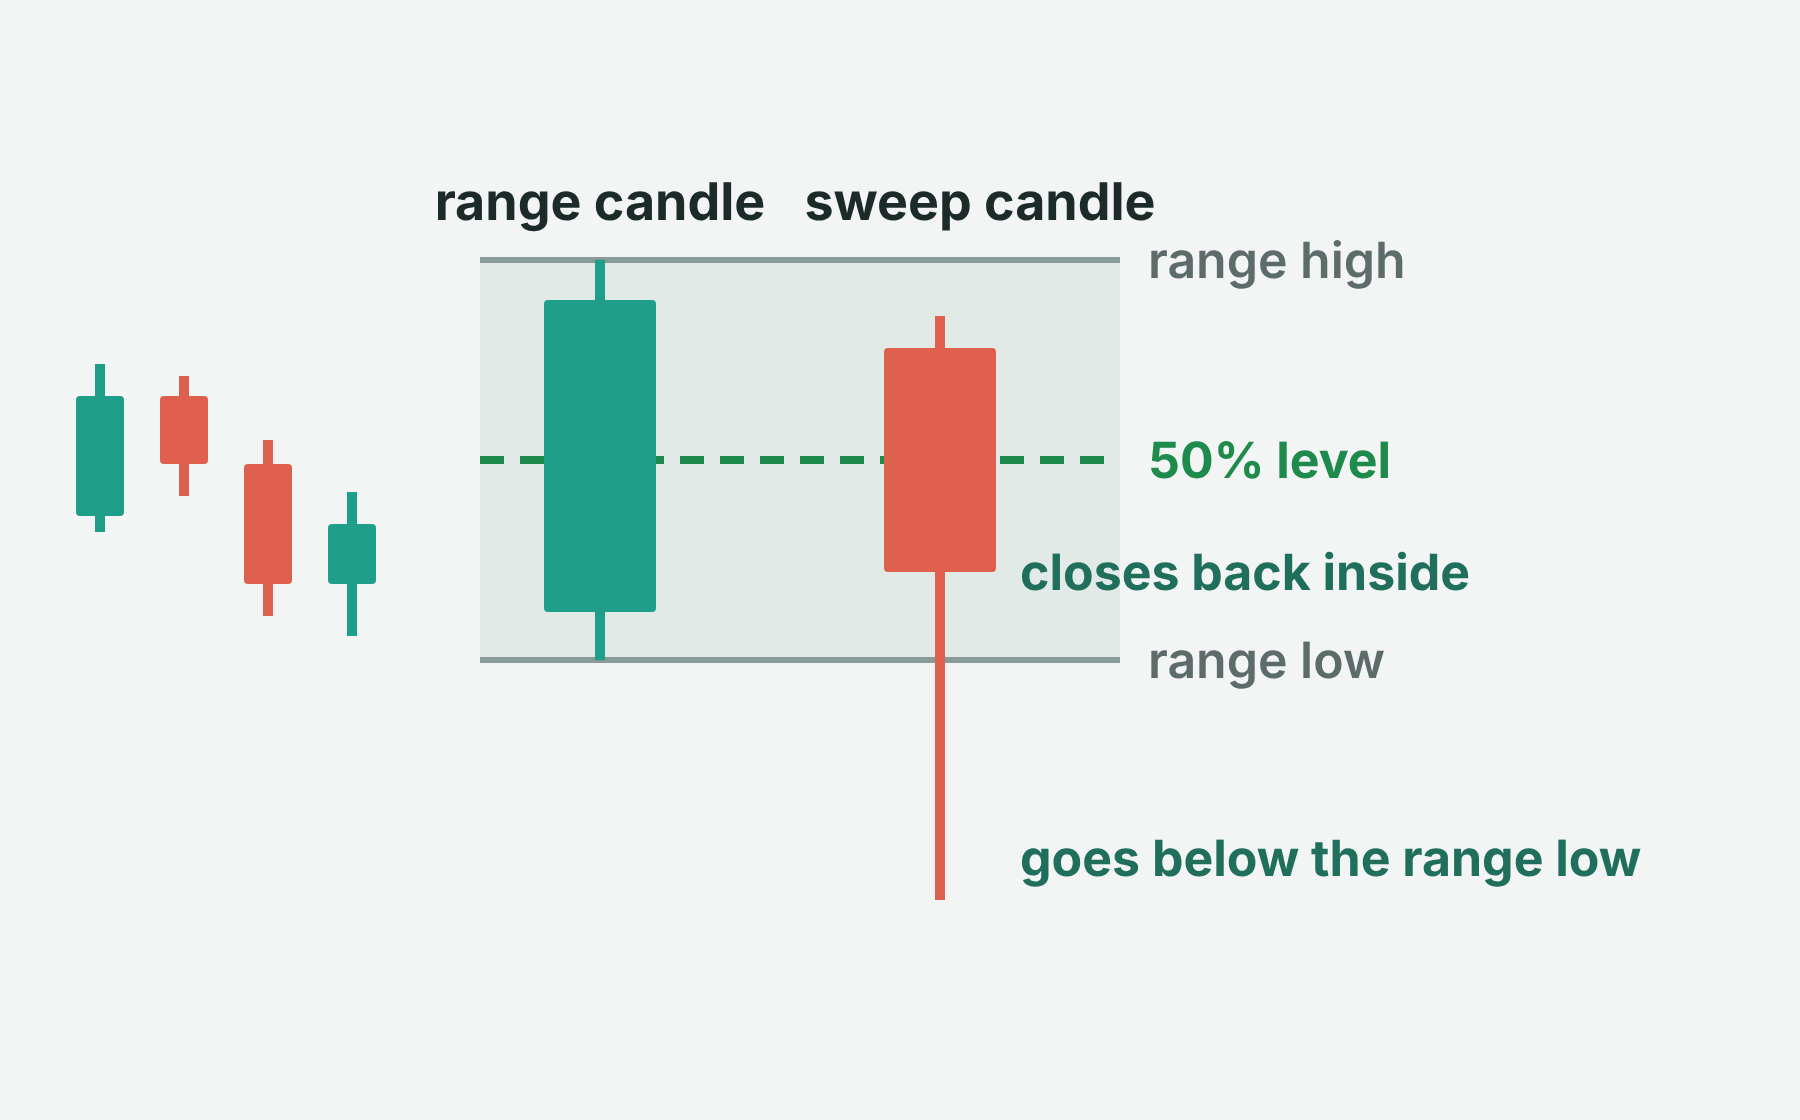
That is the whole pattern. Everything below turns it into rules you can follow without guessing.
The Entry Rules
These rules use 4 hour (H4) candles. Any closed H4 candle can be a range candle, and the sweep candle is the H4 candle that follows it.
H4 candles open at different times at different brokers, because each broker uses its own server time. The same market can show different setups at two brokers.
Rule 3 is the easiest one to bend. A candle that is still below the range low with ten minutes to go may still close inside the range, or it may not, and until it closes there is no setup. The setup exists at the close of the sweep candle and not before.
KT CRT Indicator marks every setup that meets rules 1 to 4 on MT4 and MT5. It draws the range high, the range low and the 50% level, and places a buy or sell arrow at the close of the sweep candle. It does not apply rule 5, so check where the sweep candle closed against the 50% level yourself.
A sweep that is still forming shows as a pending setup with a countdown to the candle close. The arrow appears when the candle closes and does not move afterwards.
The Stop Loss
Place the stop loss below the sweep candle’s low for a buy, or above the sweep candle’s high for a sell, plus a small extra distance. That extra distance is one tenth of the H4 ATR(14) of the range candle.
ATR(14), the Average True Range over 14 candles, is a standard MetaTrader indicator that shows how far price usually moves in one candle.
The stop loss goes there, and not at the edge of the range, because the sweep candle has already traded past the edge. A stop at the edge sits inside a move the market has just made.
The sweep candle’s low for a buy, or its high for a sell, is the price the setup says should not be reached again, so it is where the setup is shown to be wrong.
This makes the stop loss different on every setup. A sweep that ran far past the range gives a wide stop loss; a sweep that barely went past the edge gives a tight one.
Choose the lot size so that, if the stop loss is hit, you lose the fixed amount of money you have decided to risk on one trade. A wide stop loss means a smaller lot, and a tight stop loss means a larger lot.
The Targets, Chosen Before the Entry
CRT gives two targets:
- The 50% level, the middle of the range candle.
- The other side, the opposite edge of the range: the range high for a buy, the range low for a sell.
Choose one target before you enter, and keep it. Choose it with the check later on this page, which shows which target pays on your market. Moving the target after the entry, because price is moving well or because it has stalled, changes the trade into a different trade with no rules.
The time limit: if neither the target nor the stop loss has been reached, close the trade at the close of the third H4 candle after the sweep candle. The candle you enter on counts as the first of the three.
A CRT trade expects a move inside the range of one H4 candle. If price has not made that move in three more candles, the reason for the trade has gone.
The limit counts candles, not hours, so a trade entered late on a Friday can run into the next week. A trade held over the weekend can open on Monday beyond the stop loss, and then the loss is larger than the stop loss distance.
Two Distances Decide the Trade
Back to the Dow setup from the top of the page.
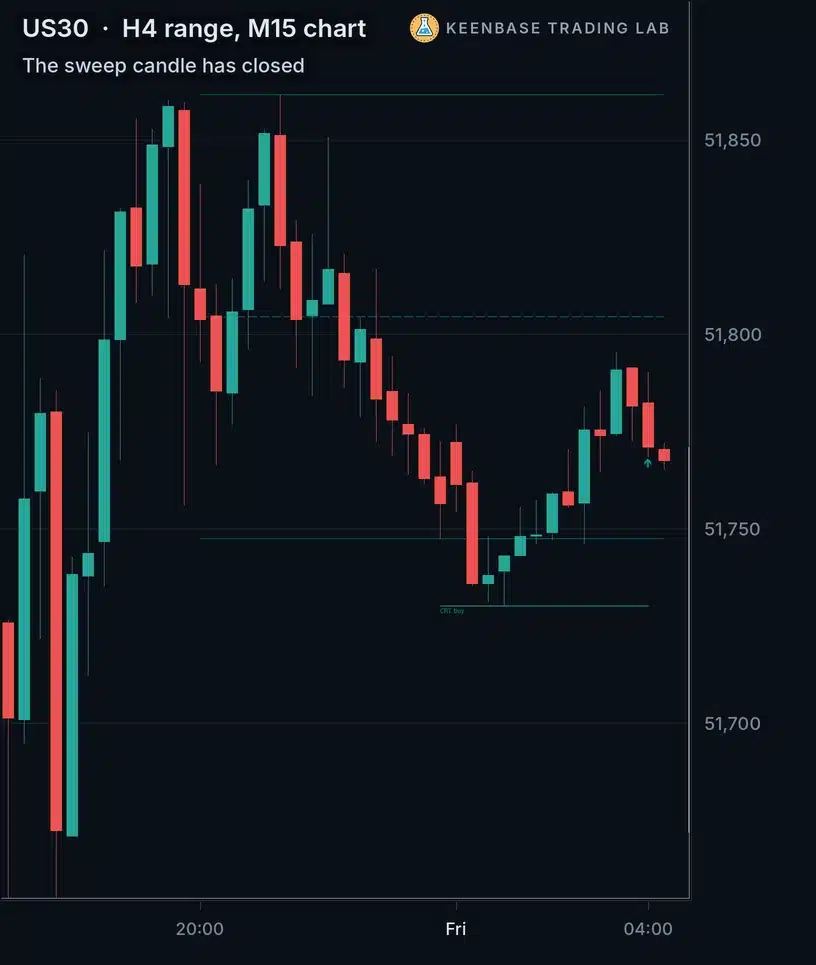
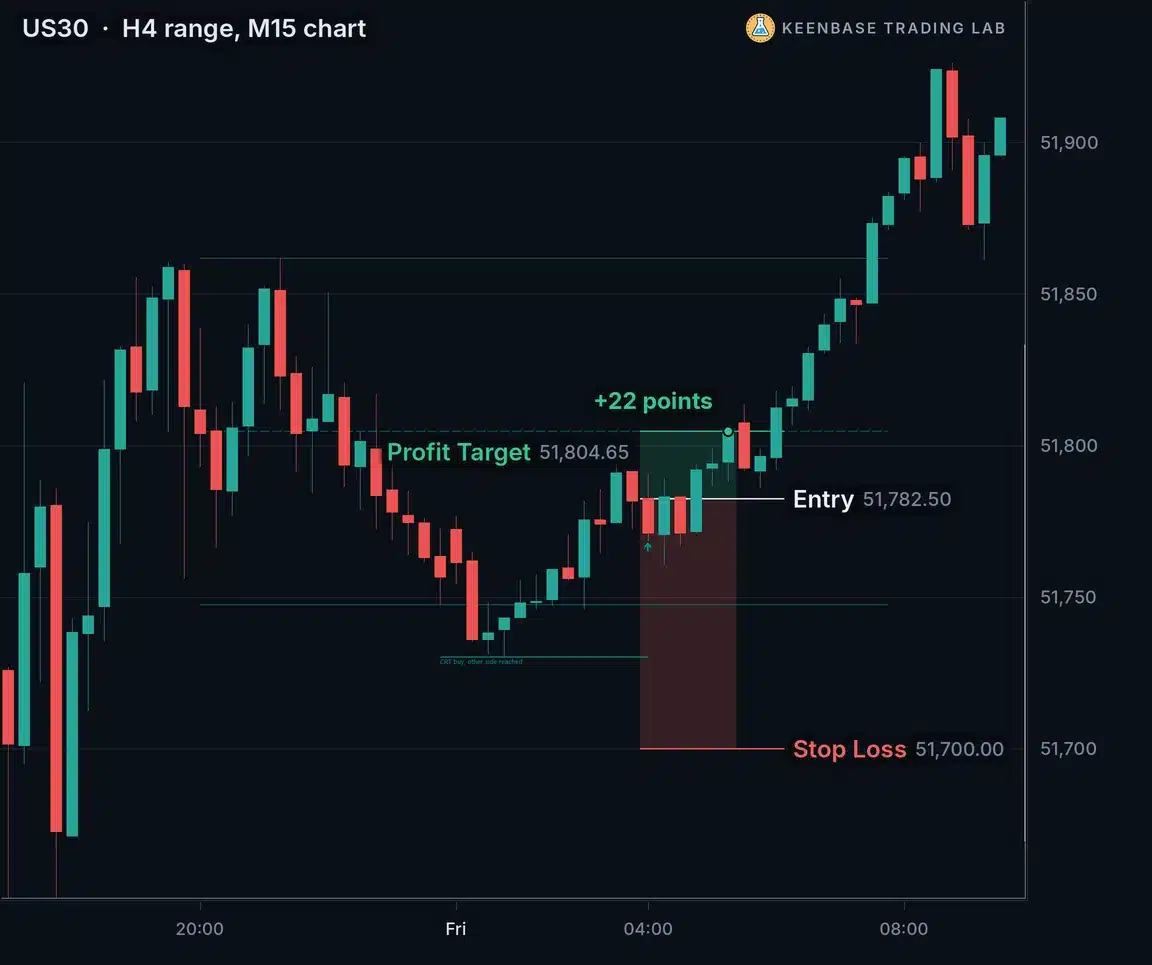
The range candle had a high of 51,861.90 and a low of 51,747.40, so the 50% level was 51,804.65.
The sweep candle dropped to 51,730.00, below the range low, and closed at 51,781.50, back inside the range. This was a CRT buy. The sweep candle closed below the 50% level, so the setup passed rule 5.
The entry was the open of the next H4 candle, 51,782.50.
The stop loss: the H4 ATR(14) was about 300 points, so the extra distance was 30 points, and the stop loss went 30 points below the sweep low, at 51,700.00.
From the entry, the distances were:
- The 50% level was 22 points away.
- The other side was 79 points away.
- The stop loss was 82 points away.
Price reached the 50% level a little over an hour after the entry, and the other side a few hours later. Both targets were reached. With the 50% target, the trader risked 82 points to make 22. Comparing those two distances is the idea behind the reward to risk ratio.
A target near the entry is reached more often than a target far from the entry. That is all a near target tells you. It does not tell you that the trade makes money over many trades, because every trade that fails loses the full stop loss distance.
Here is the calculation. Take a series of trades with the same distances. It breaks even when the share of trades that reach the target equals the stop loss distance divided by the total of the stop loss distance and the target distance. For the 50% target above: 82 divided by 104 (82 plus 22) is 0.79, so about 79 trades in 100.
| Distance to target | Distance to stop loss | Must reach the target to break even |
|---|---|---|
| 22 points | 82 points | about 79 in 100 |
| 79 points | 82 points | about 51 in 100 |
| 173 points | 53 points | about 23 in 100 |
The first two rows are the Dow setup above with its two targets. The third row is a different setup, shown next, where the sweep stopped close to the range edge.
These break-even figures leave out spread, commission and swap. Swap is the overnight fee for holding a trade past the broker’s daily cut-off time. These costs usually raise the share of trades that must reach the target.
The figures also assume that every trade ends at the target or at the stop loss; a trade closed at the time limit ends somewhere in between.
When the Distances Work for You
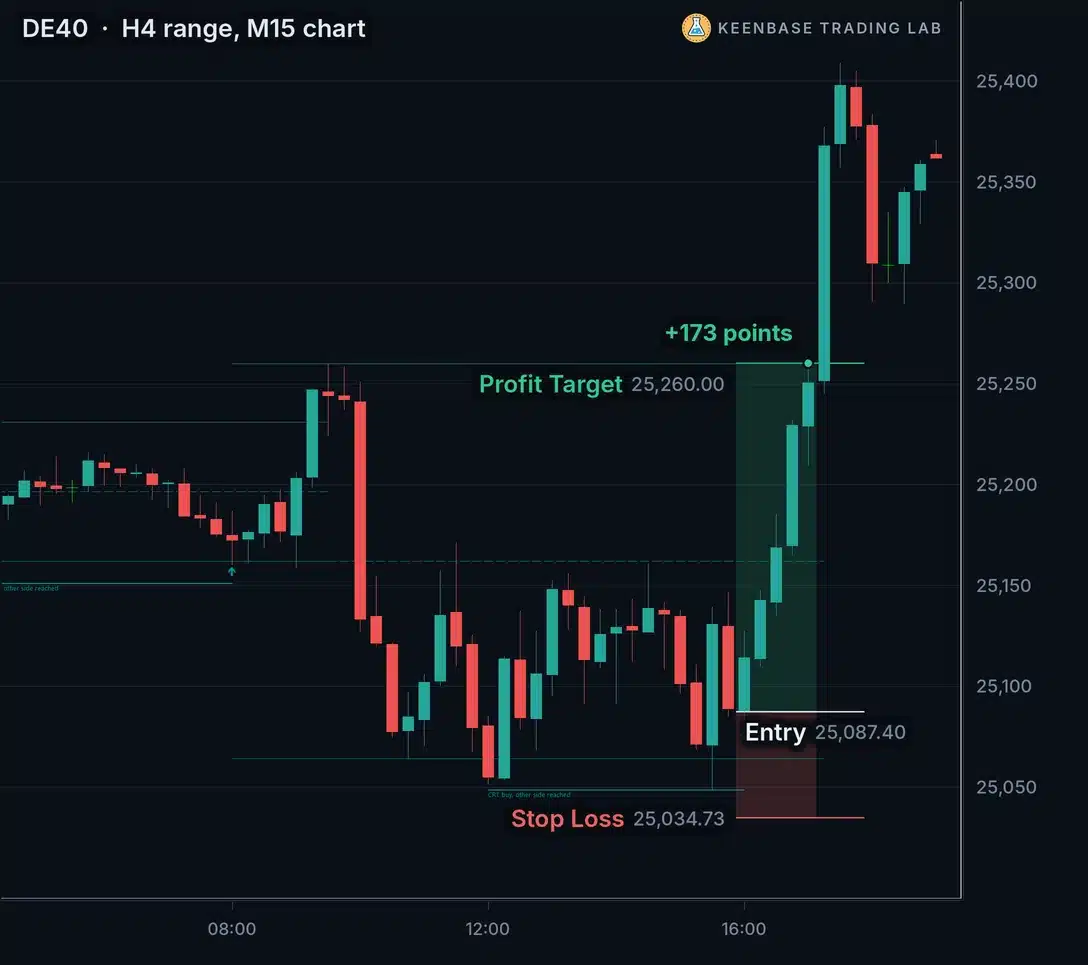
On the DAX (DE40) setup on the left, the sweep candle went about 16 points below the range low and closed back inside the range. The stop loss, below that shallow sweep, sat 53 points from the entry. The 50% level was 74 points away and the other side 173 points away.
The same pattern, the same rules, and a completely different trade. Here the stop loss was the short distance and both targets were long ones.
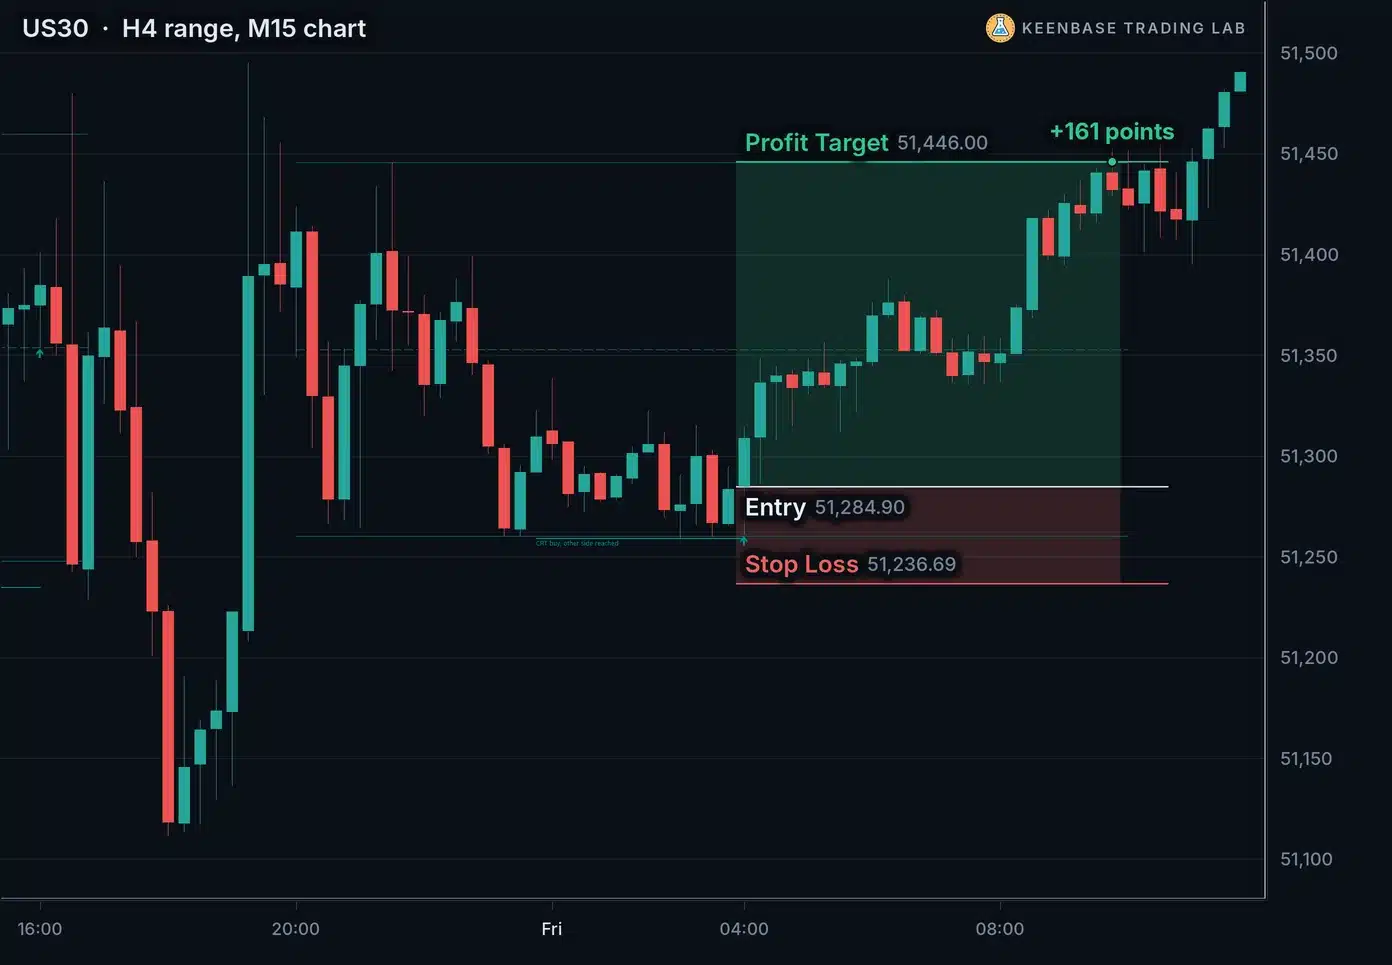
The Dow setup on the right has the same shape: a stop loss 48 points from the entry, the 50% level 68 points away and the other side 161 points away. Both examples were chosen to show the distances, not as a sample of results.
The distances are fixed before the entry, by two things you can read on the chart when the sweep candle closes:
- How far the sweep ran past the range: a deep sweep puts the stop loss far from the entry.
- Where the sweep candle closed inside the range: a close near the 50% level leaves the first target near the entry.
A deep sweep that closes near the 50% level gives a 50% target near the entry and a stop loss far from it, so each win is small compared with each loss. A shallow sweep that closes near the range edge gives a stop loss near the entry and targets far from it.
A Setup That Failed
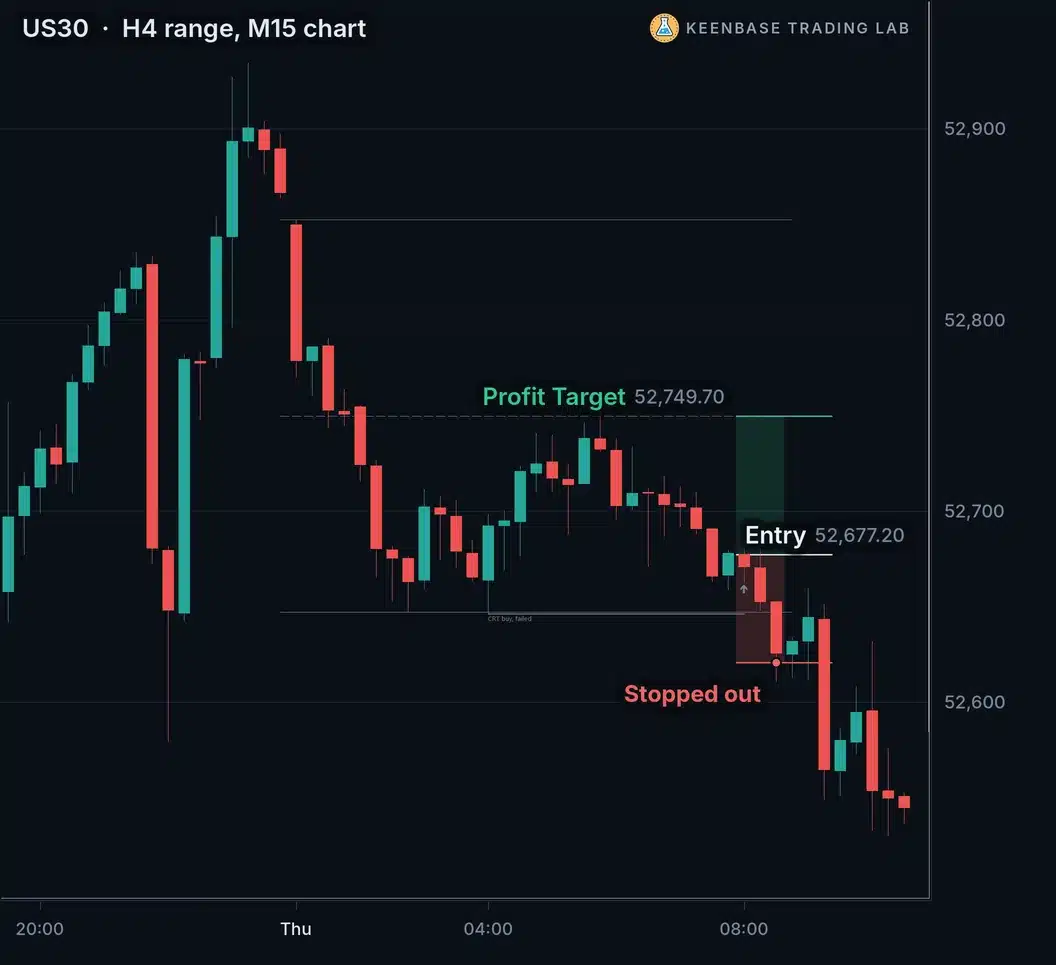
The range candle’s low was 52,646.70. The sweep candle went to 52,645.70, one point below it, and closed back inside the range at 52,677.70. By the rules that is a CRT buy. Both targets were farther from the entry than the stop loss: 57 points to the stop loss, 73 points to the 50% level and 176 points to the other side.
Price fell through the stop loss within the first hour after the entry.
The rules do not ask how far the sweep went, only whether it went past the edge and closed back inside the range. A sweep of one point counts.
Good distances lower the share of trades that must reach the target to break even. They do not make any single trade certain, and a setup that looks right on the chart still loses the full stop loss distance when it fails.
The Time Limit at Work
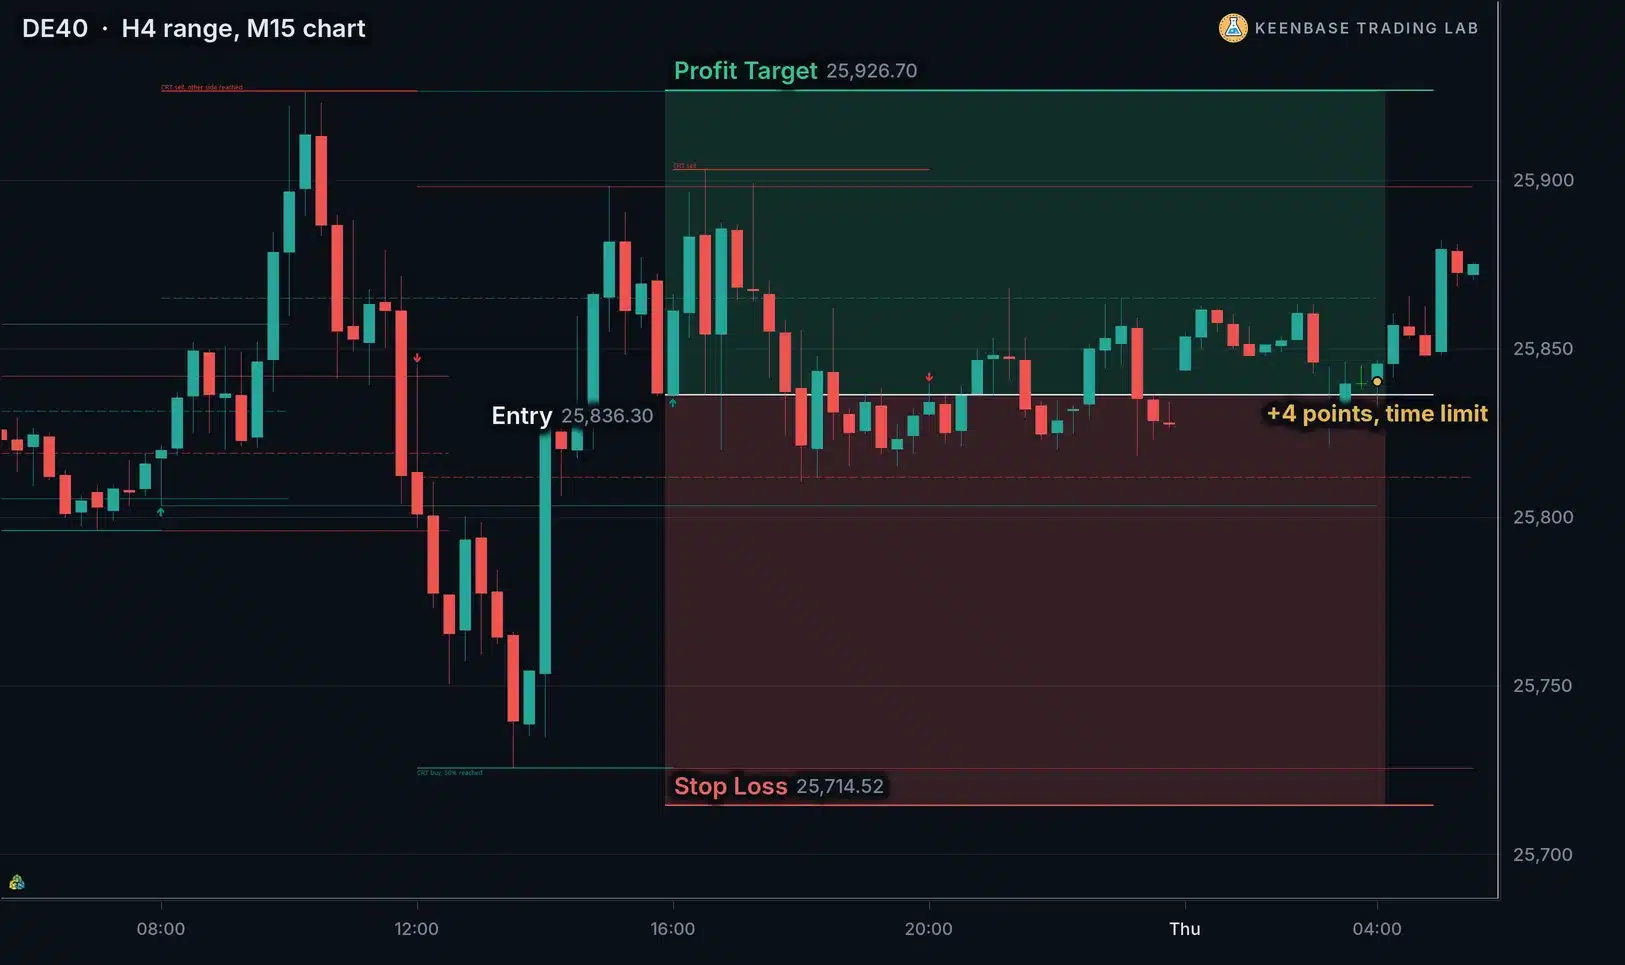
On this DAX setup the sweep ran 78 points below the range low before closing inside the range, so the stop loss sat 122 points from the entry. The 50% level was only 29 points away and was reached within the first fifteen minutes.
The other side, 90 points away, was not reached before the time limit. With the other side as the target, the trade was closed at the end of the third H4 candle after the sweep candle, 4 points above the entry.
This one setup shows both lessons. With the 50% target, the trade reached its target within fifteen minutes but risked four times what it could make. With the other side as the target, the trade never reached its target and was closed at the time limit.
Check Your Own Market Before You Trade It
Start with H4 range candles, on the market you already trade.
H4 is a common timeframe for the CRT range candle, so your setups will look like the ones you have already seen in CRT videos and guides. Your own market is the one whose sessions, spread and swap you know. This is where to begin checking, not a claim that CRT works there.
Here is how to run the check with KT CRT Indicator on the chart:
- Read the panel: the statistics panel shows how many CRT setups formed on your symbol. It also shows how many reached the 50% level and the other side before the setup failed, for buys, sells and both together.
- List your setups: scroll back through the setups the indicator has drawn. Keep each one that passes the six entry rules, and note the distance from the entry to the 50% level, to the other side, and to the stop loss.
- Add up the results for each target: write the target distance as a plus when the target was reached, and the stop loss distance as a minus when the stop loss was hit. For a trade closed at the time limit, write the points gained or lost.
- Read the total: if the total for a target is below zero after costs, that target loses money on your market, even if the target was reached on most trades.
The panel follows every setup the indicator marks, including some the entry rules here skip. Treat its counts as a first read, and check the setups you would actually take.
The indicator can also use only the H4 candles that open at 1:00 AM, 5:00 AM and 9:00 AM New York time, which many CRT guides recommend. Check those setups the same way, with the same calculation, before you trade them.
Count every setup the rules give you, not the ones that look good in hindsight. Include spread, commission and swap. A total taken from a few dozen setups moves a lot when the next few setups arrive, so treat it as a rough guide, not a fixed number.
If both targets lose money on your market, the honest answer is not to trade CRT there. That is a useful result too: it saves you the cost of learning this on a live account.
The Rules on One Card
CRT trading strategy, the rules
- Range:One closed H4 candle; its high, low and 50% level.
- Sweep:The next H4 candle goes beyond exactly one edge of the range.
- Close:Back inside the range, and not yet past the 50% level.
- Direction:Range low taken is a buy, range high taken is a sell.
- Entry:The open of the next H4 candle.
- Stop loss:Beyond the sweep candle’s low or high, plus one tenth of the H4 ATR(14).
- Target:The 50% level or the other side, chosen before the entry.
- Time limit:Close at the end of the third H4 candle after the sweep candle.
- Before you trade a market:Add up the results of its past setups for each target, after costs.
For a related method that trades a sweep of swing highs and swing lows instead of one candle’s range, see the liquidity sweep strategy.
KT CRT Indicator runs on MetaTrader 4 (MT4) and MetaTrader 5 (MT5):
| # | Name | Link |
|---|---|---|
| 01 | KT CRT IndicatorMarks every CRT setup at the close of the sweep candle, draws the range high, low and 50% level, and keeps a statistics panel for your symbol. MT4 and MT5. | Get Indicator |
Whatever market you trade, ask the same two questions before every CRT trade: how far is the target, and how far is the stop loss?
 Built by the Keenbase Trading Lab
The Keenbase Trading Lab is the research side of Keenbase Trading, where trading methods are worked out in full before anything is published about them.
A method reaches this blog only once it is complete enough to trade without guessing. That is why the rules above are stated in full, and every chart on this page is a real setup with its symbol and timeframe named.
Keenbase Trading has been building MetaTrader indicators and Expert Advisors since 2018, alongside free indicators and custom MQL5 development. The methods published here come from the same people who build the indicators that run them.
Prices, candle times and market names differ from broker to broker, so check the rules on your own broker’s charts before you trade with real money.