
Liquidity Sweep Trading Strategy: A Complete Rule Set for MT4 and MT5
Almost every explanation of a liquidity sweep says the same thing. Price pushes through an obvious high or low, triggers the stops resting there, fails to continue, and snaps back. Look for the long wick.
That describes a finished move. It is not a rule anyone can trade, because you only know price snapped back after it snapped back. By then the candle you were meant to act on has closed and the move is running without you.
Trading a sweep, rather than recognising one afterwards, needs two answers that almost nobody states.
When does a level become a level? Not every high is one. Something has to confirm it, and that confirmation lands later than most traders assume.
At which candle close is the sweep decided? A signal that can appear, vanish and reappear while a candle is still forming is not a signal. It is a moving picture of an opinion.
Answering them gives a complete rule set: what to map before the session, what counts as a sweep, where the entry goes, where the stop goes, and where the idea is void. Then how to test all of it yourself, before you risk anything on it.
When a Level Becomes a Level
A liquidity pool is a price where orders are resting. In practice that means a level that price has already visited and reacted to, because the traders who reacted left their stops just beyond it.
The mechanical definition is a three bar swing.
- A high qualifies when the bar before it is lower and the bar after it is lower.
- A low qualifies the same way in reverse.
That last condition is the one that matters and the one nobody mentions. The bar after it has to close before you know: a swing high is confirmed one candle after the candle that made it, not at the moment price prints the high.
So a level made at 09:00 is not available to act on until 11:00. That is not a flaw. It is what makes the level objective instead of a line drawn because the chart looked right.
On this definition a level cannot be marked at the bar that makes it. The confirmation has not happened yet.
Levels are worth more when several sit at the same price. Two or three highs within a few points of each other are treated as a bigger pool than one isolated high, and that difference decides the grade later.
The KT Equal Highs & Equal Lows indicator marks these pools as they form. That saves drawing them by hand and, more usefully, stops you deciding after the fact that a level was there all along.
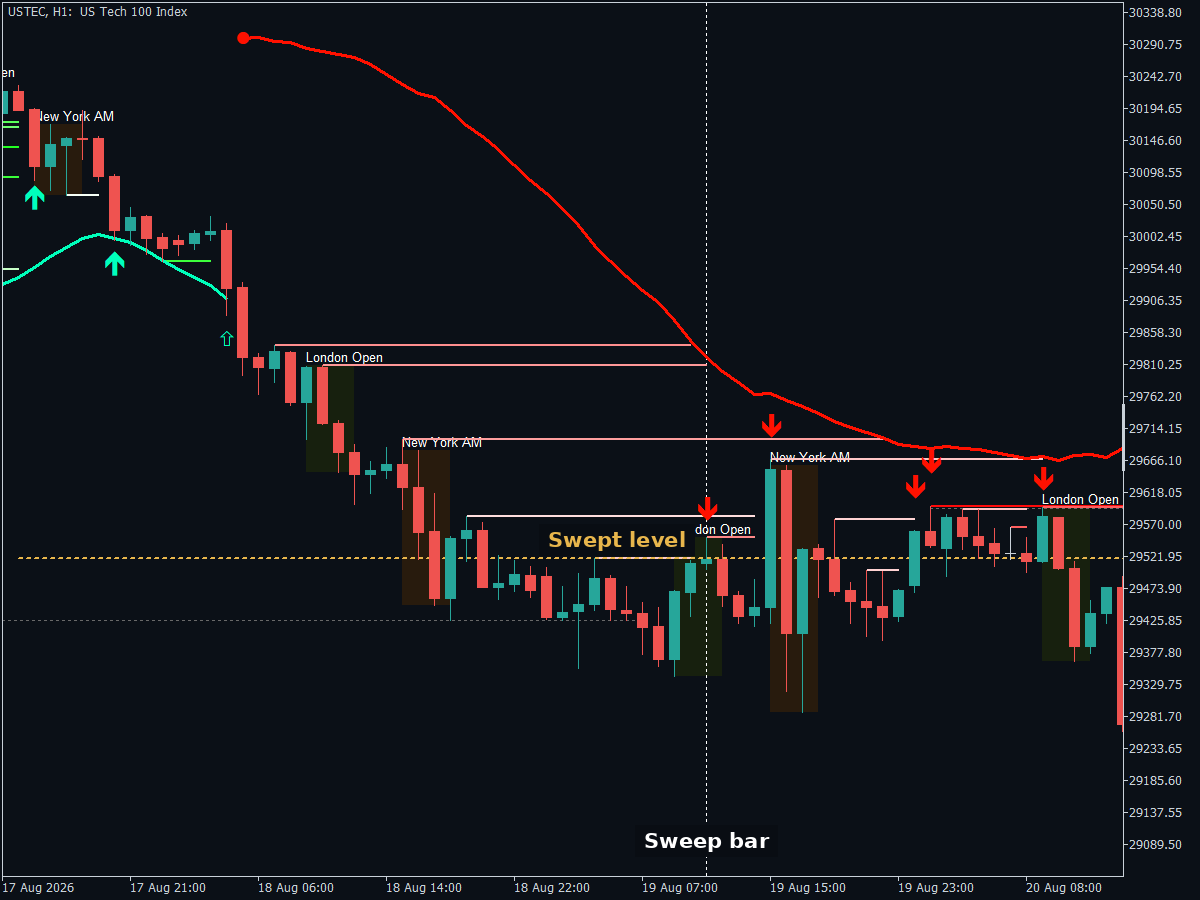
USTEC H1. Pools mapped across the chart, with one of them being taken.
The Session Window
Sweeps are not spread evenly through the day. They cluster where volume arrives, because that is when there is enough participation to run a level and reverse off it.
Two windows carry this method, both stated in New York time.
London Open, 02:00 to 05:00: European liquidity arrives against whatever the Asian session built overnight.
New York AM, 08:30 to 11:00: the window that brackets the US data releases at 08:30 and the cash equity open at 09:30.
Everything outside those windows is ignored. Not because nothing happens, but because the premise of the method is a level being run by real participation, and thin hours produce level breaks that look identical and mean something different.
KT ICT Kill Zones draws these windows in New York time whatever your broker’s server clock is set to, which removes the most common source of error here. A trader who prefers not to add it can do the same job with a clock and a note, as long as they handle the daylight saving shifts on both sides of the Atlantic.
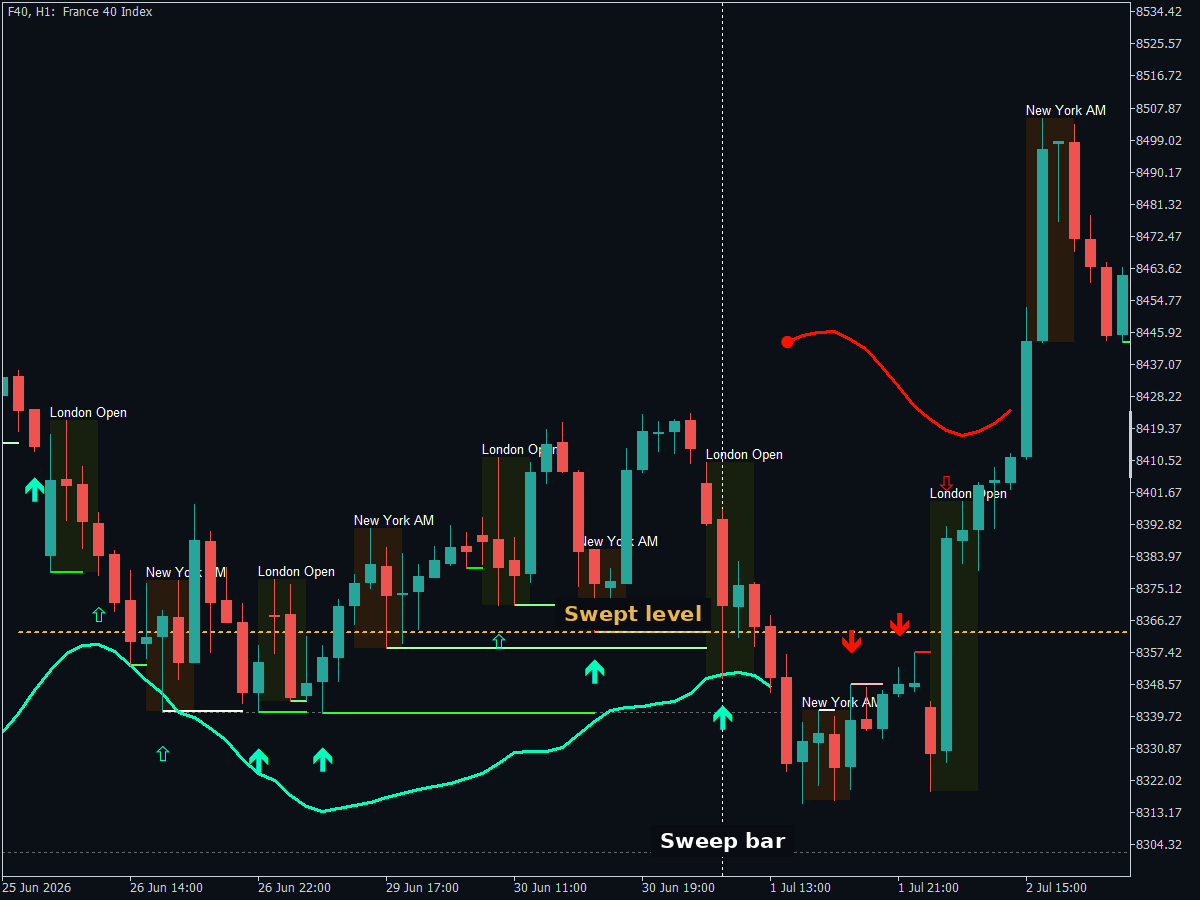
F40 H1. The two session windows shaded across a week of trading.
The Candle Close That Decides the Sweep
The timing of that decision is what makes the method testable at all.
A sweep is evaluated only on a closed candle: while a candle is still forming, price may be through the level and the sweep is not yet decided. When the candle closes, the assessment is made, and it does not change afterwards.
Two things follow, and they are worth separating because traders run them together.
- You act at the close, not during the bar. Watching price poke through a level mid candle and entering there is a different strategy with different odds, and it is not this one.
- A marker settled at the close can be reviewed honestly later. A signal that could redraw itself would show you a version of the past that was never available in the present, and every conclusion drawn from it would be worthless.
That is the difference between a method you can test and a method that only looks good backwards.
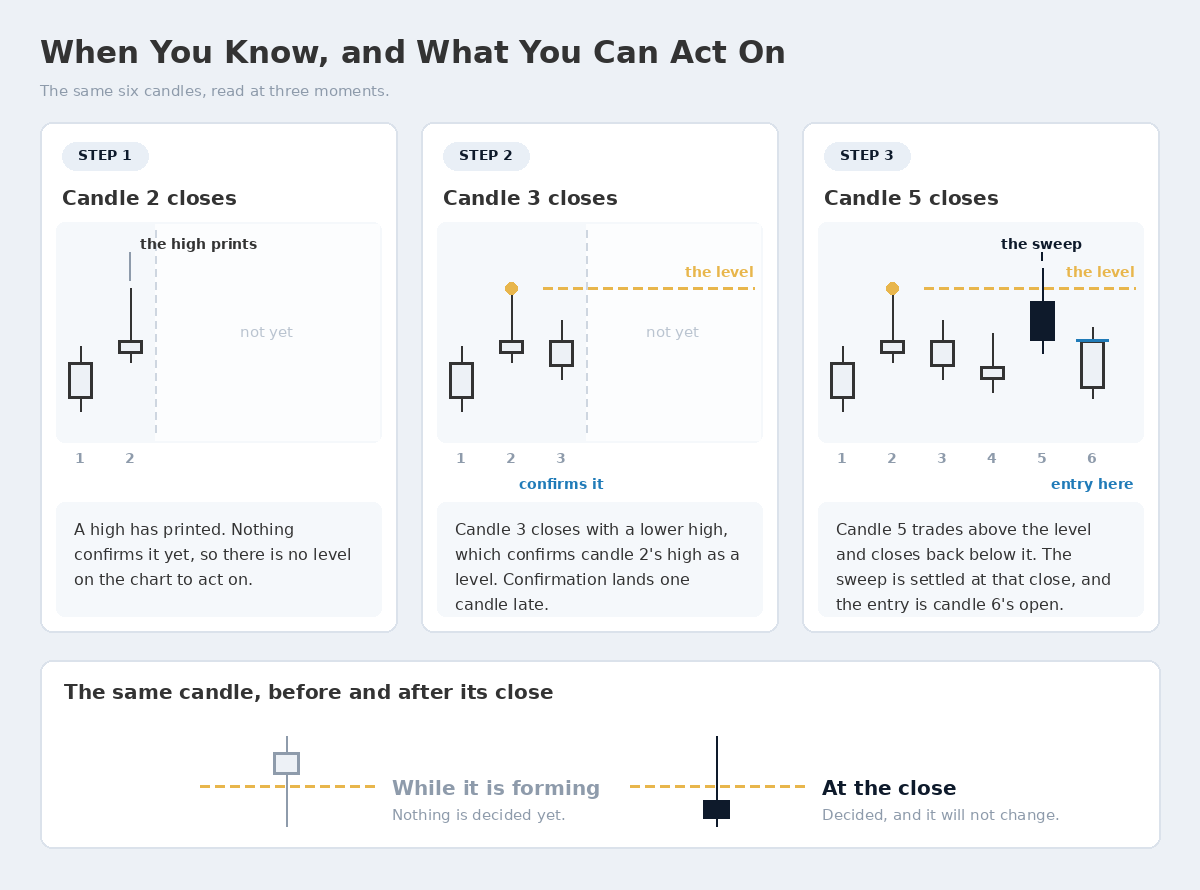
The level exists two candles after the high prints. The sweep is settled at a close, and not before.
One part of this behaves differently, and it matters as soon as you trade this live. The adaptive trend band is calculated on the forming candle and does update live. It is context, not a trigger. Acting on the band changing state mid candle is outside these rules.
Grading the Sweep
Not every push through a level is worth trading, and this is where most explanations stop and leave you to judge by eye.
The grading rule here is volume. When a candle trades through one or more stored levels, the grade is worked out like this.
- The tick volume of the bars that created those levels is normalised.
- Those figures are added together, across every level the candle took.
- If the total reaches the Major Sweep Threshold the event is a major sweep, and below it, minor.
Clustering is why this matters. Running three equal highs accumulates the volume of all three, so a cluster grades major where a single isolated high often does not.
The rule is doing something a trader cannot do reliably by eye. It scores the volume behind the levels the candle took, rather than how dramatic the wick looks.
The KT Liquidity Sweep Filter performs this classification and marks the result on the chart. This method takes major sweeps only: minor ones are left alone. That costs setups, and the trade off is deliberate.
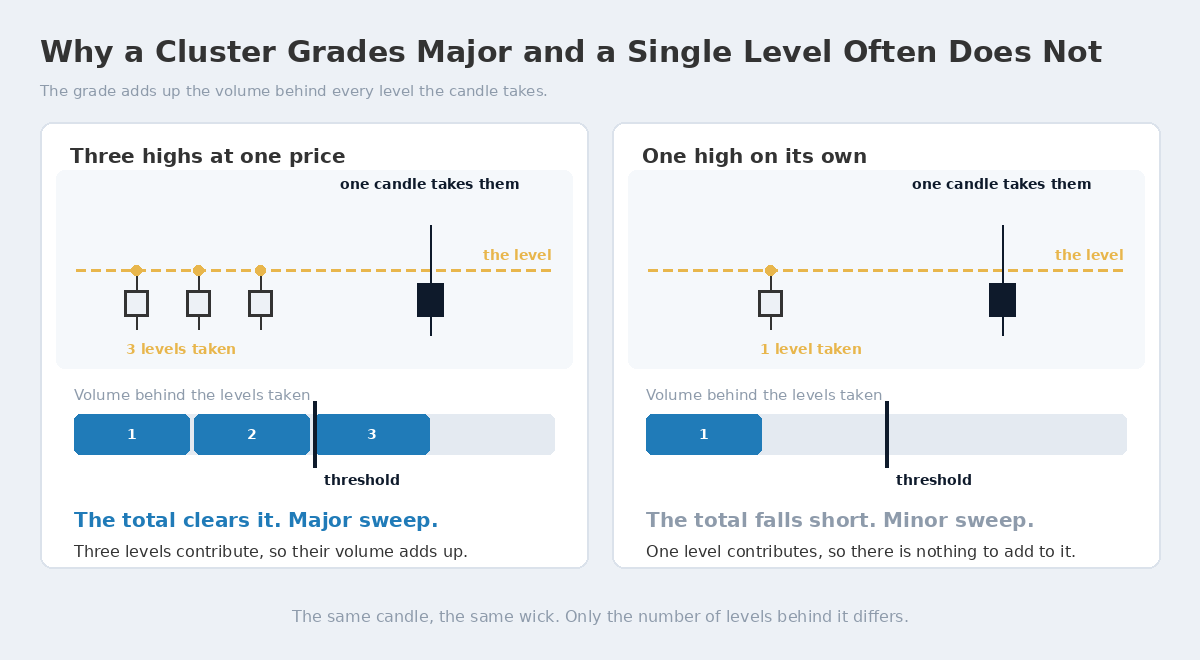
Three highs at one price are one pool. The candle that takes all three carries their volume with it.
A note on volume that most pages skip: in forex there is no central exchange, so what MetaTrader calls volume is tick count from your own broker’s feed. Two brokers can disagree about the same candle.
Any volume based classification is therefore relative to your feed, and a threshold that behaves one way on one broker may behave slightly differently on another. Index CFD volume comes from your broker too, so check how the threshold behaves on your own feed before you trust it.
The Rules
That is the whole method. These are the settings it runs on.
| Element | Setting |
|---|---|
| Instruments | Index CFDs. The CAC 40, the Nasdaq 100 and the Dow are the starting point |
| Timeframe | H1 for both mapping and signals |
| Sessions | London Open and New York AM, New York time |
| Major Sweep Threshold | 50 |
| ATR | 14 period, used for the stop buffer only |
Broker symbol names differ. Those three indices appear on many platforms as F40, USTEC and US30, but check your own symbol list rather than assuming.
The long setup
Every condition is required, in this order.
- A pool of equal lows is mapped and confirmed, or the session has printed a low, which is simply its lowest point so far.
- A candle closes inside one of the two session windows.
- That candle’s low trades below the mapped level, or through several of them.
- The accumulated volume of the levels taken reaches the threshold, so the event grades major.
- That same candle closes back above the nearest level it took.
Enter at the open of the next candle: there is no entry during the sweep candle itself.
The short setup
The mirror image. The candle’s high trades above one or more mapped equal highs or a session high, the event grades major, and the candle closes back below the nearest level it took. Enter at the open of the next candle.
Stop loss: below the low of the sweep candle for a long, above its high for a short, in both cases with a buffer of half the current ATR beyond that extreme.
The reasoning is that the sweep candle’s extreme is the furthest price the move reached while taking the liquidity. If price goes back through it, the premise is gone. The ATR buffer keeps you from being removed by noise sitting exactly on the wick.
Profit target: twice the stop distance, measured from the entry. A fixed multiple is deliberate. It keeps the exit from doing work the entry should be doing, and it makes your own testing interpretable, because every trade is the same shape.
The mapped pools on the other side of price are usually where the move is heading, and with the levels on your chart you can see them. Nothing marks that target for you, and the rule stays at twice the risk.
Invalidation, before entry: if the next candle opens beyond where the stop would sit, the setup is already dead and there is no trade.
Invalidation, after entry: the stop is the invalidation and there is nothing to interpret.
When not to take it: outside the two windows, on a minor sweep, when the candle fails to close back inside the nearest level it took, or when the stop distance computes smaller than your broker’s minimum stop level.
One more, and it is the only judgement call in an otherwise mechanical set. Skip the setup when the sweep runs against a strongly trending market, because a level taken out during a determined trend is often just the trend continuing. Decide what counts as strongly trending for yourself, then apply it the same way every time.
Position Size Follows the Stop
The stop is set by the sweep candle’s extreme and the ATR at that moment, so two setups on the same instrument in the same week can carry very different stop distances. That single fact decides how the method is sized.
Risk a set percentage of the account on every trade, and calculate the position from the actual stop distance. Never a fixed lot size.
Fixed lots would make your results a record of how volatile the market happened to be, rather than of whether the method works. The percentage itself is your decision. Sizing from the stop rather than from habit is not.
A Short on the Dow, Walked Through Slowly
Three instances, each showing something the other two do not. They are not a sample of how often the setup works.
The Dow on a Friday morning, inside the New York AM window. An equal high sat just above the market at 52,545.20.
A candle pushed above it. The accumulated volume of the levels it took out cleared the threshold, so the event graded as a major sweep, and the same candle then closed back below the level it had just taken. Every condition is met, so the entry is the open of the next candle.
| The trade | Price |
|---|---|
| Swept level | 52,545.20 |
| Entry | 52,499.90 |
| Stop | 52,671.24 |
| Target | 52,157.22 |
The stop goes above the sweep candle’s high with the half ATR buffer added. Entry to stop is 171.34 points, and that distance is the one unit of risk everything else is measured in.
The target sits 342.68 points below the entry, which is twice it. Price reached it five candles later.
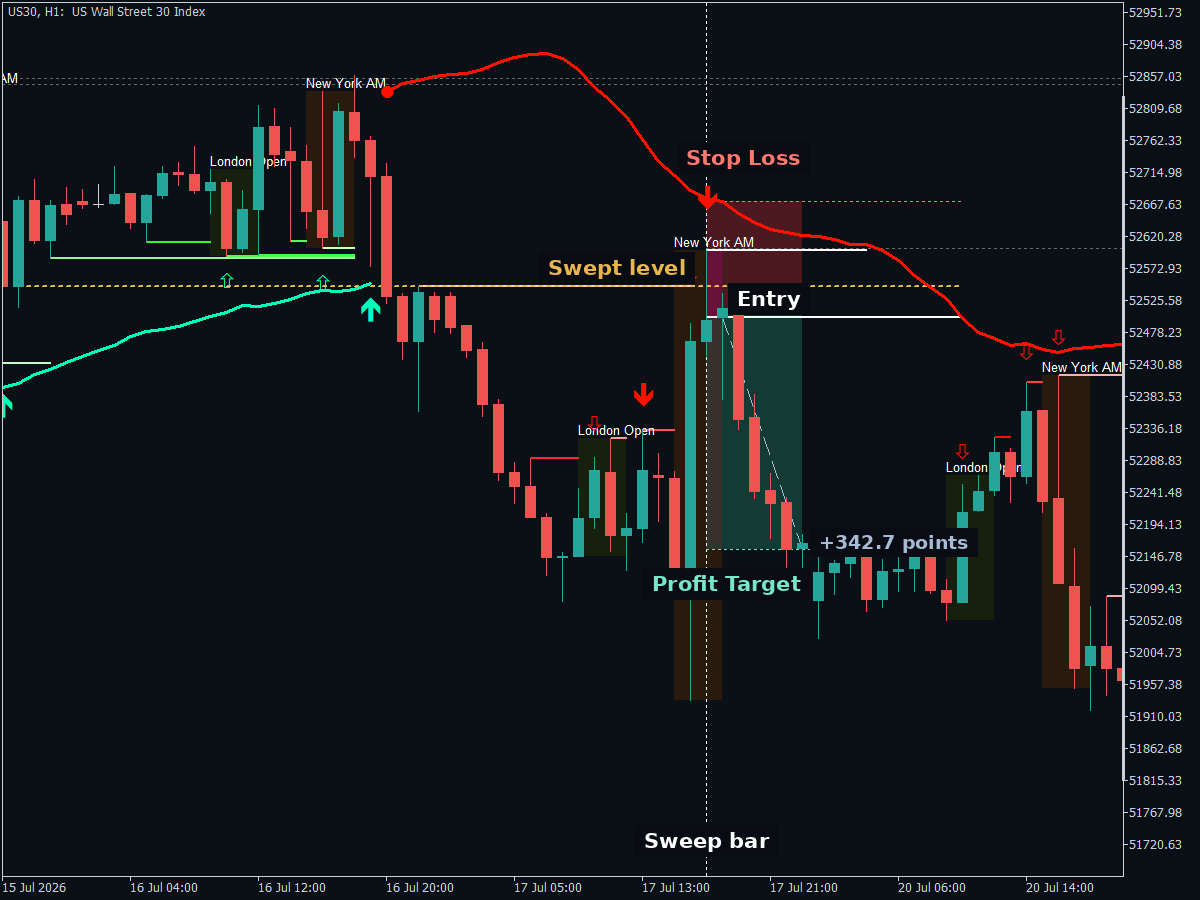
US30 H1. The swept level, the entry, the stop and the target.
Notice what the picture does not show. No third indicator, no oscillator agreeing, no higher timeframe confirmation. The level was mapped in advance, the sweep was graded at a close, and the trade was on.
That is the point of grading the event objectively. It removes the step where you talk yourself into or out of a setup.
The Same Rules, Long
The CAC 40 on a Monday morning, inside the London Open window. Equal lows at 8,695.60. A candle traded below them, graded major, and closed back above.
Entry at the next open, 8,696.70. The sweep candle’s low less the ATR buffer put the stop at 8,683.73, so the risk is 12.97 points. The target is twice that, 8,722.64, and price reached it three candles later.
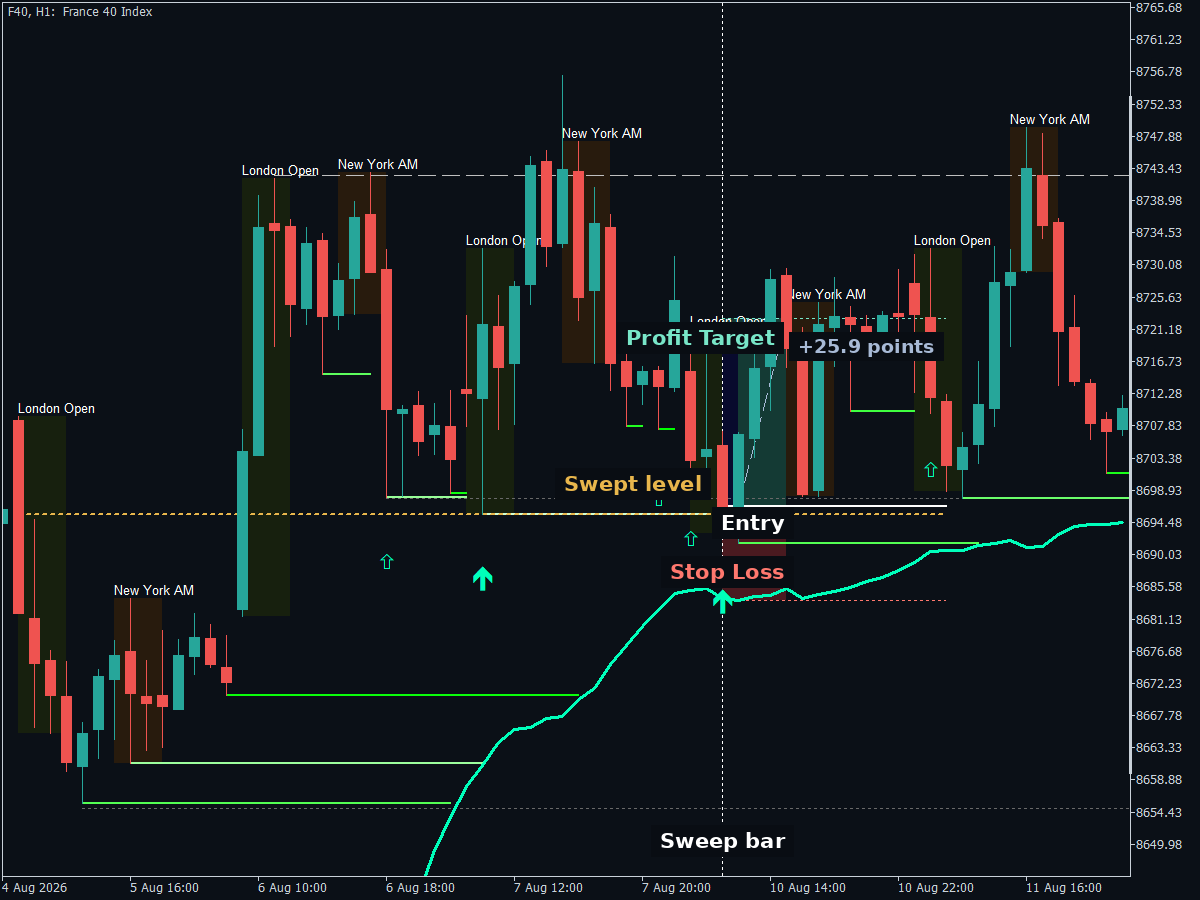
F40 H1. The same rules on the long side.
Thirteen points of risk on the CAC 40 against a hundred and seventy on the Dow is not a smaller trade. It is the same trade with a different stop distance.
Position size is what makes those two carry identical risk, which is why it is a rule here and not an afterthought.
How Long These Trades Last
Both trades finished within a handful of candles. That follows from the premise rather than from which two were shown.
The premise is immediate rejection. Price runs the stops resting beyond a level, finds nothing behind them, and turns. A rejection that is going to happen happens quickly, so a setup that works tends to work almost at once, and the same cut runs the other way: one that is wrong is usually wrong straight away.
Plan for that before you take the first one. A trader who sets this up expecting to hold for days will find it resolves while they are still watching the entry, and being surprised by the holding period is a common way a workable method gets abandoned in its first week.
What the Grade Does Not Tell You
A major sweep is a score for the volume behind the levels that were taken. It is not a forecast.
The product page for the tool that grades it says so plainly, which is worth repeating in a niche where plenty of pages imply the opposite. Major and minor labels describe the volume classification. They do not predict whether price must reverse. Here is what that looks like on a chart.
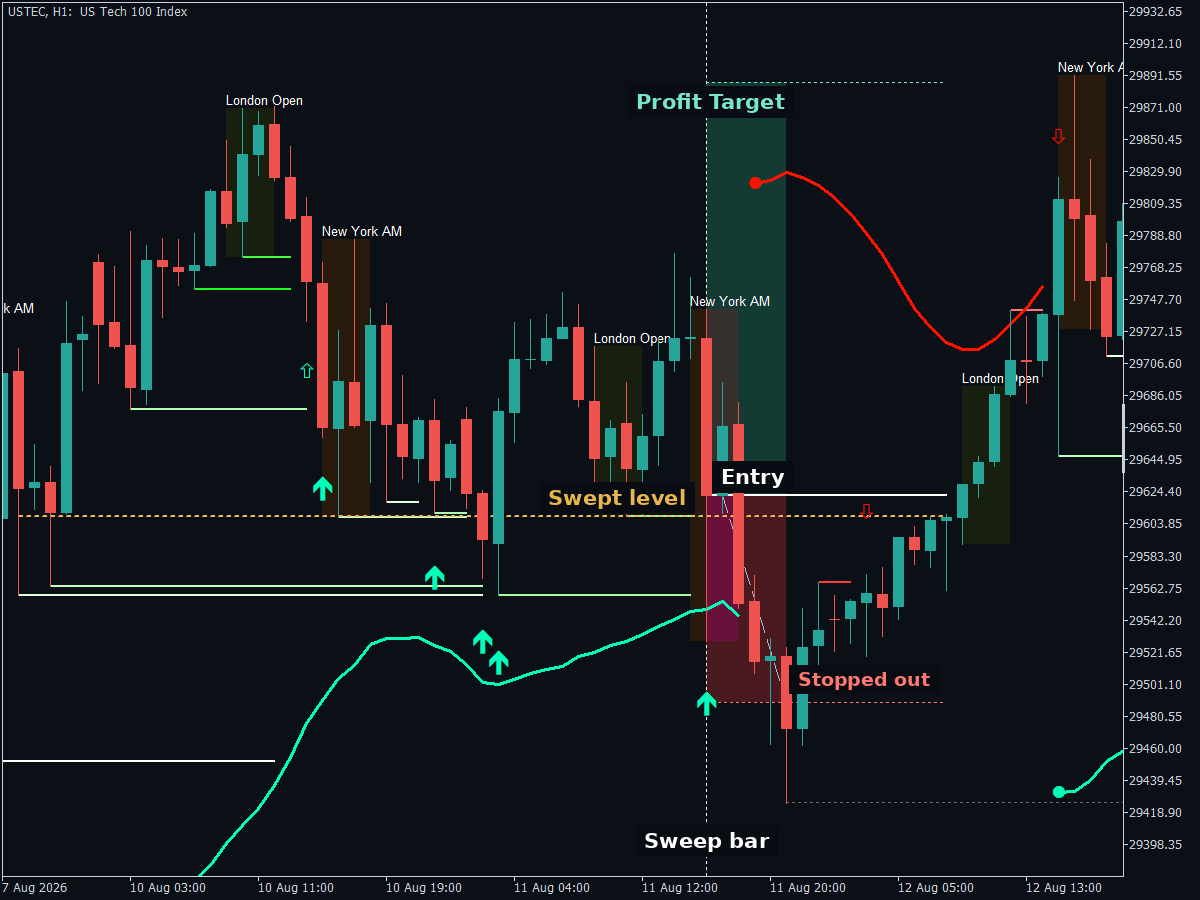
USTEC H1. A major sweep that did not reverse.
That sweep graded 121 against a threshold of 50, so it was nowhere near marginal. Price closed back inside the level, the entry triggered at the next open, and then the market carried on in the direction it had been going and took the stop four candles later.
Nothing was wrong with the signal. The grade did exactly what it claims to do, which is score the volume behind the levels that were taken. What price does after that event is a separate question, and no classification answers it.
Any page suggesting a high reading means a reversal is coming is selling a certainty the tool does not offer. Plan for it rather than being surprised by it, because the stop is the plan.
Setting the Chart Up in MetaTrader
Five steps, and the third one is where most setups quietly go wrong.
- Attach the three indicators to an H1 chart of your chosen index.
- Set the Major Sweep Threshold to 50 and leave the trend filter on its defaults.
- Set the session windows to London Open and New York AM, and confirm they are drawing in New York time rather than your broker’s server time.
- Add ATR with a period of 14. You are reading it for the stop buffer, not trading it.
- Wait for candles to close. Every rule here is evaluated on closed candles, so intrabar movement is noise.
The most common setup error is the clock. If your session boxes are drawn in server time and your broker sits two or three hours off New York, every window is wrong and the method is being applied at the wrong hours of the day.
Check it once against a known session open before you trade a single setup.
Where to Start
Index CFDs on H1. The reasoning is structural, and you should judge it rather than take it on trust.
The New York AM window is not an arbitrary block of hours. It brackets the US data releases at 08:30 and the cash equity open at 09:30. Orders that accumulated overnight arrive at once, and the stops resting above and below the overnight range are the most obvious pool of liquidity in the trading day.
Index products are therefore where the premise of this method, that levels get run by real participation and then rejected, has a structural reason to occur rather than an incidental one. Currencies trade continuously and have no equivalent moment.
Start where the reasoning points. Decide from what your own testing shows.
That window is also where participation is heaviest, and heavy participation is what a volume based grade needs in order to separate a real sweep from a quiet level break.
That is a reason to start there. It is not evidence that the method works there, and you should not read it as any. Finding that out is your job.
How to Test This Honestly
The rules are only useful if you can tell whether they hold on your market, your broker and your feed. Most of that work is avoiding the mistakes that make a weak result look convincing.
Check whether one trade is carrying everything: a summary is an average, and averages hide their inputs. Find the single best trade and take it out.
If the result collapses without it, one trade is carrying too much for any conclusion to stand on. That is one of the commonest ways a promising strategy turns out to be nothing.
Check whether a filter is carrying the result: this method has a session filter, and a session filter is a strong constraint. Run the test again with the sessions switched off.
If the result falls apart entirely, the filter is a material part of what you measured rather than a refinement on top of the sweep. Do this for every filter you add, one at a time, or you will never know which part of your system is doing the work.
Keep a window you have not looked at: split your history in two before you start. Develop on the first part. Do not open the second until you have finished deciding everything: the threshold, the buffer, the target multiple, the instruments. Then look once.
The reason for looking once is not ceremony. The moment you adjust a setting because of what you saw in the second window, that window has joined your development data and you no longer have an untouched sample. You cannot un-see it. A second attempt needs a third window, held back from the beginning.
Do not draw conclusions from a handful of trades: twenty trades tell you almost nothing, and a losing streak tells you even less. Work the odds out before you read anything into one.
At the break even rate of one win in three, the chance of losing six in a row is two thirds multiplied by itself six times. That is about one in eleven, so over a hundred trades you should expect to sit through it more than once. If your window produced few trades, the honest conclusion is that you do not know yet.
Work out your break even point before you measure anything: at a target of twice the risk, one win pays for two losses, so you need to win one trade in three simply to stand still. Costs push that threshold up a little.
That number is the yardstick, and a win rate without it means nothing in either direction. A rate that sounds low to the ear can sit above it, and a respectable sounding one can sit below.
On the win rate question: traders ask what win rate this method produces, and it is the right instinct with an inconvenient answer.
A win rate only means something attached to the configuration that produced it. The instrument, the timeframe, the threshold, the buffer, the target multiple, the sessions, the broker feed, the costs and the period.
Change any one of those and it is a different number. Anyone quoting one without the configuration attached is quoting a figure that cannot travel. Measure your own, on your own feed, and compare it to the break even point for the target you are using.
A practical note on reviewing history by eye: scrolling back through a chart is a reasonable first look, but the markers thin out the further back you go, because the level history is maintained over the recent part of the chart rather than the whole of it.
Use recent history for a visual sense of the setup, and the Strategy Tester for anything you intend to draw a conclusion from.
What This Method Does Not Do
Four limits, stated plainly, because a method whose edges are hidden is one you find out about with money on.
It does not tell you when a reversal will happen: it tells you a liquidity event occurred and how large it was. The trade is a bet placed after that event, with a defined invalidation.
It does not work equally everywhere: it is written for index CFDs on H1, for the structural reason attached to the New York session. Applying it to a currency pair on M5 is a different method wearing the same rules.
It fixes the target by the numbers, not by the chart: twice the risk is a decision that makes results interpretable. A trader who prefers to work to the opposing pool can see those levels on their chart, but that is a different exit rule and it needs testing on its own before it is trusted.
It requires patience most traders do not have: two windows a day, major sweeps only, on a handful of instruments, produces a small number of setups. The temptation to loosen the threshold or add a third session is the likeliest way this stops being the method you tested.
Putting the Rules on a Chart
Map the pools. Watch the two windows. Take major sweeps that close back inside the level. Stop beyond the sweep extreme with an ATR buffer. Target twice the risk.
Then go and find out whether it holds on your market, using those checks. Do that before you risk anything on it, and hold back a window you have not looked at, because that window is the only honest opinion you will get.
Three tools do the mechanical work in this method. The sweep filter grades the event by volume, the equal high and low mapper marks the pools before they are taken, and the kill zone tool draws the two session windows in New York time.
| # | Indicator | Link |
|---|---|---|
| 01 | KT Liquidity Sweep FilterGrades each sweep by the volume of the levels the candle took out. | Get Indicator |
| 02 | KT Equal Highs & Equal LowsMarks the liquidity pools on the chart before they are taken. | Get Indicator |
| 03 | KT ICT Kill ZonesDraws the London and New York windows in New York time. | Get Indicator |
None of the three replaces the rules. They take over the parts a human reads badly under time pressure: where the pools sit, when the window opens, and how much resting liquidity a candle actually took when it went through a level.
The rules themselves are on this page in full. Map the pools, watch the two windows, take the major sweeps that close back inside, and let the stop and the target do the rest. Then run it on your own market, on a window you have not looked at yet, and let that decide whether it earns a place in how you trade.
Built by the Keenbase Trading Lab
The Keenbase Trading Lab is the research side of Keenbase Trading, where trading systems are designed and tested before anything is published about them. A method reaches this blog only once it is complete enough to trade without guessing, which is why the rules above are stated in full and every chart on this page is a real instance with its symbol, timeframe and date named.
Keenbase Trading has been building MetaTrader indicators and Expert Advisors since 2018, alongside free tools and custom MQL5 development. The systems published here come from the same people who build the tools that run them.
Market conditions, broker feeds and symbol names vary, so confirm the behaviour on your own account before trading it.