Keenbase Trading » Blog » Multi-Timeframe EAs

Reading an EA Backtest Report: Why the Best Numbers Lie

Almost every guide to backtesting is written for the person who built the strategy and ran the test themselves.

The standard advice is familiar: use real ticks, demand high modeling quality, include realistic spreads, forward-test the system, and do not over-optimize. Good advice, and thoroughly covered elsewhere.

This guide is about the more dangerous situation: you are handed a backtest by someone else.

It may come from an EA vendor, a developer showing their work, or a seller on a marketplace. You did not run it, you cannot see how it was made, and all you have is the report.

The uncomfortable truth is that the report, by itself, tells you very little. Worse, the numbers traders tend to trust most are often the easiest to manufacture. Here is how to read a backtest report without being fooled.

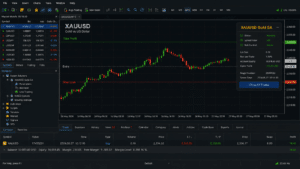
A MetaTrader Strategy Tester report with commonly trusted backtest metrics highlighted for scrutiny
High modeling quality and attractive headline metrics are reasons to investigate a backtest, not proof that the strategy is sound.

“99% modeling quality” describes the data, not the strategy

This is the figure sellers point to first, and it is the most misunderstood number in the whole report.

Modeling quality measures how completely the tester simulated price movement.

Ninety-nine percent means the test used detailed tick data rather than crude bar approximations. That is genuinely better, and its absence is a red flag.

But its presence proves nothing about whether the strategy works. A 99% modeling-quality test can still assume a fixed, unrealistically tight spread, zero slippage, and instant fills.

It tells you the price path was simulated in detail. It says nothing about whether the trading costs were realistic.

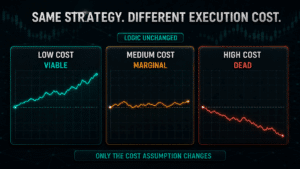
On many strategies, the costs decide everything. A high modeling-quality figure sitting on top of fantasy execution costs is a precise, well-rendered lie.

What actually matters is the spread, commission, and slippage the test assumed. The report does not always make that obvious.

If a seller shows you 99% quality but will not disclose the cost assumptions, they have shown you the reassuring number and hidden the deciding one.

A smooth equity curve can be a warning

Everyone wants the clean line climbing from left to right with no ugly drops. It feels like proof of a reliable system. Sometimes it is. Often it is the single most suspicious thing on the page.

An equity curve with almost no drawdown and a very high win rate can be the fingerprint of a system that hides losses rather than avoids them.

Grid and martingale logic can produce exactly this shape by holding losing trades unrealized until they turn green. That is why unusually smooth results should make you look harder, not relax.

The prettier the curve, the more you should want to know what happens to a losing trade.

A strategy that appears never to lose is usually deferring its losses, not escaping them.

The honest version of a good strategy has visible losing trades and real drawdown. It looks less impressive, but it is far more informative.

A suspiciously smooth equity curve compared with an honest equity curve showing real drawdowns
A smooth balance line can conceal risk. Credible results show how losses and drawdowns actually behave.

A high win rate is close to meaningless on its own

Win rate is the number sellers quote because it sounds like skill. Eighty percent winners feel like an 80% chance of success. It is nothing of the sort.

Win rate means nothing without the size of wins compared with the size of losses.

A system that wins 30% of the time with a three-to-one payoff can make money. A system that wins 80% of the time while its rare losses are five times larger than its wins can lose money steadily.

Quoting win rate alone, with no mention of average win versus average loss, is one of the oldest presentational tricks in the catalogue.

When someone leads with win rate, ask one simple question: What does the average loss look like next to the average win? If they do not want to answer, you have learned what you needed to.

A long track record proves survival, not durability

“Three years live” or “tested over fifteen years” sounds like robustness. It is worth less than it appears.

A long test proves only that the strategy survived the conditions inside that window. It does not prove it will survive the condition that ends it.

A system carrying hidden, uncapped risk can run for years while the market happens not to make the one move that breaks it.

Every additional year of survival makes the eventual break look less likely, right up until it happens.

Duration is not the same as durability. The useful question is not simply how long the strategy ran, but what its defined worst case is and whether the test period ever actually challenged it.

The report cannot show you overfitting

Here is the deepest problem with reading a backtest from the outside: it shows what a strategy did on data that already exists. It cannot show whether the strategy was shaped to fit that specific data.

This is overfitting, and it is a common reason a strategy that backtests beautifully dies in live trading.

A strategy with a dozen finely tuned parameters, each optimized across a wide range, may have been sculpted to match the exact wiggles of the historical data, like a key filed to fit one lock.

It can score brilliantly on the data it was fitted to and fall apart on anything new.

You cannot reliably spot overfitting in the final report because, inside the optimized window, the overfitted strategy can look perfect.

The best defense is out-of-sample evidence: results on data the strategy was never tuned against.

Ideally, that evidence is followed by a live or demo forward test after the logic and parameters were finalized.

If a seller can show only a backtest on the same period they optimized, you are looking at the inside of the lock, not proof that the key opens anything else.

Repainting can defeat the entire report

One more problem can undo even a careful review.

If the strategy relies on a repainting indicator, meaning one that quietly rewrites past values as new bars form, the backtest can see signals as they look after repainting, not as they appeared in real time.

The result inherits information that was never available at the moment of the trade.

Accuracy is overstated in a way live trading cannot reproduce, and nothing in the headline statistics reveals it.

This is why signals read from the current forming bar deserve extra scrutiny. Non-repainting logic evaluated on a closed bar is the safer foundation for a credible test.

A backtest is evidence about one strategy, on one dataset, under one set of assumptions. It is not a certificate of future performance.

How to evaluate someone else’s backtest

Reading someone else’s backtest comes down to interrogating what the report does not volunteer. Before you trust the equity curve, get clear answers to these five questions:

  • Were the costs realistic? Confirm the spread, commission, swap, and slippage assumptions.
  • What is the payoff ratio? Compare the average win with the average loss instead of relying on win rate.
  • What is the defined worst case? Identify hard limits on exposure, positions, drawdown, and total loss.
  • Is there out-of-sample proof? Ask for untouched data or a forward test conducted after optimization ended.
  • Do any signals repaint? Verify that entries use information that was genuinely available at the time.
A checklist of questions to ask when evaluating any trading strategy backtest
Use this checklist before accepting any third-party backtest as evidence.

A seller who answers these questions plainly may be showing you something real. One who keeps redirecting you to modeling quality and win rate is emphasizing the numbers chosen to reassure you while withholding the ones that decide.

What an honest backtest looks like

This is why, when we build for a client, the backtest is where we are most careful and least flattering.

It is easy to hand someone an impressive report. It is more useful to hand them one that tells the truth: tested with realistic costs, shown with its real drawdowns and validated on data it was never fitted to.

If you have a strategy you want built and tested in a way whose results actually mean something, let us know what you trade and how the rules work. We will test it honestly before you rely on it.

>>> Start a Custom Project

You Might Also Like:

Keenbase Trading » Blog » Multi-Timeframe EAs

Multi-Timeframe EA Development: The Higher Timeframe Is Not as Solid as You Think

Multi-timeframe trading makes intuitive sense. Check the daily to know the trend, then drop to the fifteen minute to time the entry.

The higher timeframe gives you the big picture, stable and slow moving, while the lower one is where you act. Almost every discretionary trader works this way, and automating it seems like a natural next step.

Then the multi-timeframe EA gets built, and it does something strange. It backtests beautifully and trades oddly live, or it trades fine live and cannot be backtested sensibly at all.

The reason is a single idea that breaks more multi-timeframe EAs than almost anything else: the higher timeframe you think of as solid is, to a running EA, still wet paint.
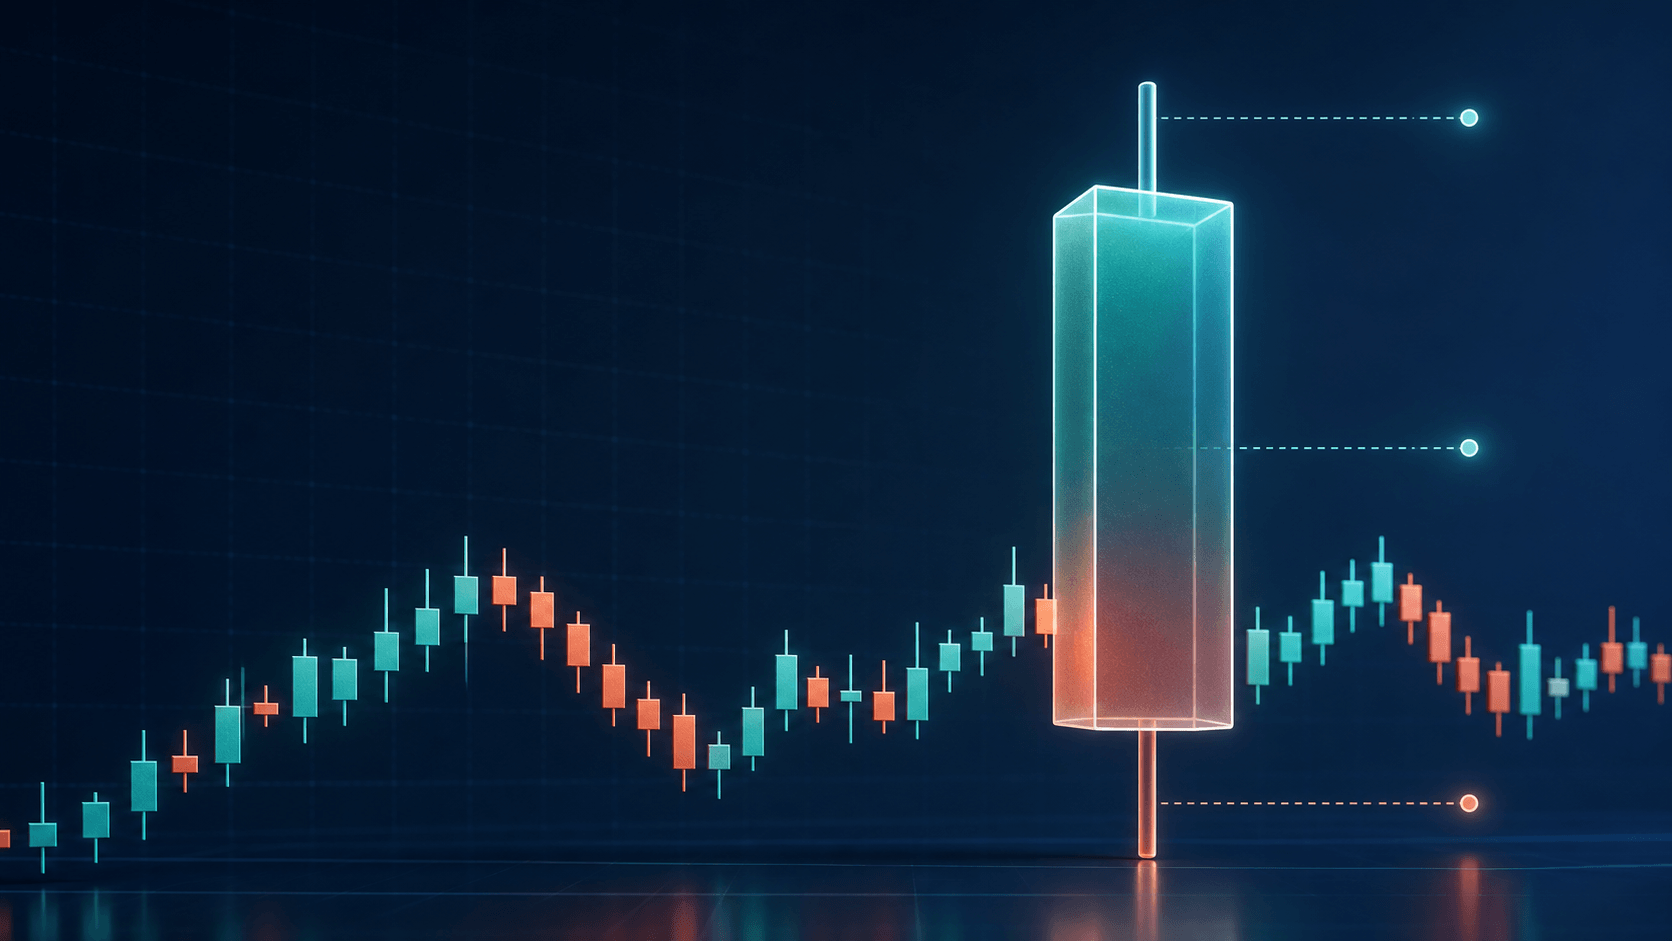
A forming higher-timeframe candle shown against the lower-timeframe bars completing inside it
A forming higher-timeframe candle remains a moving target while lower-timeframe bars close inside it.

The moving target at the center of a multi-timeframe EA

When you glance at the daily chart to check the trend, you are usually looking at closed daily candles. Yesterday's daily is finished. It will never change.

An EA running on the fifteen minute does not have that luxury. When it asks for the current daily candle partway through the day, it gets a candle that is still forming.

Its high, its low, and above all its close are not final. They will keep moving until the day ends.

The higher-timeframe reading the EA acts on at ten in the morning may be completely different from the one it would have acted on at four in the afternoon, even for the same calendar day.

This is the crux. The stability that makes multi-timeframe analysis feel reliable to a human exists only for closed candles.

The moment an EA reads a higher timeframe that has not closed, the solid reference becomes a moving target. The strategy is now reacting to a number that has not settled.

Two ways it goes wrong, and they are opposites

From that one fact, two failures grow, and they pull in opposite directions.

The first is acting on unfinished information. If the EA reads the current, forming higher-timeframe candle, it makes decisions on values that later change.

A daily that looks bullish at midday can close bearish. An EA that entered on the midday reading is holding a position justified by a state of the world that never finalized.

This is a genuine repaint, even though nothing in the code is technically repainting. The higher-timeframe value simply moved after the EA relied on it, and the trade was built on sand.

The second is the mirror image. It appears when someone tries to fix the first problem by reading only closed higher-timeframe candles.

Now the information is solid, but it can be stale. If the EA only looks at the last completed daily, it may trade all day on a picture that is up to twenty-four hours old.

Neither choice is simply correct. The right answer depends on the strategy.

Choosing deliberately between a forming candle for responsiveness and a closed candle for reliability, and knowing the trade-off you accepted, is a large part of building a multi-timeframe EA properly.

The failed ones almost always made the choice by accident.

The two opposing failure modes of multi-timeframe EAs, acting early on unsettled data or late on stale data
The two opposing risks: acting early on unsettled data or waiting for a stale closed candle.

Why the backtest makes it worse, not clearer

You would hope the strategy tester would expose all this. Often it hides it instead.

Testing an EA that depends on several timeframes at once is genuinely hard. Experienced developers often encounter higher-timeframe values displayed incorrectly, misaligned data, and results that do not match live behavior.

The tester has to reconstruct how multiple timeframes looked at every moment in the past and feed them to the EA in the correct sequence.

Small errors in that reconstruction produce results that are confidently wrong.

The trap underneath is look-ahead bias. If the tester, or the code, lets the EA see the higher timeframe's final values while it is still meant to be inside that period, the backtest quietly hands the strategy tomorrow's newspaper.

The results look excellent because the EA effectively knew how each higher-timeframe candle would close before it closed.

None of that advantage exists live. The strategy that shone in testing falls flat in reality, while the cause remains invisible on the report.

A multi-timeframe EA is one of the easiest places for this bias to creep in because synchronization between timeframes is where the mistakes hide.

What building a multi-timeframe EA properly requires

Once you see the moving-target problem, the real work becomes clear. Most of it is not about the entry logic.

It is about deciding, for each timeframe, whether the strategy reads forming or closed data and accepting the trade-off that choice carries.

It is about synchronizing the timeframes so that, at every moment, the EA sees each one as it genuinely looked then, with no leakage of future information.

It is about testing in a way that reproduces live sequencing faithfully, so the backtest describes the same strategy that will actually run.

It is also about handling the plumbing: data-not-ready states and history errors that can otherwise feed the EA bad values it will trade on without complaint.

The exotic part, such as the trend filter, the entry trigger, and the confluence between timeframes, is the easy half.

The hard half is making sure every timeframe tells the truth about a specific moment, and nothing about a moment that had not happened yet.
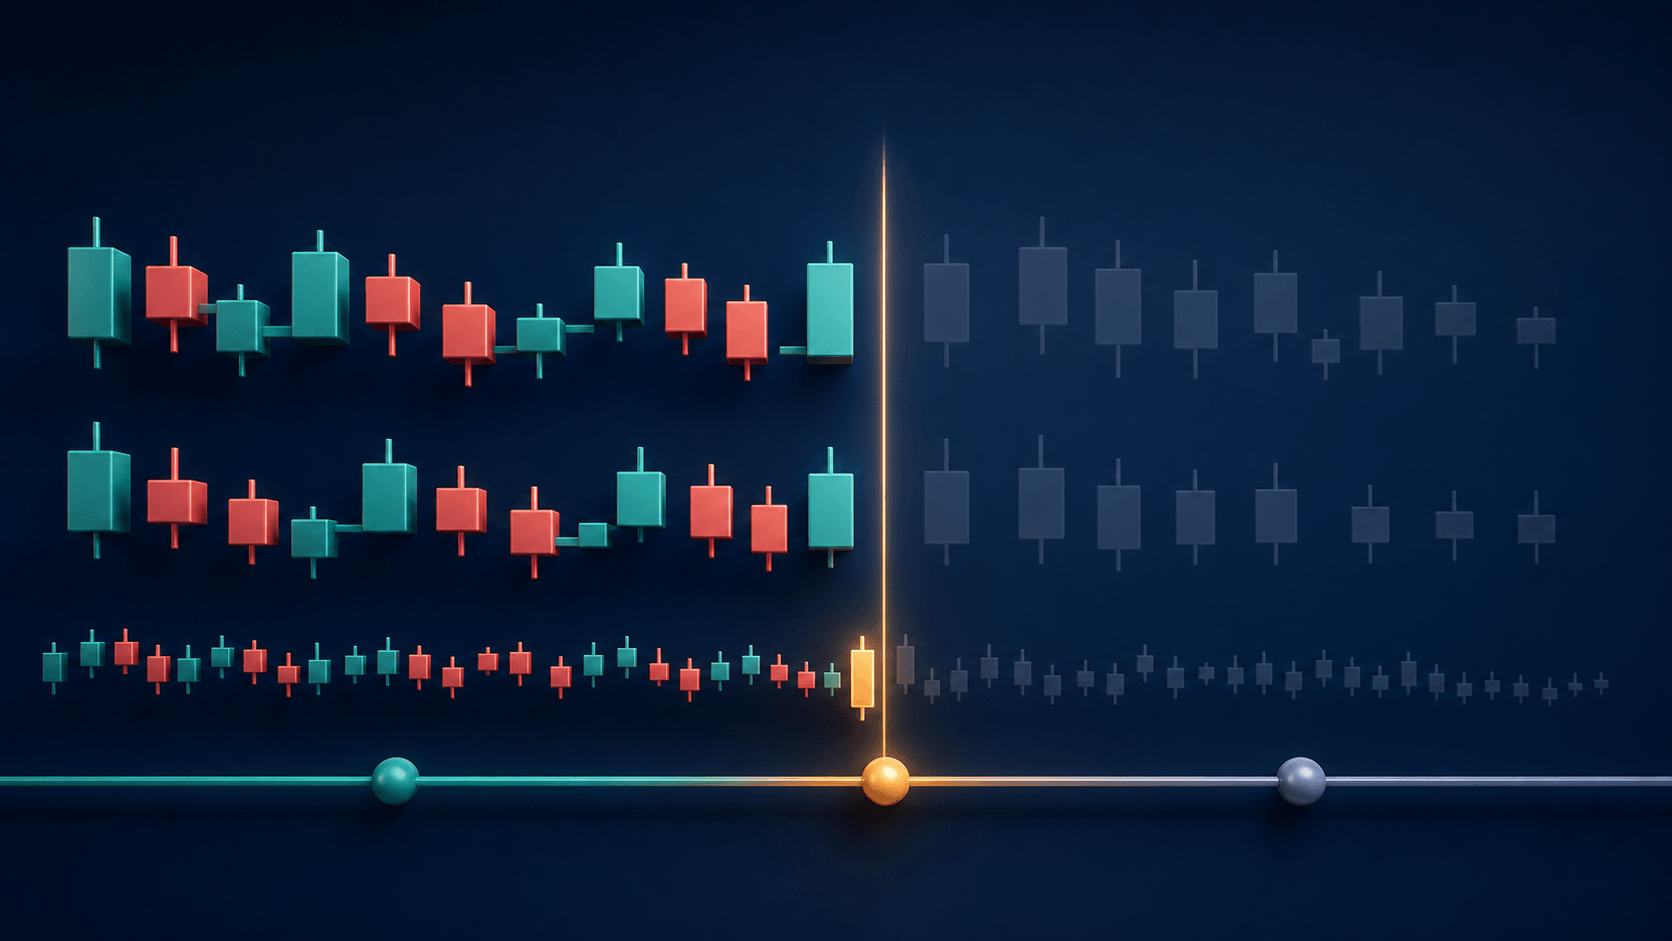
Correct multi-timeframe synchronization showing an EA reading each timeframe as it looked at one moment in time
Correct synchronization stops the EA from reading beyond the present moment.

This is what separates an EA that merely references two timeframes from one that trades them correctly.

When we build multi-timeframe systems at Keenbase, synchronization and the forming-versus-closed decision are where most of the careful work goes.

They are where these strategies silently break, and where a client comparing quotes will rarely be told the hard part exists.

If you have a top-down or multi-timeframe strategy you want automated with real information instead of accidental hindsight, tell us how you read the timeframes and we will build it to match.

>>> Start a Custom Project

You Might Also Like:

>