
Non Repaint Arrow Indicator Explained: Spot Clean Entries Like a Pro
A non repaint arrow indicator is designed to keep each signal fixed after its candle has closed. That gives you a stable chart record for review, journaling, and forward testing. The key detail is timing: a signal on the still-forming candle may change before the candle closes. Non-repainting improves transparency, but it does not guarantee that every arrow will be accurate or profitable.
Why Non-Repainting Indicators Matter in Forex Trading
Repainting occurs when a historical signal moves, disappears, or appears only after later price data arrives. A chart can then look cleaner in hindsight than it did while the market was live.
That matters because a changed history can make manual review and backtesting overstate how usable a signal was at the time.
A genuine closed-bar signal should remain on the same candle after new candles form, the chart is refreshed, and the platform is reopened. Always separate this completed-bar test from what happens on the current candle.
Stable signals make an indicator easier to audit and compare. Accuracy still depends on the signal logic, market conditions, settings, execution, and risk management.
Introducing the ACB Breakout Arrows Indicator
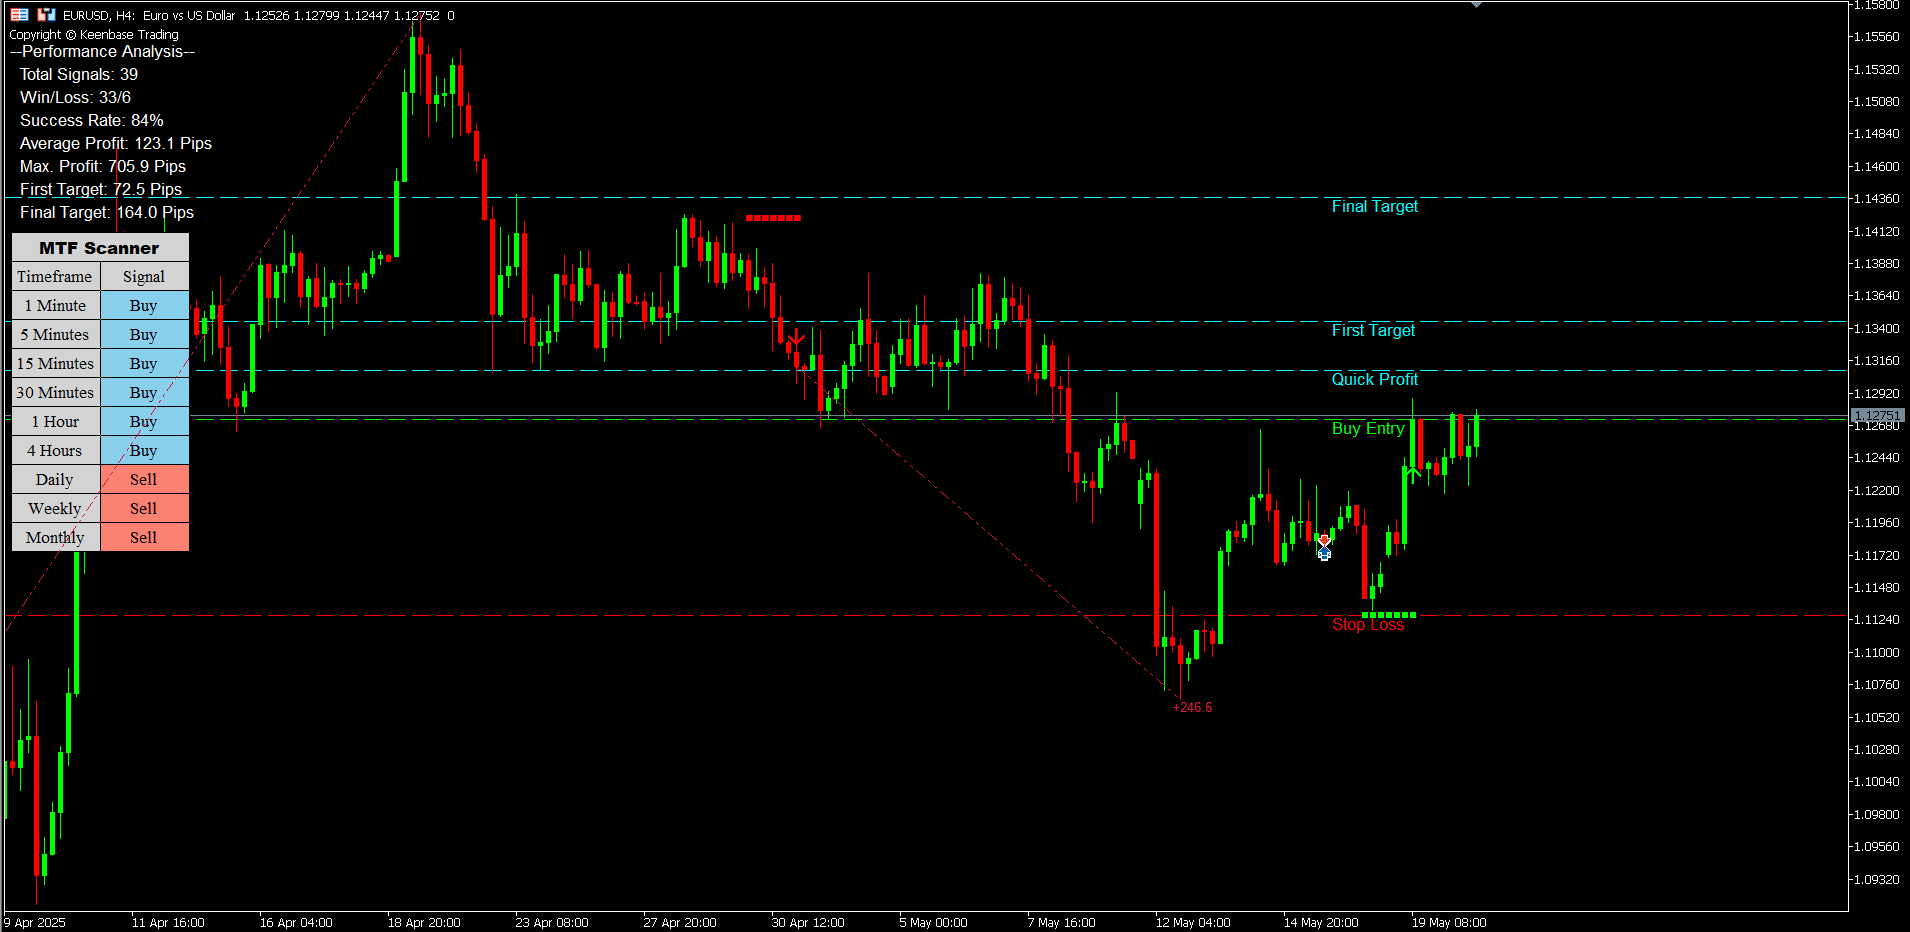
For traders who prefer clear breakout visuals, the ACB Breakout Arrows Indicator from Keenbase provides a focused MT4/MT5 workflow with buy and sell arrows, adjustable signal sensitivity, and chart-based trade-reference levels.
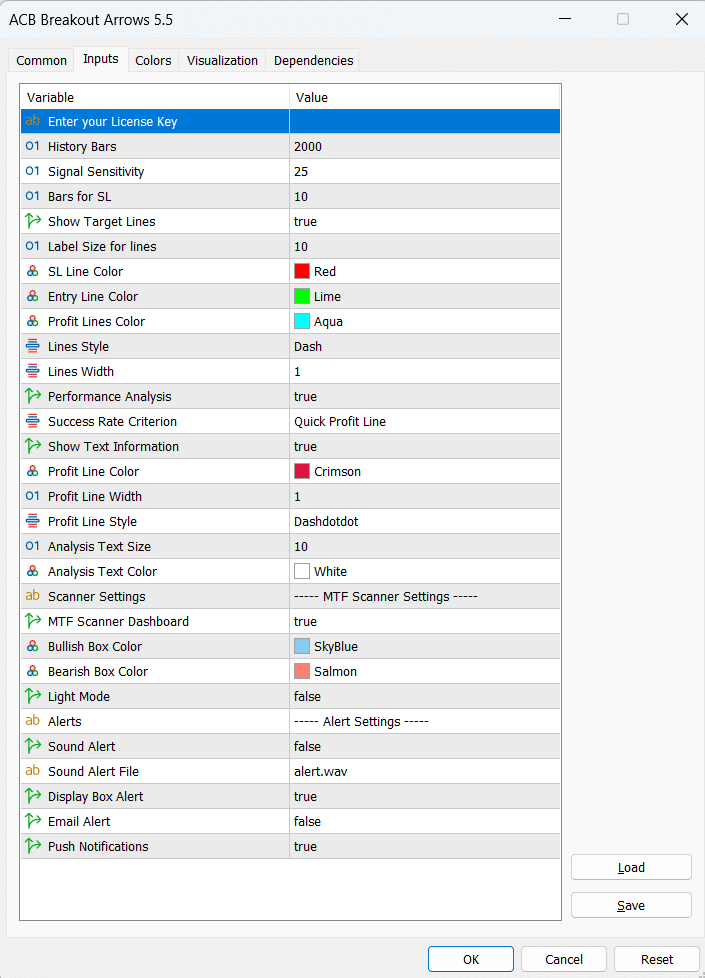
Its controls let you tailor how breakout conditions are displayed, while alerts can bring new signals to your attention through sound, popup, email, or push notification channels.
It also includes optional Performance Analysis and works with a separate multi-timeframe scanner. These tools support faster review and monitoring, while the trader remains responsible for confirming each setup and testing how signals behave on completed candles.
Key Features That Set ACB Breakout Arrows Apart
- Clear Buy and Sell Arrows: See the detected direction directly on the chart and confirm the arrow after the candle closes.
- Stop Loss and Profit Target References: Display chart levels that help you plan a structured trade before choosing your own position size.
- Adjustable Signal Sensitivity: Tune the detection setting to suit the symbol, timeframe, and amount of signal activity you want to evaluate.
- Performance Analysis: Review the optional analysis panel using the selected success criterion to compare signal behavior.
- Flexible Alerts and Quick Profit Line: Use sound, popup, email, or push alerts, plus a chart reference you can incorporate into a documented trade-management plan.
If you are looking to automate the drawing of trendlines for support and resistance analysis, there are tools designed specifically for that purpose.
Understanding Arrow Indicators in Forex Trading
Arrow indicators turn a set of price conditions into visible buy or sell markers, making a busy chart quicker to scan.
Each arrow shows that the indicator's programmed conditions were detected. It does not, by itself, confirm the next price move.
This visual simplicity offers several advantages:
- Faster Chart Reading: A visible marker highlights where the indicator detected its conditions.
- Clear Direction: Buy and sell arrows show the direction of the setup being evaluated.
- Consistent Review: Using the same settings creates a repeatable basis for screenshots, notes, and forward tests.
Treat the arrow as the start of a decision process, not the entire decision. Confirm the candle has closed, check market context, define invalidation, and decide risk before acting.
The Problem with Repainting Indicators
Repainting becomes a problem when the historical chart no longer matches what was visible at decision time. Signals that move or disappear can make an indicator look stronger in hindsight and can distort a strategy review.
Do not judge repainting from a static screenshot alone. Record a live signal, wait for the candle to close, note its candle and price, then refresh or reopen the chart after more candles form. A closed-bar arrow that remains in the same place passes that observation. Repeat the test across symbols and timeframes because one example is not proof.
Benefits of Non-Repainting Buy/Sell Signal Indicators
A well-verified non-repainting workflow offers practical benefits because it keeps the evidence you review consistent:
Trading Confidence
Stable completed-bar records reduce second-guessing about whether the chart changed after the fact. They do not remove losing trades, but they make it easier to follow written rules and review decisions calmly.
Effective Strategy Development
When past markers remain fixed, you can journal entries, invalidations, stop placement, and target handling against the same chart evidence. Forward testing then shows how the full workflow performs under live conditions.
Accurate Performance Measurement
Non-repainting supports cleaner measurement, but historical signals are not automatically identical to live execution. Compare screenshots or logs made at the close with the later chart, include spreads and slippage where relevant, and evaluate enough samples before drawing conclusions.
Real-World Implementation of the ACB Breakout Arrows Indicator
When a buy (green) arrow appears:
- Wait for the signal candle to close, then confirm the arrow remains visible.
- Check whether price structure and your higher-timeframe context support the long idea.
- Use the displayed stop-loss and profit-target references to plan invalidation and reward, then set a position size that matches your own risk limit.
When a sell (red) arrow appears:
- Wait for the signal candle to close, then confirm the arrow remains visible.
- Check whether price structure and your higher-timeframe context support the short idea.
- Use the displayed stop-loss and profit-target references to plan invalidation and reward, then set a position size that matches your own risk limit.
The ACB chart levels provide a clear planning framework, while optional alerts reduce the need to watch one chart continuously. Treat each level as a reference, not an instruction: confirm the setup, size the trade independently, and document what was visible when the candle closed.
How to Avoid False Signals

A non-repainting arrow can still be a losing signal. Use a repeatable filter instead of assuming stability equals accuracy:
- Wait for Candle Close: Base decisions on completed candles so temporary intrabar conditions are not mistaken for confirmed signals.
- Confirm Market Context: Compare the setup with higher-timeframe direction, nearby support and resistance, and current volatility.
- Define Risk Before Entry: Decide the invalidation level, position size, and acceptable reward-to-risk before placing a trade.
- Respect Scheduled News: Major economic releases can quickly change volatility and execution conditions.
Advanced Features for Experienced Traders
The indicator also includes tools that can make monitoring and review more convenient:
Breakeven Feature
The "Quick Profit Line" adds a visible management reference that you can incorporate into a documented breakeven or partial-exit rule. Test that rule before using it with live capital.
Multi-Symbol Scanner Option
For traders who monitor multiple currency pairs, there is an ACB Breakout Arrows Scanner that provides a separate multi-timeframe view so you can spot symbol and timeframe signals without opening every chart. Confirm each candidate on its own chart before acting.
Conclusion: Elevating Your Trading with Reliable Signals
A useful non repaint arrow indicator should make its behavior easy to verify. Focus on completed candles, keep screenshots or a journal, and confirm that closed-bar arrows remain fixed after refresh and after later candles form.
ACB Breakout Arrows brings buy and sell arrows, adjustable sensitivity, stop-loss and profit-target references, optional Performance Analysis, alerts, and scanner support into a clear MT4/MT5 workflow. Those features make it easier to organize analysis while leaving confirmation and risk decisions in your hands.
Want a cleaner way to review breakout-arrow setups? Explore the ACB Breakout Arrows Indicator and test its completed-bar behavior and settings on your own symbols and timeframes.
Take Your Trading to Next Level
You Might Also Like: