
Mastering Advanced Ichimoku Trading Strategies
The most common complaint about Ichimoku is not that it loses. It is that nothing happens.
Six conversations in four years of our support history say a version of the same thing. They have traded Ichimoku by hand for years, they buy something to automate it, and the chart sits there.
One of them put it plainly: he trades Ichimoku manually all the time, ran a backtest, and it never took a single trade.
Almost always, nothing is broken. The method is doing the one thing nobody told them it does.
Ichimoku is a filter before it is a signal, and a filtered system trades rarely. How rarely is a number, and it is a number nobody publishes.
Nor does anybody publish which of the common Ichimoku variants is worth trading, or what the cloud filter buys you. Every guide lists the strategies. None of them says which one to use.
So we built the one that answers it. The Ichimoku Cross System is a complete mechanical method: one instrument, one timeframe, fixed settings, an entry, a stop, a target and an exit, with five years of results behind it. Every rule is written out below, and so is everything those rules produced.
What The Ichimoku Cross System Settles
Three questions, answered with numbers rather than with preference.
Which entry, and which exit. The Tenkan-Kijun cross and the Kumo breakout are the two variants people actually trade. One of them carries the system, and the exit matters more than the entry does.
What cloud confirmation costs and earns. This is the thing most Ichimoku traders argue about and none of them measure. The answer is specific, it holds across eight instruments, and it is not the answer most people expect.
Whether the standard 9-26-52 settings hold. Every chart in the world is drawn with them. They are not the strongest of the sets we ran, and the difference is large enough to matter.
The system that came out of it has no judgement calls in it. It is written out in full below, so it can be traded, argued with, or tested by anyone who wants to check it.
The Five Lines, And Which Two Decide
Ichimoku draws five lines, and this system reads three of them. The table is here because the rest of the page names them constantly, and because the numbers in brackets are the ones this system uses rather than the defaults.
| Line | What it is | What this system does with it |
|---|---|---|
| Tenkan-sen (10) | The midpoint of the highest high and lowest low of the last 10 bars. | Half of the entry signal. Its cross of the Kijun-sen is the trigger. |
| Kijun-sen (30) | The same midpoint over the last 30 bars. | The other half of the entry, and the stop reference. |
| Senkou Span A | The average of those two lines, plotted forward by the Kijun-sen period, so 30 bars ahead here. | One of the two cloud edges the signal bar has to close clear of. |
| Senkou Span B (60) | The midpoint over the last 60 bars, plotted forward by the same 30. | The other cloud edge. |
| Chikou Span | The close, plotted the same 30 bars back. | Nothing. It sits outside this system. |
The space between Senkou A and Senkou B is the cloud, or Kumo. The support and resistance levels traders draw by hand do something similar to the Kijun-sen here, which is why the stop sits on it rather than at a fixed distance.
The Complete Rules
Everything needed to trade it or to test it. No judgement calls.
Instrument and timeframe: USDJPY, one hour chart.
Indicator settings: Tenkan-sen 10, Kijun-sen 30, Senkou Span B 60.
Long entry: Tenkan-sen crosses above Kijun-sen, and the signal bar closes above both Senkou A and Senkou B. Enter at the close of that bar.
Short entry: Tenkan-sen crosses below Kijun-sen, and the signal bar closes below both Senkou A and Senkou B. Enter at the close of that bar.
Stop loss: at the Kijun-sen, plus a buffer of 0.4 times the 14 period ATR, placed below for longs and above for shorts.
Target: three times the stop distance, fixed, placed when the trade is opened.
Exit: the stop or the target. Nothing else. An opposing cross does not close the trade, and that single rule does more for the result than the entry does.
Risk: 1% of the account per trade, which is what every figure on this page assumes.
No trade is skipped for news, session, volatility or anything else. Every signal that meets the entry rule is taken.
The cloud condition inside the two entry rules is optional, and both versions are published below. With it you take about half as many trades and carry a much smaller worst case. Without it you trade twice as often for a higher total and a rougher ride.
The Rules On One Page
The rule set above is written to be read in one screen and traded from. If you want it beside the chart, take the rules sheet, which carries the settings, the entry, the stop, the target and the exit, and nothing else.
Download the Ichimoku System Rules Sheet (PDF)
The Rules On A Chart
Four trades the rules produced, on four different years of USDJPY history. Each one shows every element of the system at once: the cross, the signal bar, the cloud it had to close clear of, the stop at the Kijun-sen with its buffer, and the target three times that distance away.
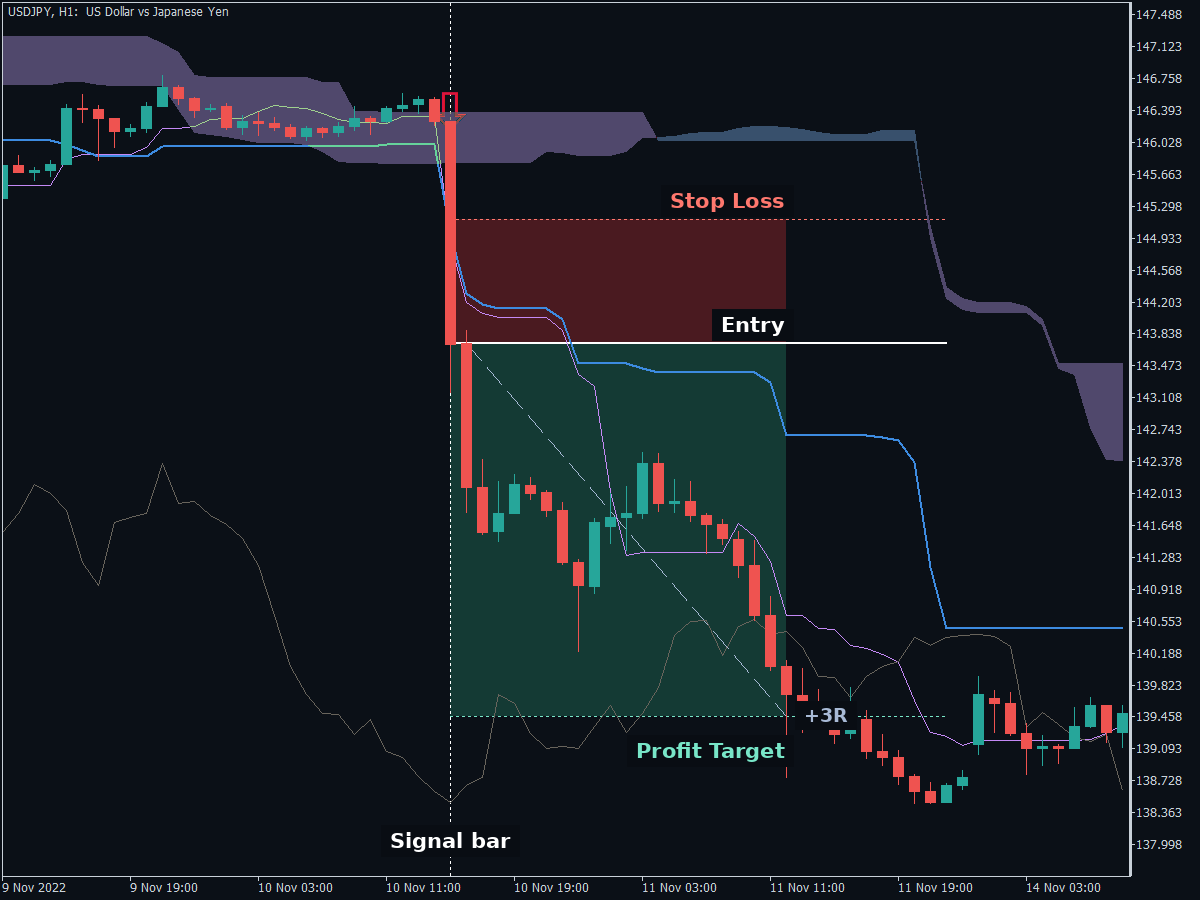
A short. The cross fires, the signal bar closes below both cloud lines, and the stop goes above the Kijun-sen plus its ATR buffer. The red band is the risk and the green band is three times it.
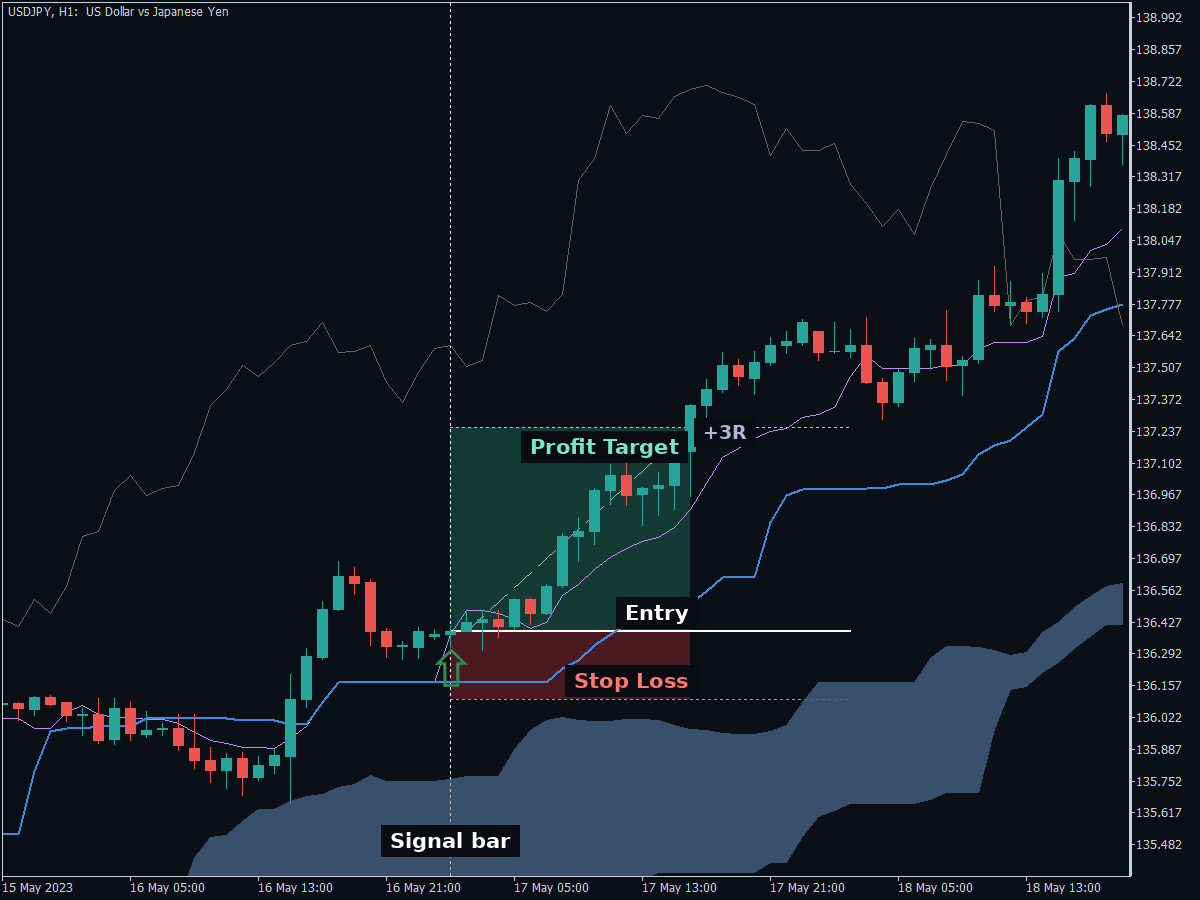
A long with the cloud far below the cross, which is the easy case. Confirmation costs nothing when price is already well clear of the cloud, and the whole move happens above it.
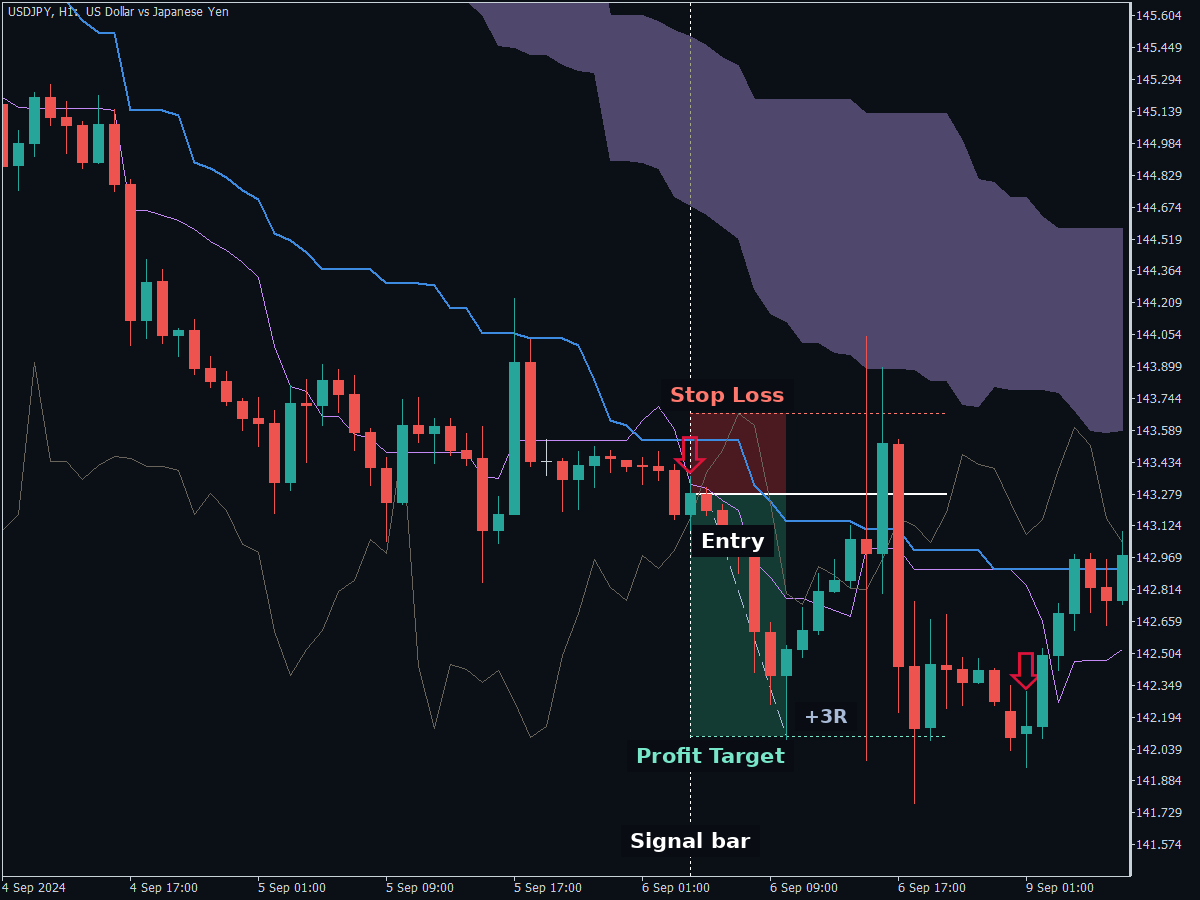
A short where the target filled and price then came straight back through the entry. That is the argument for a fixed target placed when the trade opens rather than an exit decided while watching.
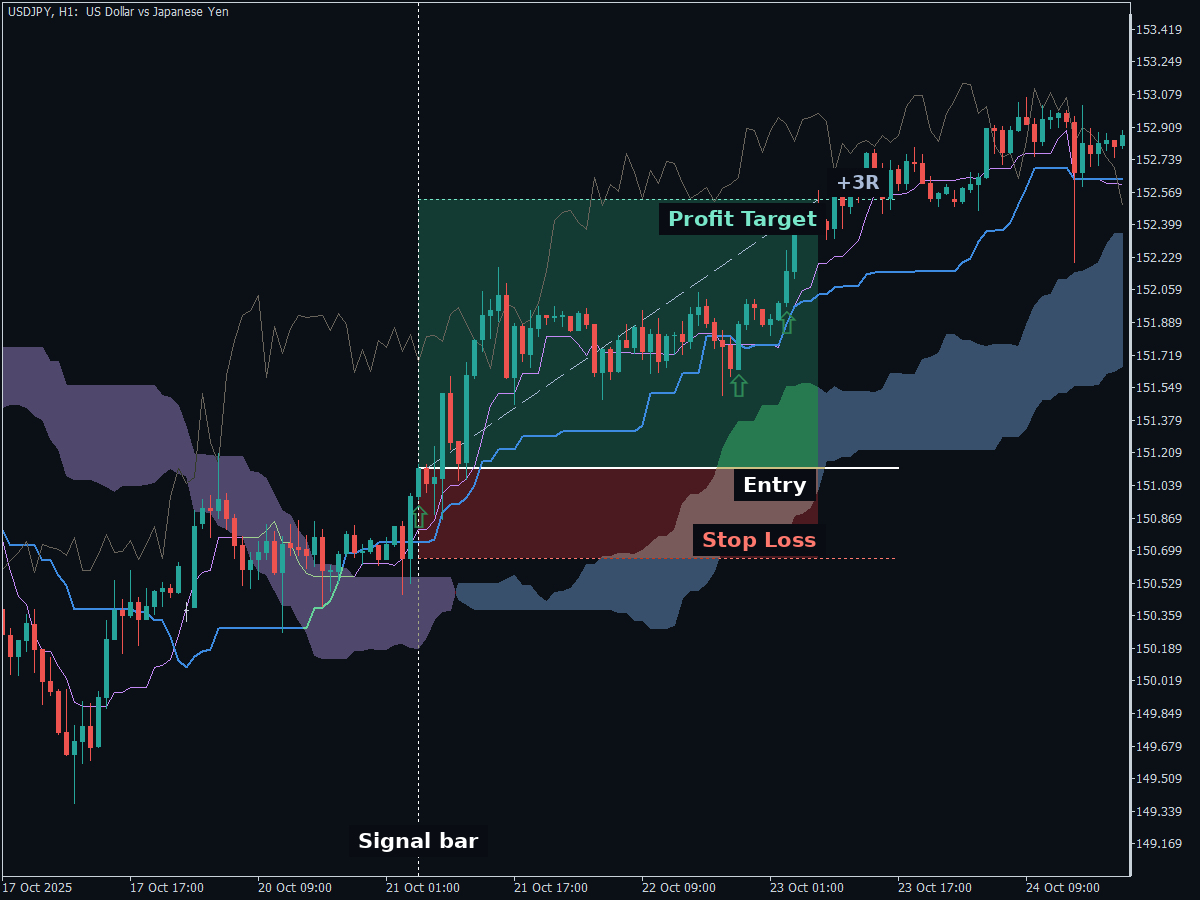
A long that crossed up out of the cloud and then spent most of its run inside the reward band, stalling twice, before the target filled. Holding a fixed target looks like this more often than it looks like a straight line.
Every winner in a fixed target system lands on the same figure, which is why each of these reads +3R. That is not a coincidence worth hiding, it is the target doing what it was set to do.
What Five Years Produced
Five years of USDJPY H1, September 2021 to September 2026, both versions of the cloud condition. A 10,000 account at 1% risk per trade, with the broker’s own spread, commission and swap taken out of every trade.
| Trades | Net profit | Profit factor | Expectancy per trade | Win rate | Max drawdown | |
|---|---|---|---|---|---|---|
| With cloud confirmation | 329 | +14,224 | 1.41 | 43.23 | 33.1% | 15.5% |
| Without confirmation | 603 | +23,372 | 1.32 | 38.76 | 31.8% | 26.6% |
Original Keenbase test data, from one continuous run per version rather than a best case stitched together.
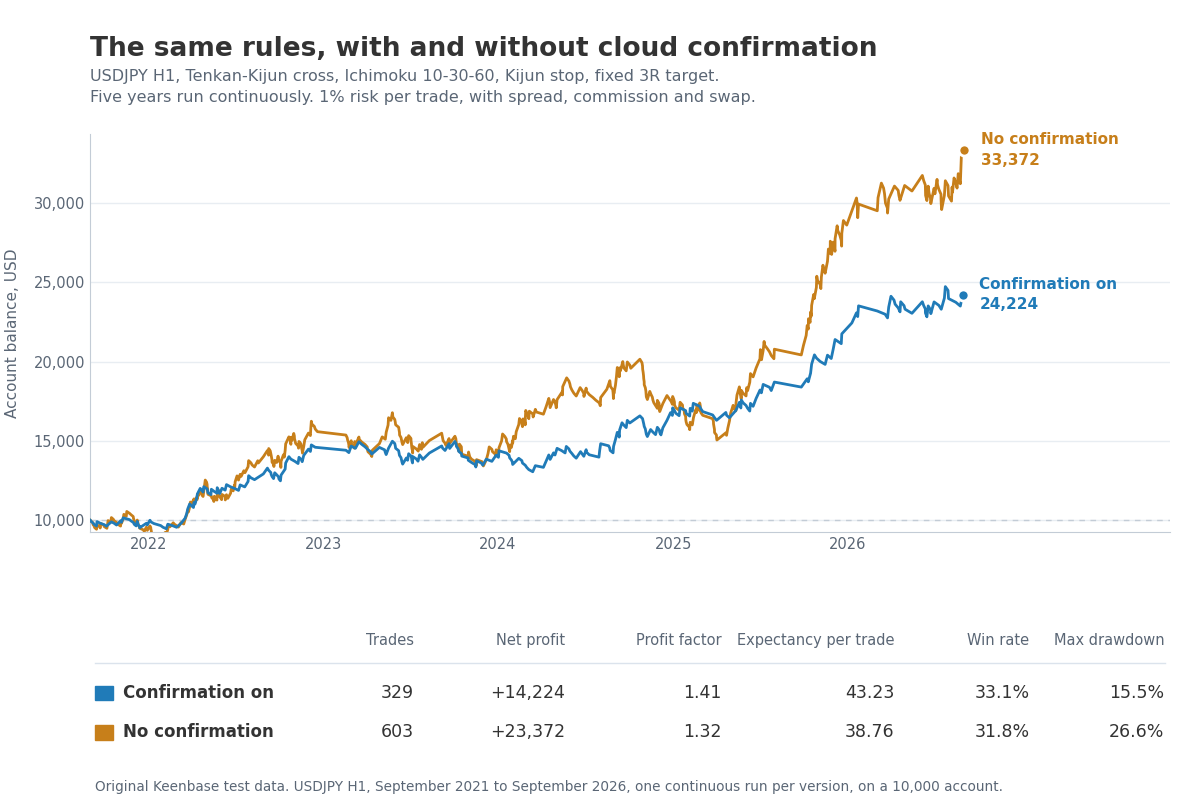
The same rules over five years, with and without the cloud condition. The unfiltered line finishes higher and spends the journey in deeper holes. Both spend eighteen months from early 2023 going nowhere before the move that made the five years.
Two things in that picture are worth more than any single number here.
The cloud condition costs return and buys smoothness. Without it the account finishes about 9,000 higher, because it takes 603 trades instead of 329. With it each trade earns more, 43.23 against 38.76, and the deepest hole is 15.5% instead of 26.6%. One of those curves is comfortable to hold and the other is not.
Neither line is smooth, and the flat stretch is the real lesson. Both spend most of 2023 and the first half of 2024 paying costs and getting nowhere. Anyone who started this system in January 2023 would have spent a year and a half wondering whether it worked, and would have been right to keep going.
That is worth more than the headline figure, because it is the part a five year total hides. The equity line is how a system feels. The total is only how it ended.
You Can Have A 50% Win Rate. Here Is What It Costs.
One in three wins. For a lot of readers that number ends the page, so it is worth dealing with properly instead of explaining it away.
Start with the part nobody says out loud. Your win rate is not a property of your system. It is a setting. Move the target closer and the win rate goes up. Move it further away and it goes down. You choose it.
So here is the same system, same entry, same stop, same instrument, with nothing changed but where the target sits.
| Target | Trades | Win rate | Expectancy per trade | Profit factor |
|---|---|---|---|---|
| 1.0R | 279 | 53.0% | 1.88 | 1.04 |
| 1.5R | 265 | 43.8% | 5.37 | 1.08 |
| 2.0R | 245 | 39.2% | 14.62 | 1.19 |
| 2.5R | 218 | 35.3% | 21.67 | 1.25 |
| 3.0R | 211 | 31.3% | 22.96 | 1.25 |
USDJPY H1, three years of history, cloud confirmation on, everything fixed but the target.
The 50% win rate is available and it is right there at the top of the table. Set the target at one times the stop distance and 53% of your trades win. It also earns 1.88 per trade against 22.96, which is a twelfth of the edge, at a profit factor of 1.04 that will not survive a bad month.
Run the same table without the cloud condition and the 1.0R row is negative, expectancy -0.72 over 582 trades. A system that wins more than half its trades and loses money is not a trick question. It is the most common way retail traders lose, and it is what optimising for a win rate produces.
That is the whole of the answer. A win rate is bought, and the price is expectancy.
Expectation And Reality
| What most traders expect | What the test shows |
|---|---|
| A good system wins most of its trades. | This one wins one in three and makes money. |
| A low win rate means a weak system. | The lowest win rate in the table has the highest expectancy. |
| The win rate is a property of the system. | It is a setting. Move the target and it moves. |
| 50% is a floor worth defending. | Defending it here costs about a twelfth of the edge. |
| More winners means a smoother ride. | The 1.0R version has the larger drawdown, 19.3% against 15.5%. |
The last row is the one that surprises people. Winning more often did not make the equity curve calmer. It made it choppier, because the wins were too small to cover the losing runs.
What the number actually has to sit next to
| Confirmation on | No confirmation | |
|---|---|---|
| Trades won | 109 of 329, 33.1% | 192 of 603, 31.8% |
| Average win | 447 | 502 |
| Average loss | 153 | 172 |
| Win to loss size | 2.92 to 1 | 2.91 to 1 |
Over a hundred trades with confirmation on, thirty three win at about 447 each, which is 14,751. Sixty seven lose at about 153 each, which is 10,251. The hundred trades leave about 4,500 behind.
One in three is what winning looks like when the wins are nearly three times the size of the losses.
The real cost, which is not the win rate
Not money. Patience, and more of it than most people plan for.
The longest run of consecutive losses was 11 trades, with confirmation on, ending in November 2023. Thirteen in a row without it. At five or six trades a month, eleven losses is roughly two months of being wrong every single time.
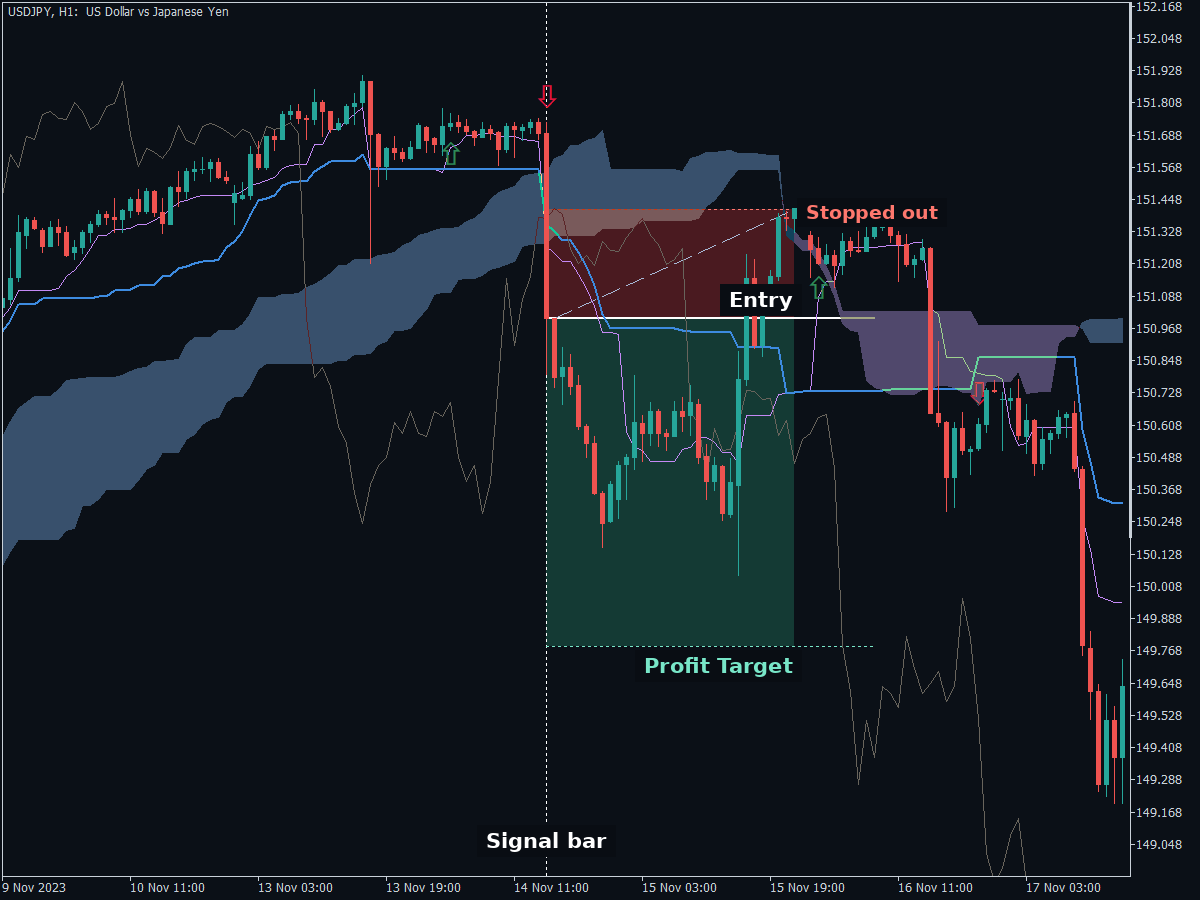
One of them. The cross fired, the close cleared both cloud lines, the stop went where the rules put it, and price turned back through it within a day. Nothing was done wrong here, which is the point.
Two in three trades end like that one, and the rules give you nothing to do about it. There is no filter in this system that would have skipped it, and looking for one after the fact is how a mechanical system stops being mechanical.
The longest stretch without making a new equity high was 304 days. Ten months of following the rules exactly, taking every signal, and ending up no better off. That is the flat section in the middle of the curve above, and it is where most people quit.
Two honest details. The cloud condition makes losing runs shorter, eleven instead of thirteen. It also makes the flat stretch longer, 304 days against 277, because half as many trades takes longer to climb out of a hole. Fewer trades is not a free improvement.
Decide these before you start, not during
- Expect eleven losses in a row, because the record says so. If that would push you to change the rules, the rules are not for you, and it is better to know now than in month nine.
- Judge it over a hundred trades, which at five or six a month is about eighteen months. Anything shorter is not a sample.
- Size so the drawdown is survivable. 15.5% with the cloud condition, 26.6% without, at 1% risk per trade. Double the risk and you double both.
- Never skip a signal because it looks weak. With a third of trades carrying everything, the one you skip is as likely to be the one that paid for the quarter.
- If you still want a target closer than 3R, the table above is what you are choosing between. Choose it with the numbers rather than with the feeling, which is the entire point of publishing them.
What Cloud Confirmation Actually Tests
One correction before the numbers, because almost every description of this is wrong and the wrong version is unusable.
Cloud confirmation on a Tenkan-Kijun cross is not a requirement that the cloud be bullish. Senkou A above Senkou B is never tested. What is tested is the position of the signal bar’s close:
- For a long, the signal bar closes above both Senkou A and Senkou B.
- For a short, the signal bar closes below both.
That is the whole condition. Price is clear of the cloud in the direction of the trade, whatever colour the cloud happens to be.
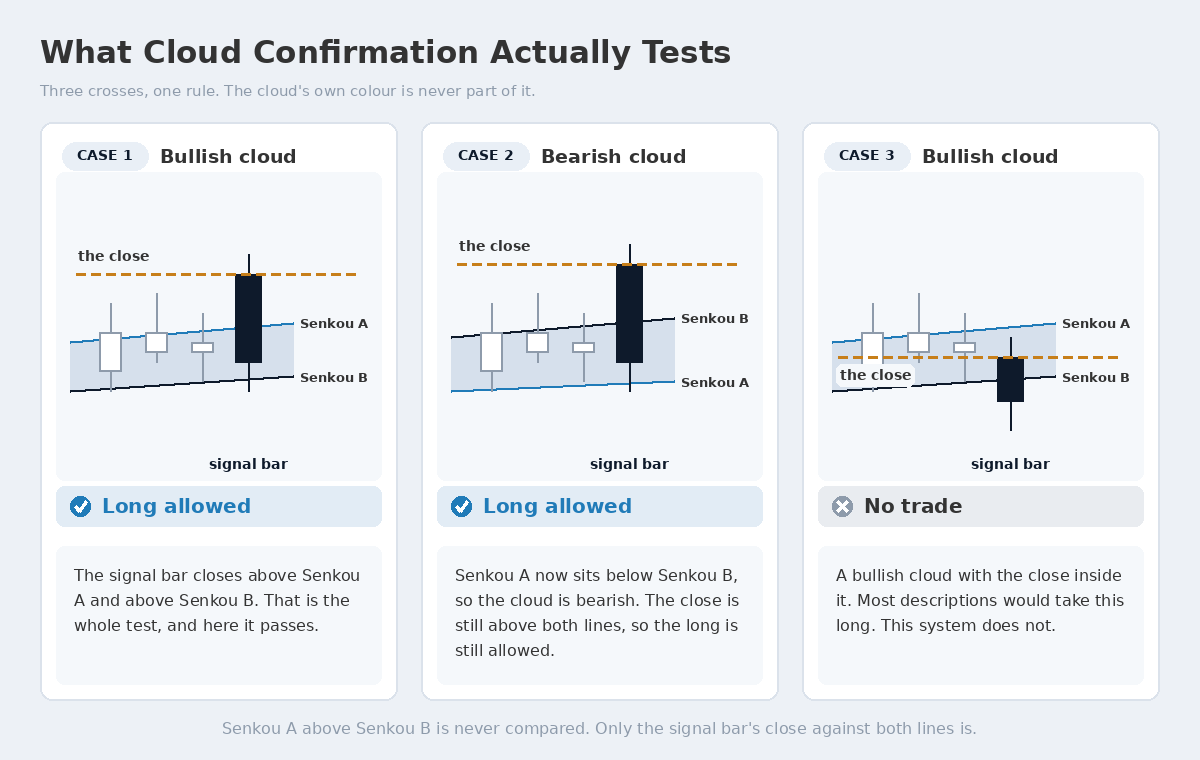
The filter reads one quantity, the signal bar’s close, against two lines. Whether Senkou A sits above or below Senkou B is never compared, which is why a bearish cloud can still allow a long and a bullish cloud can still block one.
The distinction matters because the two rules take different trades. A cross that fires while price is above a bearish cloud passes the real condition and fails the version most guides describe. That is a common situation at a turn, which is exactly where the difference shows up.
It is also the part of this method a person reads badly under time pressure. A cross whose signal bar closed a few points inside the cloud looks exactly like one that closed clear of it.
The KT Ichimoku Alerts Indicator marks the crosses and the breakouts as they happen, with the cloud condition applied or not, and alerts on them. Each variant is its own switch and the confirmation filter is a switch of its own, which is what made the comparison below possible to run at all.
What The Cloud Filter Costs And Earns
The five year table has already given the answer on USDJPY. The cloud condition roughly halves the trade count, 603 down to 329, and cuts the deepest drawdown from 26.6% to 15.5%. That halving is the answer to the complaint this page opened with. Fewer trades is the filter working, not the tool failing.
One instrument proving a point is a story, so the same comparison was run on seven others, at the same settings.
| Symbol | Drawdown, filter off | Drawdown, filter on |
|---|---|---|
| EURUSD | 51.5% | 41.3% |
| GBPUSD | 37.5% | 15.8% |
| XAUUSD | 30.1% | 20.5% |
| JP225 | 44.7% | 27.3% |
| US30 | 55.3% | 27.6% |
| USTEC | 26.8% | 20.1% |
| DE40 | 30.7% | 19.8% |
Three years of history on each, one hour charts, same Ichimoku settings, same stop and target, with only the cloud condition switched.
Drawdown falls on every one of them. On a further year of history it falls on six of the seven, EURUSD being the one that rises, and only slightly, 19.0% to 20.2%. That is eight instruments and the same behaviour on all of them, which is a far broader claim than any single system can make.
So the trade is plain. Cloud confirmation does not make you more money per trade. It halves your trade count and it cuts your worst run. If somebody has told you the cloud filter improves your win rate, the numbers here do not support that, and the numbers here are from 932 trades on USDJPY alone.
Whether 9-26-52 Holds
Every Ichimoku chart you have ever seen uses 9, 26 and 52. The numbers come from a six day trading week in mid-century Japan, which has not existed for decades, and nobody re-checks them.
Four sets were run on the system, each as its own test, so the result reads as a comparison rather than as a search for the best number.
| Setting | Filter | Trades | Expectancy per trade |
|---|---|---|---|
| 10 / 30 / 60 | off | 400 | 16.83 |
| 10 / 30 / 60 | on | 211 | 22.96 |
| 9 / 26 / 52, the default | off | 574 | 5.05 |
| 9 / 26 / 52, the default | on | 249 | 16.48 |
| 7 / 22 / 44 | off | 685 | 6.52 |
| 7 / 22 / 44 | on | 370 | 6.20 |
| 20 / 60 / 120 | on | 108 | 50.11 |
Three years of USDJPY H1 history. Each row is a stable area of that setting’s results rather than its single best run, so nothing here is a cherry pick.
The default is the weakest of the sets that trade often. With no confirmation it manages expectancy 5.05 over 574 trades where 10-30-60 reaches 16.83 over 400.
The fastest set is the worst. 7-22-44 produces the most trades and the least edge, on both filter states.
And the set with the best number of the whole comparison, 20-60-120 at expectancy 50.11, is not the one we publish. It took 39 trades in a year with the filter on, and a configuration resting on 39 trades is held up by too little to trade with confidence.
The system uses 10-30-60.
Why The Exit Is A Fixed Target
The entry gets all of the attention and the exit decides more.
Both exits were run on the same entries, the same stops and the same instruments: a fixed multiple of the stop distance, against closing the trade when the opposite signal appears. Every configuration that exited on an opposing signal failed, whichever entry it used and wherever the stop sat.
That is worth sitting with, because the opposing signal exit is the default Ichimoku exit. It is what most descriptions imply and it is what feels right: the system told you to get in, so it tells you to get out. Across this work it was the single choice that destroyed everything that used it.
The reason is not mysterious. A Tenkan-Kijun cross is a slow signal, so the opposite cross arrives long after the move has turned. It closes winners at a fraction of their best, and losers no earlier than the stop would have.
A target placed at three times the risk when the trade opens takes that decision away from the moment it is hardest to make.
Two well known combinations sit outside this comparison, which put Ichimoku’s own variants against each other rather than against other indicators. One is the cloud with RSI divergence. The other is the cloud with a long moving average as a trend filter, usually 200 or 250 periods.
Both are reasonable ideas, neither is tested here, and the method further down is how you would find out.
Where This System Belongs
The honest limit of the result, stated as plainly as the result itself.
USDJPY, on the one hour chart. Every figure on this page is from that market on that timeframe. It is where the system was built and it is the only ground these numbers describe. On anything else, test it before you trade it, and the method for that is below.
Not the daily chart. It cannot produce enough trades to say anything useful. The largest sample anywhere in the daily work was 43 trades in five years, against a bar of 100 that any conclusion here has to clear.
Not an account too small for the drawdown. 15.5% with the cloud condition and 26.6% without, at 1% risk per trade. At 2% risk both double.
Not a period when you cannot take every signal. A system that wins roughly a third of its trades and targets three times its risk concentrates its return in a small number of trades. Skipping the ones that feel wrong removes the winners as often as the losers.
How To Test This Yourself
Everything above is reproducible, and reproducing it is a better use of an afternoon than believing it.
The rules are complete, the settings are named, and the instrument and timeframe are stated. What follows is the short list of things that waste people’s time, drawn from four years of support conversations about Ichimoku tools.
- Set a stop loss before you use automatic position sizing. Sizing off a stop that does not exist is a division by zero, and it is the single most common cause of a test that errors out or silently falls back to a fixed lot.
- Turn optimisation mode off unless you mean to use it, and read the optimisation guide first if you do mean to. Left on with no input parameters selected, the backtest does not run at all, which looks exactly like a broken system.
- Put your licence key in the tool’s own input settings, and allow DLL imports when you are asked for them. A licensed tool with no key in its settings can run in the tester and show you no trades whatsoever, which reads as a strategy that does not work rather than as a licence that is not active.
- Switch the filters on one at a time. Filters stack: every one you enable has to agree before any signal is taken, so three or four together can silence a system that trades perfectly well with none of them. Strategies do not stack that way: each one trades on its own.
That fourth one is the complaint this page opened with, and it is worth repeating in its plainest form. Fewer trades is usually the filter working, not the tool failing. If you want to know which of your filters is costing you what, switch them one at a time and count.
Strengths And Limitations
What it has: complete mechanical rules with no discretion in them. Five years of continuous history with the broker’s own spread, commission and swap taken out. A confirmation result that is consistent across eight instruments, which is a broader claim than the system itself makes.
What it does not have: generality. It is one instrument on one timeframe. It is also a low win rate system with a wide target, which is psychologically harder to trade than its numbers suggest.
What is still open: whether the confirmation result holds on instruments and timeframes outside this work, and whether a setting between 10-30-60 and 20-60-120 does better than either. Both are answerable with the same method, and the rules sheet is where you would start.
Questions People Ask About Ichimoku
What is the success rate of the Ichimoku strategy? There is no single number, and any source that gives you one has not told you where their target sits.
On the system here the win rate is 33.1% over five years, with a target three times the risk. Move that target to one times the risk and the same entries win 53% of the time while earning about a twelfth as much per trade. A success rate is a consequence of the target, not a property of Ichimoku.
Which Ichimoku strategy is best? Of the two put head to head here, the Tenkan-Kijun cross with a fixed target and a Kijun-sen stop is the one that carried its result across five years. It did it without leaning on a handful of outsized trades, and the Kumo breakout did not.
The more useful finding is about the exit: every configuration that closed on an opposing signal failed, whichever entry it used.
What are the standard Ichimoku settings? 9, 26 and 52, which come from a six day trading week in mid-century Japan. They are on every chart and they are not the strongest of the four sets compared here. Over the same three years of USDJPY H1 history they produced expectancy 5.05 over 574 trades, against 16.83 over 400 trades for 10-30-60.
What are the five elements of the Ichimoku indicator? Tenkan-sen, Kijun-sen, Senkou Span A, Senkou Span B and the Chikou Span. What each one is and which of them this system reads is in the table near the top of this page.
What is the best indicator to use with Ichimoku? This work does not answer that, because it compared Ichimoku’s own variants rather than Ichimoku with other tools.
What it does show is that the most useful filter available was already inside Ichimoku. Requiring the signal bar to close clear of the cloud cut maximum drawdown on all eight instruments tested, so that is the one worth measuring on your own market before adding anything else.
Build This Ichimoku System
The rules on this page are complete, so none of this is needed to trade the system by hand. These three do the mechanical work. The indicator marks and alerts the signal on the chart, the Expert Advisor runs the exact rules for you with no screen time, and the rules sheet keeps the whole method on one page beside you.
| # | Tool | Link |
|---|---|---|
| 01 | KT Ichimoku Alerts IndicatorMarks and alerts the cross on the chart, with or without the cloud condition. | Get Indicator |
| 02 | KT Ichimoku Cross EATrades the exact rules above and places every entry, stop-loss and take profit for you. 100% automated, no screen time. | Get the EA |
| 03 | Ichimoku System Rules SheetThe settings, entry, stop-loss and take profit on one page, to keep beside the chart. | Download PDF |
None of the three changes the method. The rules are the method, and they are above in full, which is why they are published rather than hinted at.
If you trade it by hand, take the rules sheet, set the Ichimoku settings to 10, 30 and 60, and mark the next cross that closes clear of the cloud. If you would rather it ran while you were away from the screen, the Expert Advisor is the same rules with nothing added.
 Built by the Keenbase Trading Lab
The Keenbase Trading Lab is the research side of Keenbase Trading, where trading systems are designed and tested before anything is published about them.
A method reaches this blog only once it is complete enough to trade without guessing, which is why the rules above are stated in full and every figure on this page comes from a test that was run.
Keenbase Trading has been building MetaTrader indicators and Expert Advisors since 2018, alongside free tools and custom MQL5 development. The systems published here come from the same people who build the tools that run them.
Market conditions, broker feeds and symbol names vary, so confirm the behaviour on your own account before trading it.