
What Is a Fair Value Gap? What Price Really Does When It Returns
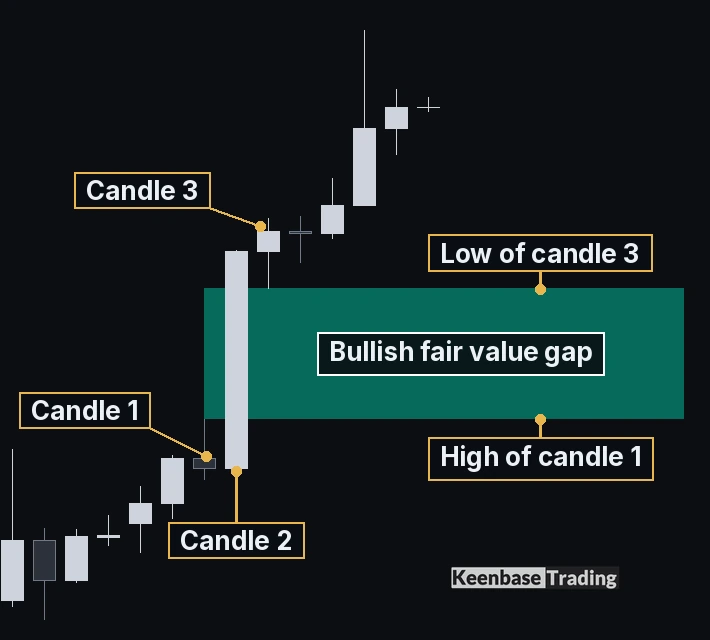
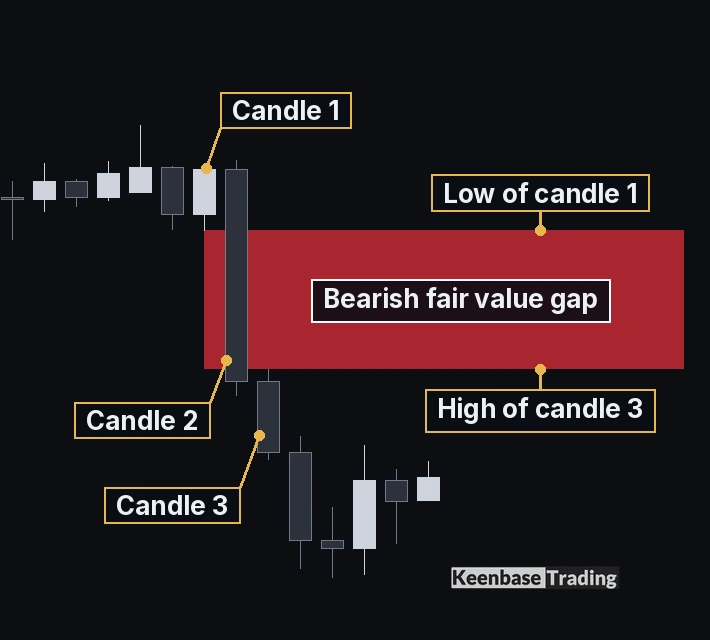
A fair value gap (FVG) is a three candle pattern left by a fast move. In a bullish fair value gap, the high of the first candle and the low of the third candle do not overlap. In a bearish fair value gap, the low of the first candle and the high of the third candle do not overlap. The empty space between them is the gap.
Traders expect price to come back to that space, and it usually does. What decides whether a gap mattered is what price does after it comes back, and that is where most explanations of fair value gaps go wrong.
We ran the gap rule of our own fair value gap indicator over more than 230,000 candles on eight markets and three timeframes. Price reached the gaps no more often than ordinary zones at the same distance. A wick through the 50% line did not end a gap. The event that decided a gap was a candle closing through its far edge.
How Three Candles Make a Fair Value Gap
The middle candle does the work. It is the fast candle, which traders who follow ICT (Inner Circle Trader) teaching call the displacement candle. The gap sits inside its body, between the wicks of the candles on either side of it.
Bullish fair value gap: the low of candle 3 stays above the high of candle 1. The gap runs from the high of candle 1 up to the low of candle 3.
Bearish fair value gap: the high of candle 3 stays below the low of candle 1. The gap runs from the high of candle 3 up to the low of candle 1.
ICT traders call the gap an imbalance, because price crossed it fast and the candles on either side of it never traded there. That does not mean nobody traded inside the gap: in most cases the middle candle traded through the whole range. The gap describes how the three candles sit, not an empty order book.
A gap is final only when the third candle closes, because until then its wick can still grow and close the space. The rule compares wicks and nothing else, so it works the same way on MT4 and MT5, on any symbol and any timeframe.
About 17 Fair Value Gaps Form in Every 100 Candles
A fair value gap is not a rare event. We measured 24 chart sets: EURUSD, GBPUSD, USDJPY, AUDUSD, gold, US500, US30 and DE40, each on M15, H1 and H4. Across them, 16.7 gaps formed in every 100 candles, counting only gaps large enough for our indicator to draw. No set fell outside 15.3 to 18.2.
So a chart showing 200 candles usually carries more than thirty fair value gaps. Gold, the stock indices and the forex pairs landed in the same band on every timeframe. The useful question on a chart is never whether there is a gap, but which of the thirty gaps on the screen is worth watching.
Do Fair Value Gaps Pull Price Back? No More Than Any Other Zone
Price comes back to fair value gaps quickly. In our data, 89.8% of gaps were touched again within the next 50 candles. The median wait for that first touch was one to two candles on every market and timeframe, and between half and six in ten of all gaps were touched within two candles.
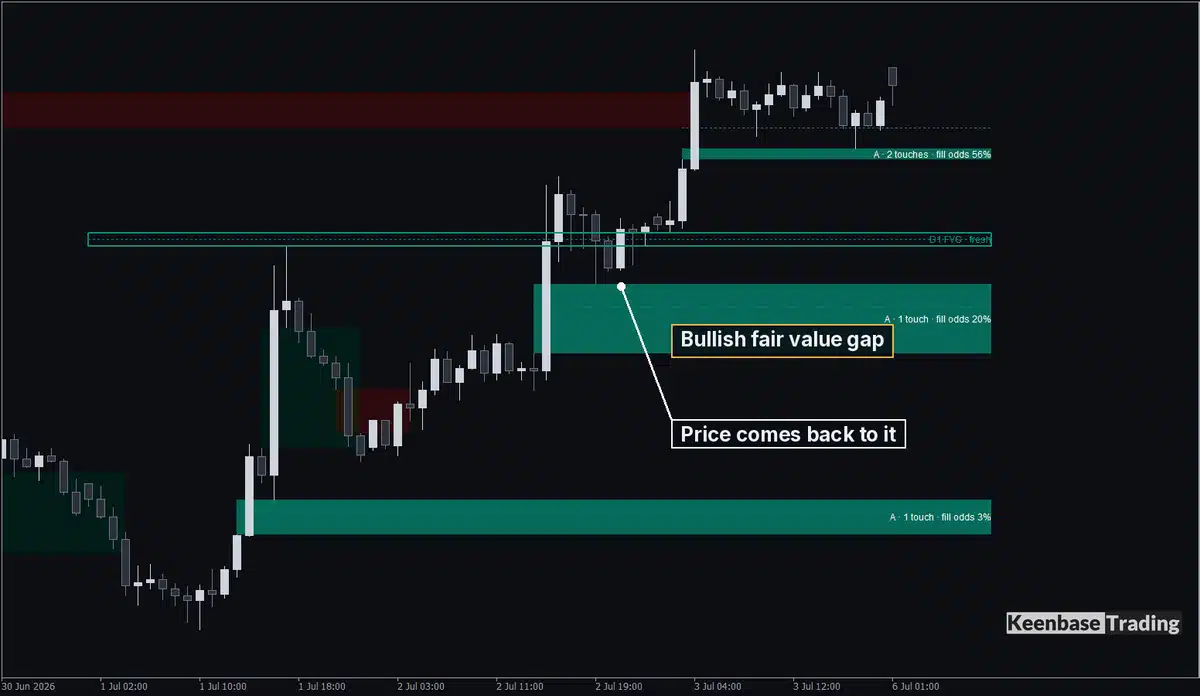
That return is often explained as the gap pulling price back to fill an imbalance. We tested it. For every gap, we placed ordinary zones of the same size and at the same distance from price, on candles where no gap had formed. Then we checked how often price reached them in the same 50 candles.
| Within the next 50 candles | Fair value gaps | Ordinary zones, same size and distance |
|---|---|---|
| Price touched the zone | 89.8% | 89.5% |
| Price reached the far edge | 81.3% | 81.2% |
The difference is under half a point, and it changed sign from one chart set to the next. Price reaches fair value gaps so often because price reaches nearby levels that often. The gap itself does not pull price.
That still makes an open gap near price a level price will probably trade to, which is useful. It also means a touch tells you very little. Almost every gap gets a visit, usually straight away. What happens during the visit is the information.
Touched, Filled and Closed Through Are Three Different Events
The word “filled” means different things on different pages. Some call a gap filled when a candle closes through it, some treat a touch of its middle as filled, and some mean that price traded the whole gap. Those are separate events, and mixing them up makes every statement about fair value gaps hard to read.
| Event | Bullish fair value gap | Bearish fair value gap |
|---|---|---|
| Touched | A candle trades down into the top edge | A candle trades up into the bottom edge |
| Filled | Price reaches the bottom edge | Price reaches the top edge |
| Closed through | A candle closes below the bottom edge | A candle closes above the top edge |
These are the definitions our fair value gap indicator uses. Filled needs only a wick. Closed through needs a candle to close beyond the far edge, and it is the only one of the three events that ends the gap.
The two events often come together, but not always. Of the gaps that were filled in our data, 47.5% were filled by a candle that also closed through them. The other 52.5% were filled by a wick first, with the candle closing back inside or outside the gap.
That second group is where filled and closed through part company, and it is why the difference matters more than any other line on the chart. Over the 50 candles, 73.7% of all gaps were eventually closed through and turned into inverse fair value gaps.
Does Price Respect the 50% Line of a Fair Value Gap?
The middle of a gap, its 50% line, is called consequent encroachment in ICT teaching. Many traders treat it as the line that decides the gap: price is expected to turn before it, and a move past it is read as the gap failing. Our data does not support that.
We counted a gap as held when, after the first touch, price moved one ATR away from the gap before any candle closed through its far edge. The ATR (average true range) is about the size of a typical candle.
Of the touched gaps that reached one of the two outcomes, held or closed through, 45.2% held. Then we checked how deep price went into each gap before it held.
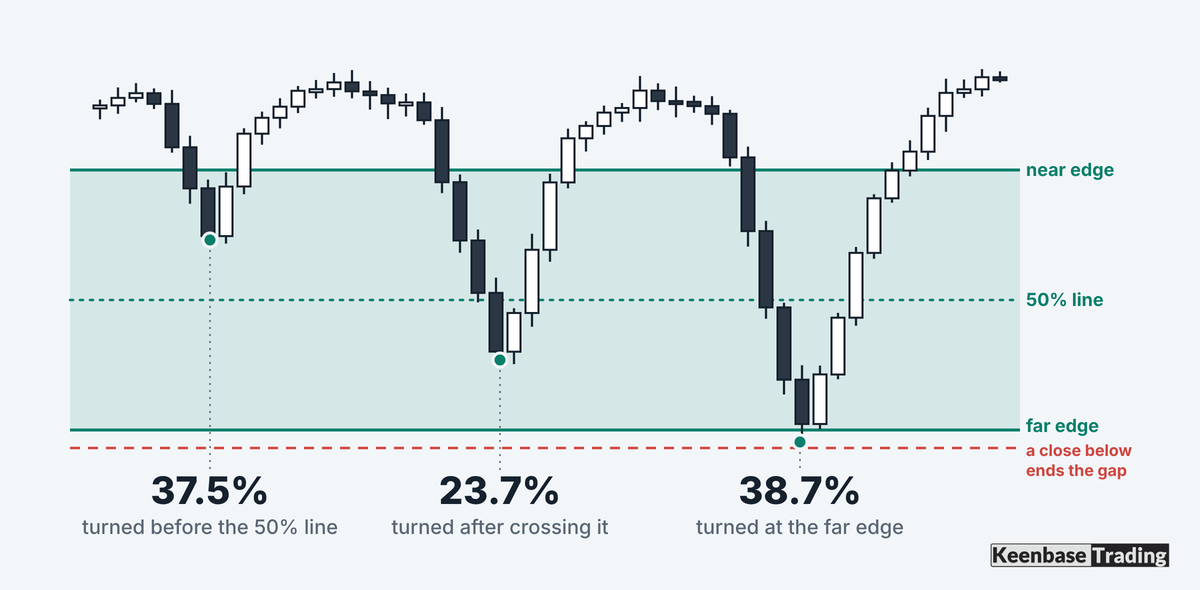
| Before the gap held, price reached | M15 | H1 | H4 |
|---|---|---|---|
| Less than the 50% line | 38.5% | 37.1% | 37.0% |
| Past the 50% line, not the far edge | 23.7% | 23.0% | 24.5% |
| The far edge, so the gap was filled | 37.8% | 39.9% | 38.5% |
About six in ten gaps that held were crossed past their 50% line first. Almost four in ten were traded all the way to the far edge, filled by a wick, and still held, because no candle closed through them. The split was the same on every market: the share that held before the 50% line ran only from 33.9% to 39.0%.
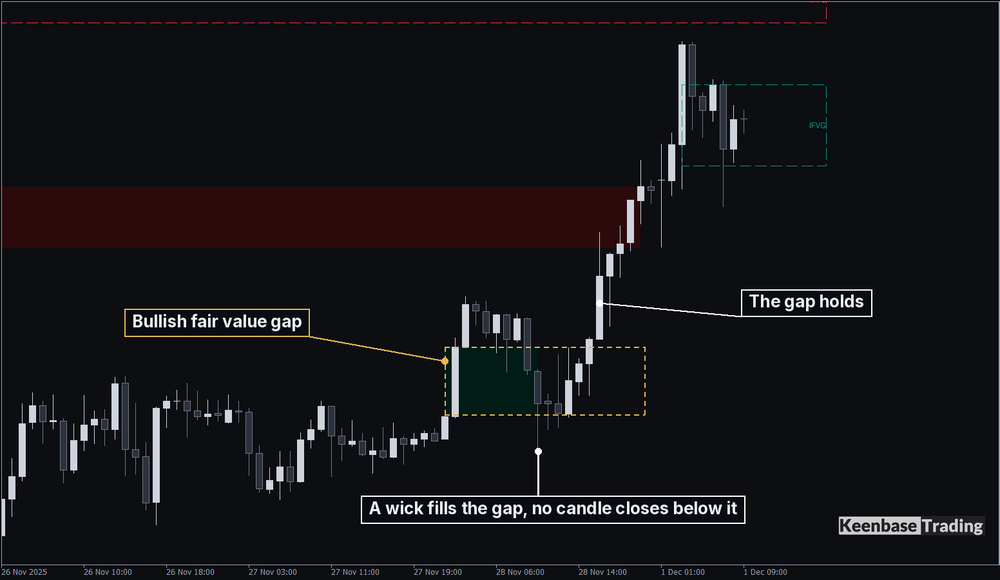
So a wick through the 50% line, or even through the whole gap, does not end a fair value gap. A candle that closes through its far edge does. These figures come from one broker’s price history, so your own results may differ, but the pattern was the same on all 24 chart sets.
Inverse Fair Value Gaps: What Happens After a Close Through
When a candle closes through a fair value gap, the gap changes sides. A bullish gap that price closes below becomes a possible resistance zone. A bearish gap that price closes above becomes possible support. The flipped gap is called an inverse fair value gap (IFVG).
Price comes back to an inverse fair value gap almost every time. After a close through, price returned to the gap within 50 candles in 92.0% of cases.
The hold is a different story. From that return, the inverse gap held, with price moving one ATR the new way before a candle closed back through it, 42.9% of the time (M15 42.5%, H1 42.2%, H4 44.2%).
An inverse fair value gap behaves much like an ordinary one. Price nearly always visits it, and fewer than half of the visits end with a clean move away. A retest is something to watch, not a reason on its own.
Weekend Opens Make Gaps the Three Candle Rule Cannot Tell Apart
The three candle rule compares wicks, so it cannot tell a fast move during trading from the jump between Friday’s close and Monday’s open. When we ran the rule, gaps made partly by a weekend open showed up wherever the timeframe was long enough to catch them.
On H4, between 4.9% (AUDUSD) and 10.7% (US500) of all fair value gaps included a weekend open. On M15 the share was only 0.8% to 1.5%.
On H4 and higher timeframes, check whether a gap’s three candles straddle the weekend before treating it like the others. That is our reasoning rather than a measured result: a jump while the market is closed is not the same thing as a fast move while it is open.
Reading Fair Value Gaps on MT4 and MT5 Without Marking Them by Hand
Two findings above decide how a gap should be read on a chart: a touch tells you little, and a close through the far edge is what ends a gap. Marking thirty gaps by hand, and remembering which ones price has touched, filled or closed through, is slow.
KT Fair Value Gap Indicator tracks those events for each gap it draws.
Grades: every gap is graded A, B or C by its size against the average candle range. Grade A gaps get the strongest colour, so the gaps worth watching stand out from the thirty on screen.
Open gaps that shrink: the box of an open gap extends to the current candle and shrinks as price trades into it, so you can see how much of the gap is still open. A filled gap fades, which keeps old boxes from being mistaken for live gaps.
Inverse gaps: a gap that a candle closes through turns into a dashed inverse fair value gap in the opposite colour, ready for the retest.
Your own record: a panel shows how often gaps of each grade made price move one ATR away before a candle closed through them. That is the same definition of a held gap used above, counted on your own chart, so you can check these numbers on the symbol you trade.
Fill odds: each open gap also shows how often a gap that far from price was filled within 50 candles on your symbol. That number is about distance, which fits what the ordinary zones above showed.
Gaps and grades are confirmed at the candle close and do not move afterwards; only the open edge of a gap moves while price trades into it. Higher timeframe gaps are added for you, such as H4 gaps on an M15 chart, and alerts can tell you when price reaches a fresh gap or closes through one.
See how KT Fair Value Gap tracks every gap on your chart
About this article
Published by Keenbase Trading, which has been trading since 2018 and builds MT4 and MT5 indicators, Expert Advisors, free trading tools and custom MetaTrader development.
Price history differs between brokers, so check the numbers on your own chart before you rely on them.