
Supply and Demand Trading Strategy: The Zone Inside a Zone Setup
Your chart has a dozen supply and demand zones. The strategy is the one you trade and the eleven you leave alone.
Here is the short answer. A demand zone is the small pause in price before a strong move up, and a supply zone is the small pause before a strong move down. The Zone Inside a Zone Setup trades an H1 zone only when it sits inside an H4 or daily zone of the same side, and only after a candle closes back out of it.
Below are the complete rules for this supply and demand trading strategy on MetaTrader 4 (MT4) and MetaTrader 5 (MT5), with real gold and forex charts. There is also a printable Supply and Demand Trading Playbook (PDF) to keep beside your screen.
One Gold Chart, Every Zone, and the One Zone the Setup Trades
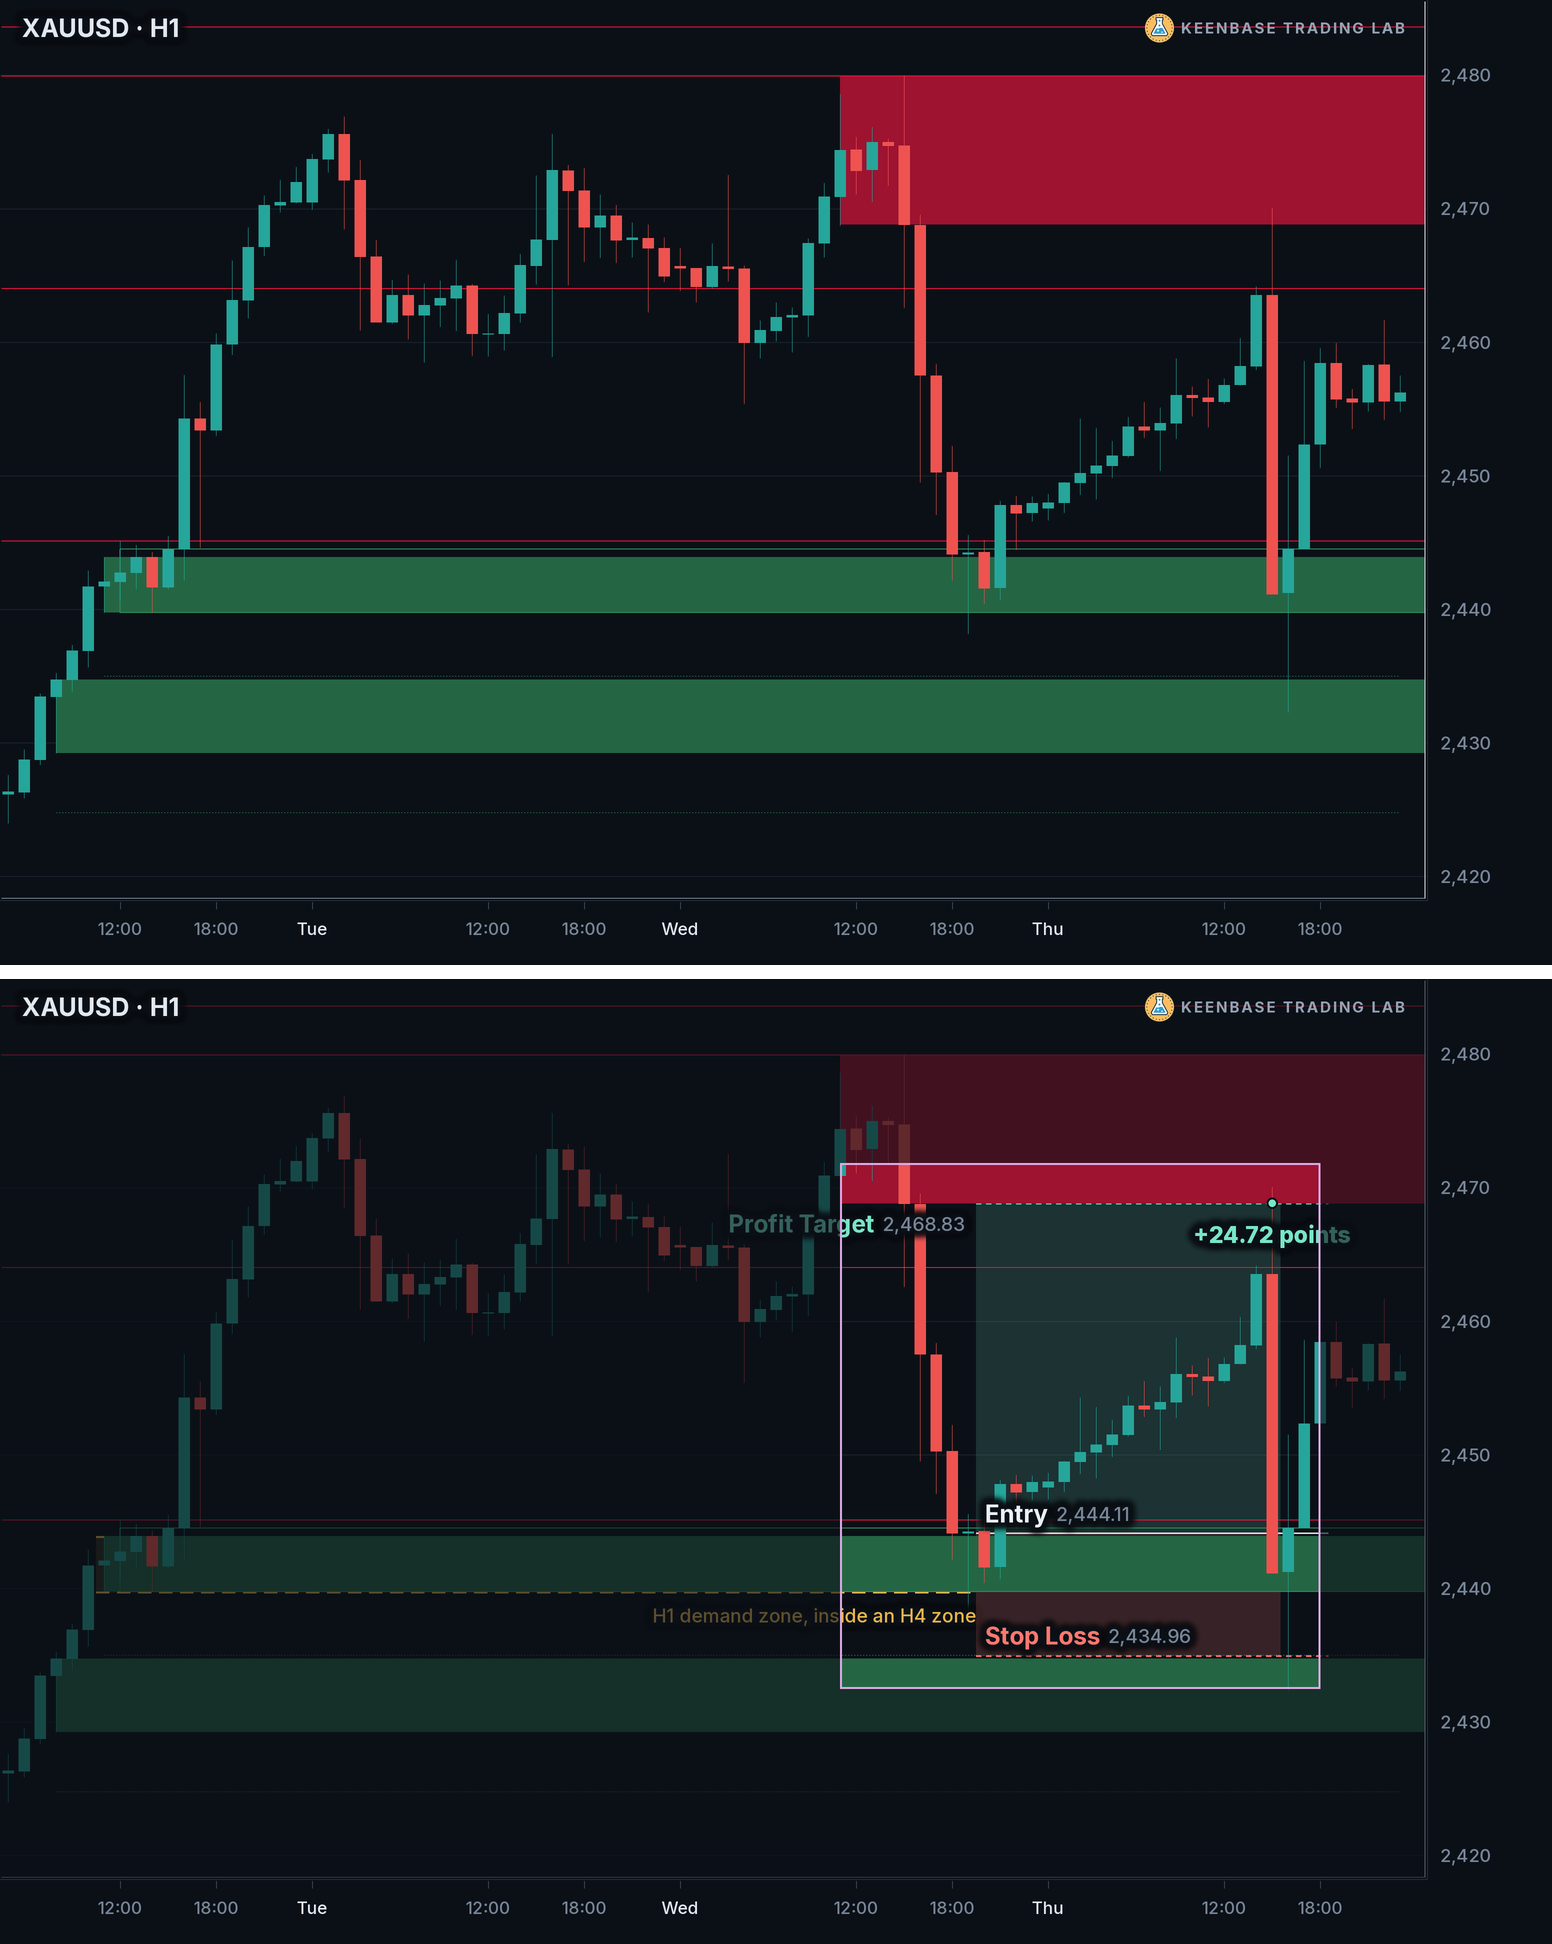
The upper chart above is an H1 chart of gold (XAUUSD) with supply and demand zones on it. The green boxes are demand zones and the red boxes are supply zones. Every one of them is a real zone, and a trader could place an order at any of them.
The lower chart keeps one. It is an H1 demand zone from 2,439.69 to 2,443.88, and it sits inside an H4 demand zone that covers almost the same prices, 2,439.72 to 2,444.47. Two timeframes marked the same small area as demand.
Price left that zone, rose about 30 points, and came back two days later. An H1 candle dipped into the zone and closed back above it. That close is the entry candle, and the buy went in at the open of the next candle, at 2,444.11.
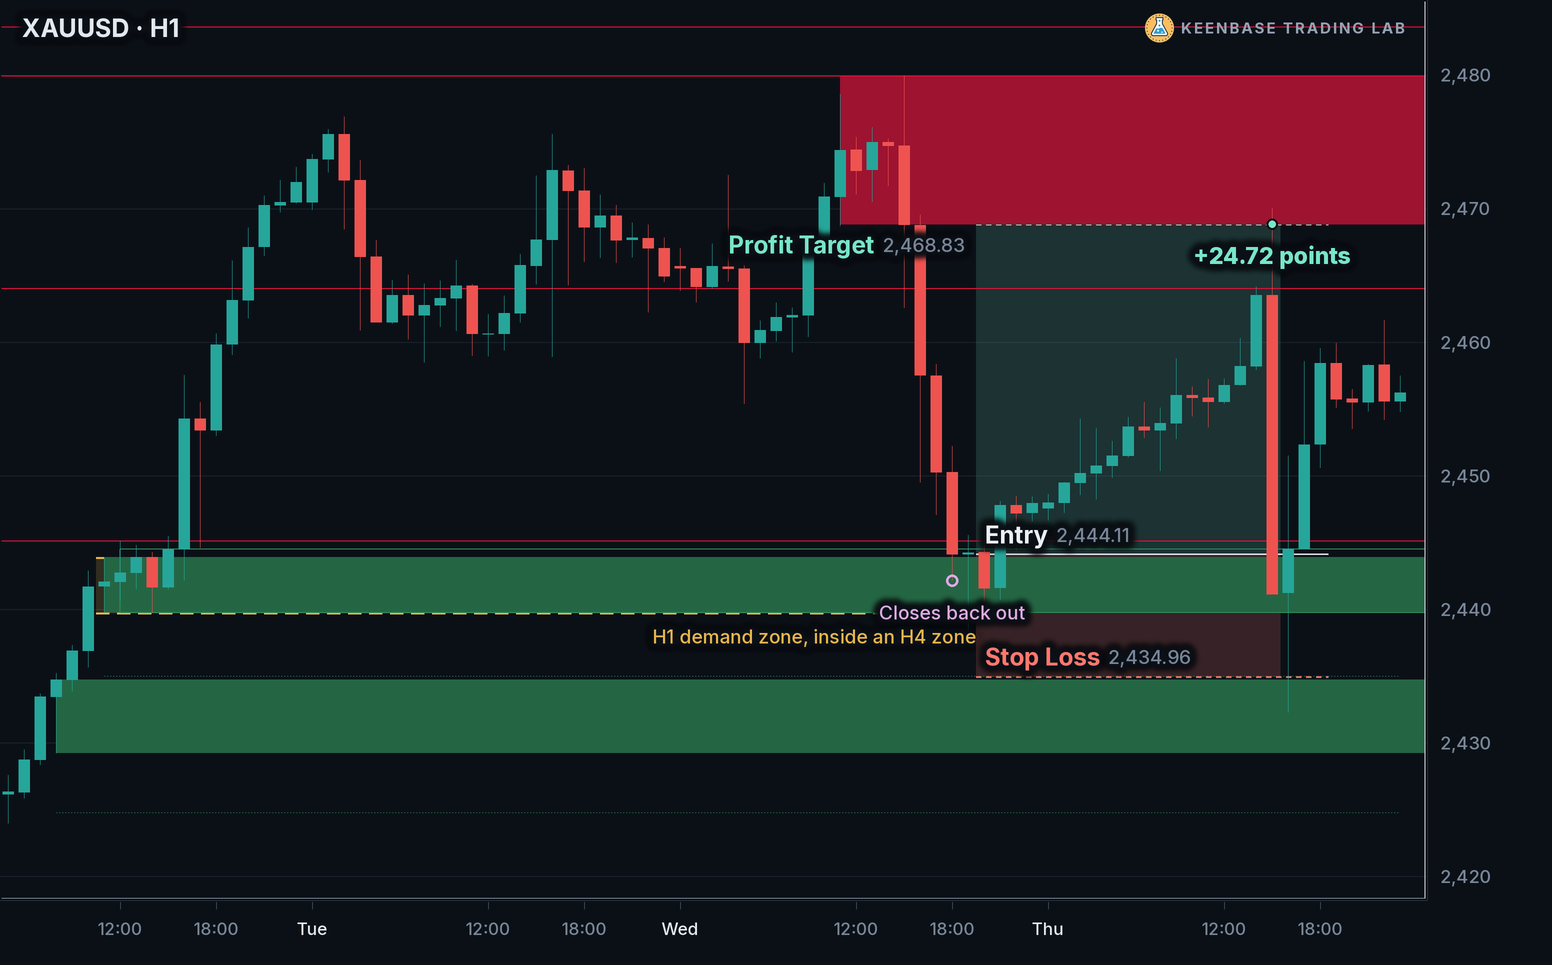
The stop loss went on the dotted line below the zone, at 2,434.96, which is 9.15 points below the entry. The profit target went at the near edge of the nearest supply zone above, 2,468.83, which is 24.72 points above the entry.
Price reached the profit target the next day. On gold, one point is a price move of 1.00. Every rule of the setup is in that one trade, and the sections below take them one at a time.
What Supply and Demand Zones Are, and How to Identify Them
A demand zone is a small area where price paused for a few candles and then left upward with a strong move. A supply zone is the mirror: a small pause, then a strong move down. If the idea is new to you, start with what supply and demand means in forex.
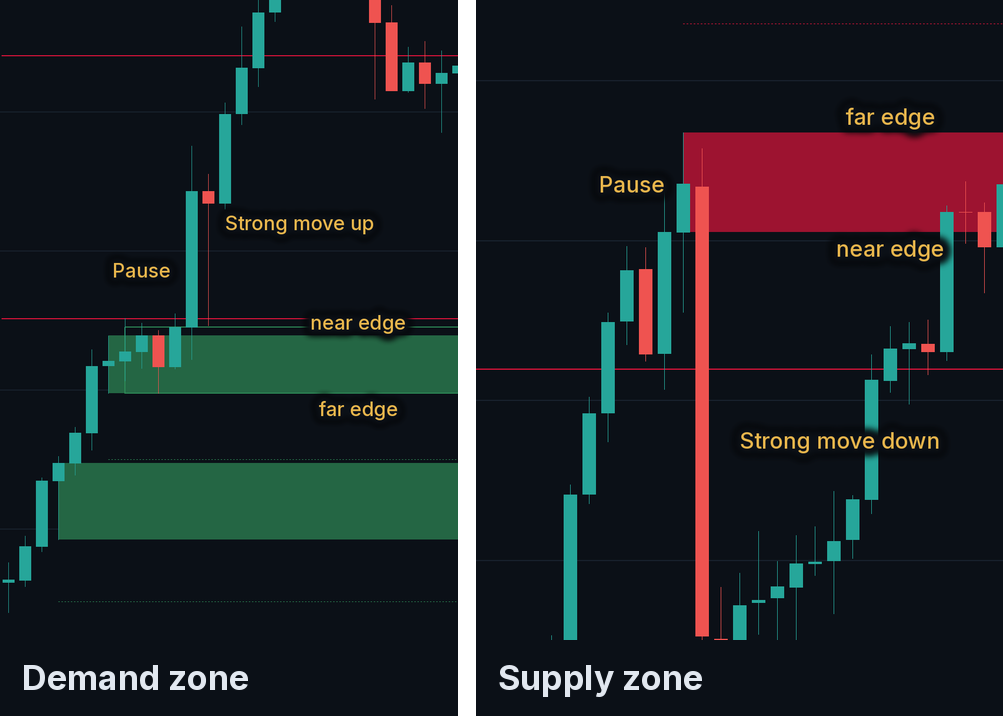
Each zone has two edges. The near edge is the side price reaches first when it comes back. The far edge is the other side.
Traders usually mark these zones by hand, and that is where the trouble starts. Two traders looking at the same chart box two different pauses, and each calls it the zone. A rule draws the same zone every time.
KT Supply and Demand Indicator finds the zones from the candles themselves: the pause and the strong move away from it. It does not use ZigZag or swing points. A zone appears once the candle of the strong move has closed, and it never moves afterwards.
A supply or demand zone is a close cousin of an order block. An order block marks one candle before a break of a swing point, where a supply or demand zone marks a pause before a strong move. The order block version has its own rules in the order block trading strategy.
When a Zone Ends: a Wick Keeps It, a Close Removes It
One rule decides when a zone is finished: a candle that closes beyond the far edge removes it. A wick beyond the far edge does not.
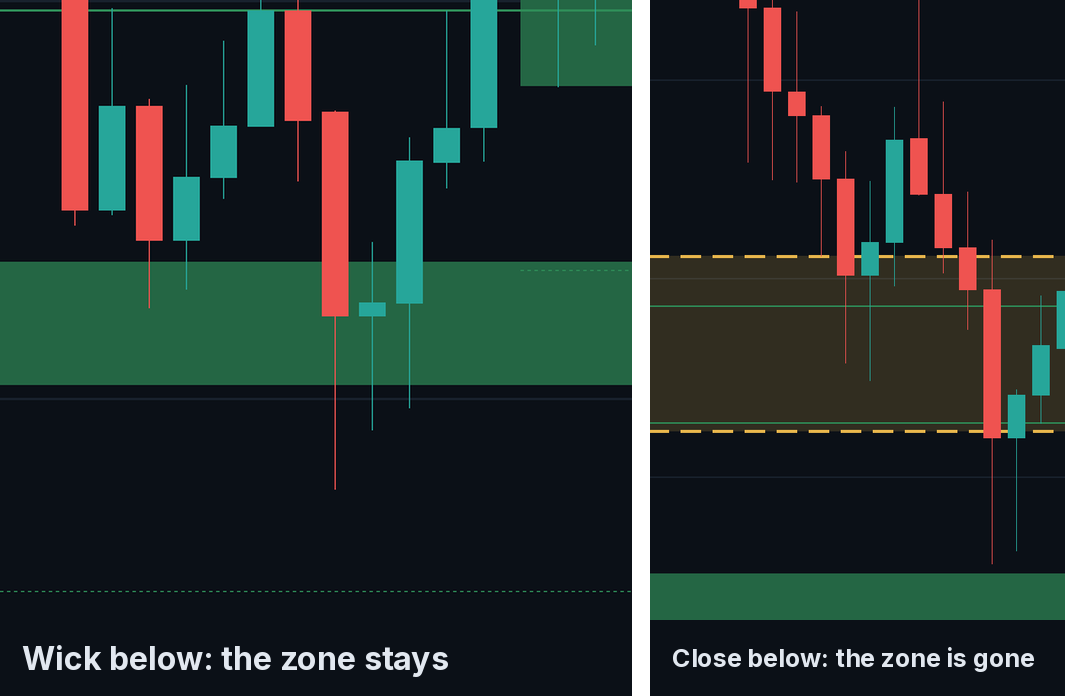
This matters twice. It tells you which zones on your chart still count, because the indicator removes a zone the moment a candle closes through it. And it tells you where a stop loss cannot sit, which comes up below.
A zone does not wear out by being visited. It stays the same zone until a candle closes through it, and the setup can trade it on more than one visit.
Four Questions That Decide Which Zone You Trade
These rules use an H1 chart with KT Supply and Demand Indicator on its default settings. It draws the H1 zones as filled boxes and the H4 and daily zones as outlines behind them.
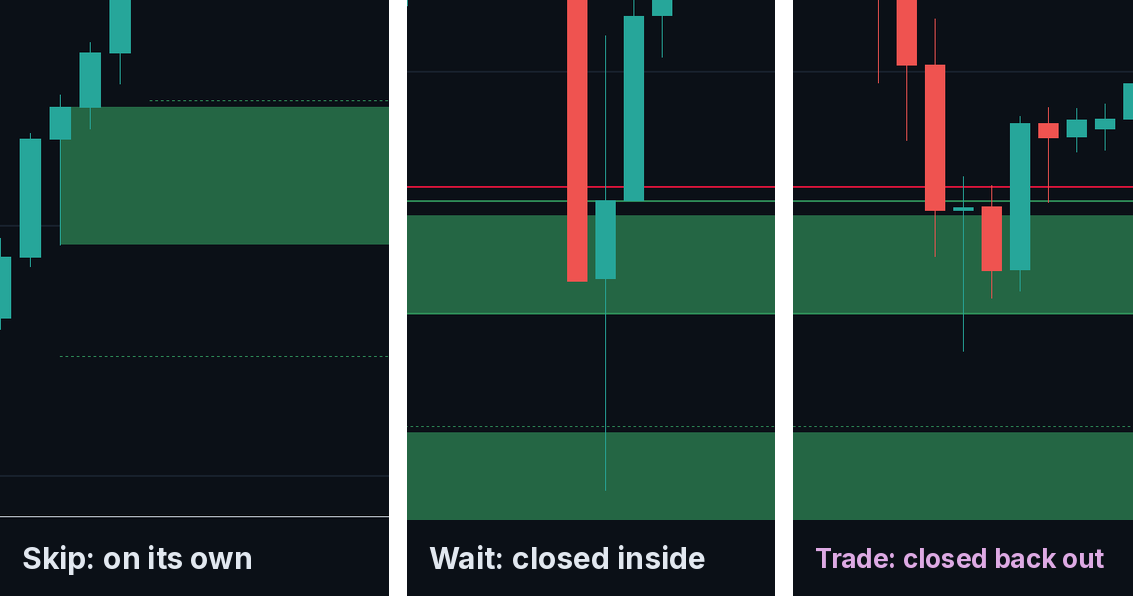
Is the H1 zone inside a bigger zone?
Has a candle reached the zone and closed back out of it?
Is the profit target far enough?
Is the risk set?
Four times yes, and the trade goes in at the open of the next candle: a buy at a demand zone, a sell at a supply zone. Take one trade per visit to a zone.
Where the Stop Loss Goes, and Why Not at the Zone Edge
The stop loss goes on the stop room line. KT Supply and Demand Indicator draws this dotted line beyond each zone, at the distance price usually travels past a zone on your symbol before it turns away. It is measured on your own chart, so it differs from one symbol to the next.
The stop loss does not go at the far edge of the zone, because a wick through the far edge does not end the zone. A stop loss at the edge would close the trade on exactly that wick, with the zone still standing.
In the gold example, the far edge of the zone was 2,439.69 and the stop room line was 2,434.96. The stop loss went on the line, 4.73 points beyond the edge.
The stop loss distance is different for every zone, so size the position from the stop loss. Choose the lot size so that a stop loss hit loses 1% of the account.
The Target, and the Win Rate It Needs
The profit target is the near edge of the nearest opposite zone, and question 3 skips any trade where it is closer than 1.5 times the stop loss distance. That one rule sets the win rate the setup needs.
Here is the maths. A trade that wins 1.5 times what it risks breaks even, over many trades, when it reaches its target 2 times in 5. That figure is 1 divided by 2.5, where 2.5 is the 1.5 you win plus the 1 you risk.
| Target distance | Share of trades that must reach the target to break even |
|---|---|
| 1.5 times the stop loss distance (the minimum) | 2 trades in 5 |
| 2 times | 1 trade in 3 |
| 2.7 times (the gold example) | about 1 trade in 4 |
| 3 times | 1 trade in 4 |
The table is maths, not a record of trades. Spread, commission and swap are not included, and they raise each share a little.
This is also the honest answer to the win rate of a supply and demand trading strategy. A reward to risk ratio tells you the win rate you need. Only your own record of the setup tells you the win rate you get, on your market.
Three More Supply and Demand Trades on Gold and GBPUSD
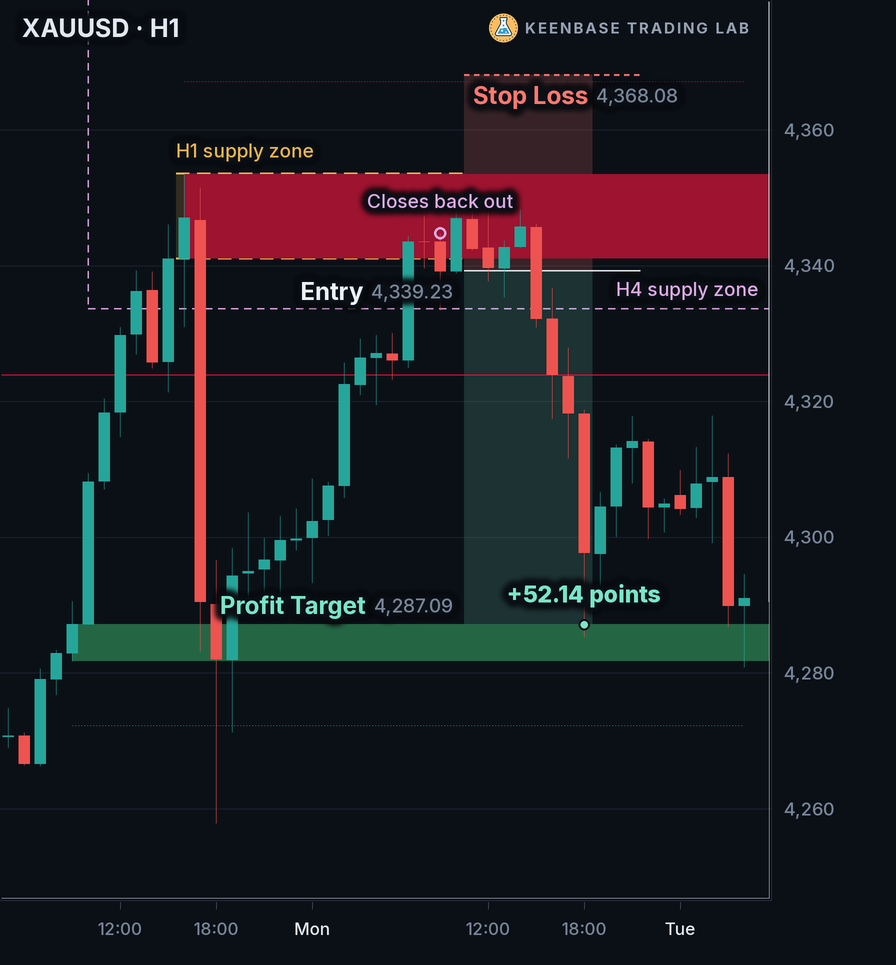
Here is the setup on three more charts, all on H1. The lilac dashed outline marks the bigger H4 zone, and the small ring marks the candle that closed back out.
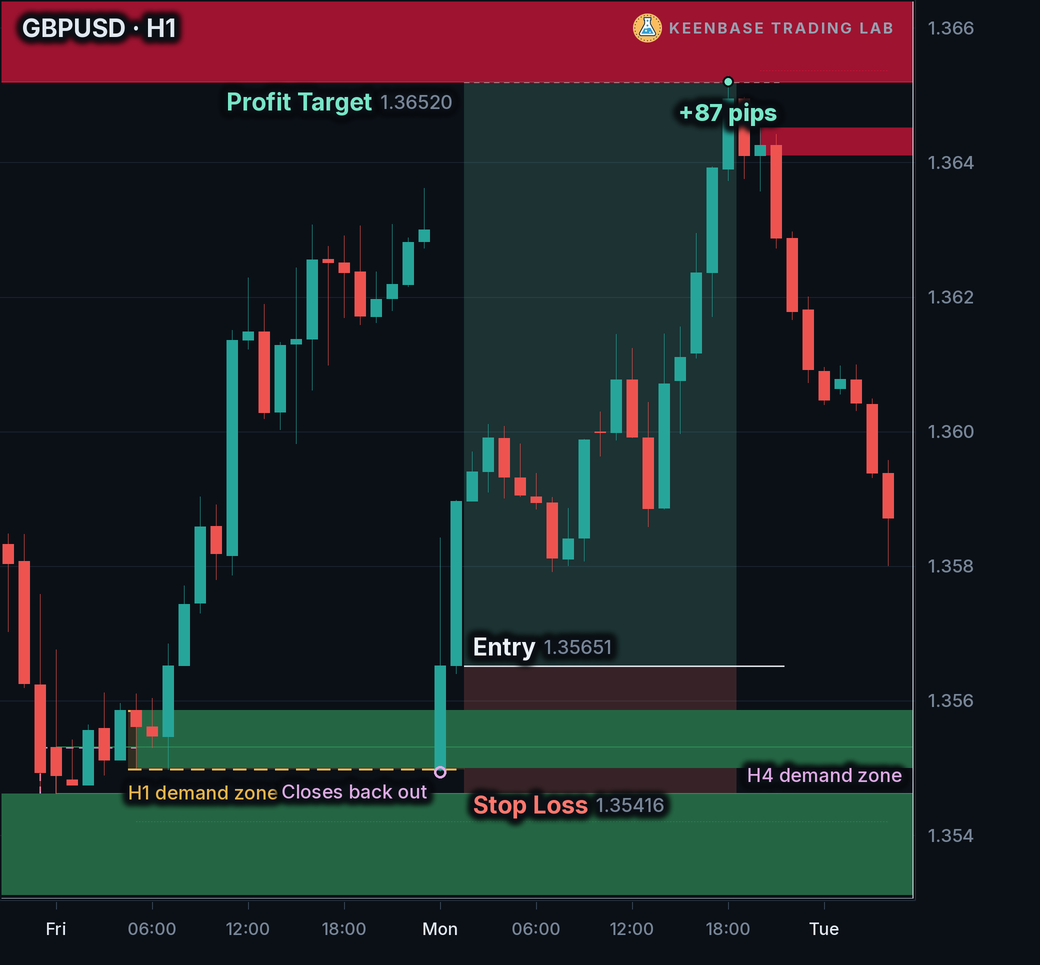
GBPUSD, a buy: the H1 demand zone ran from 1.35498 to 1.35585, inside an H4 demand zone. A candle that opened inside the zone closed back above it, and the buy went in at 1.35651.
The stop loss sat 23.5 pips below the entry. The profit target was the near edge of the supply zone above, 86.9 pips away, which is 3.7 times the stop loss distance. Price reached it the same day.
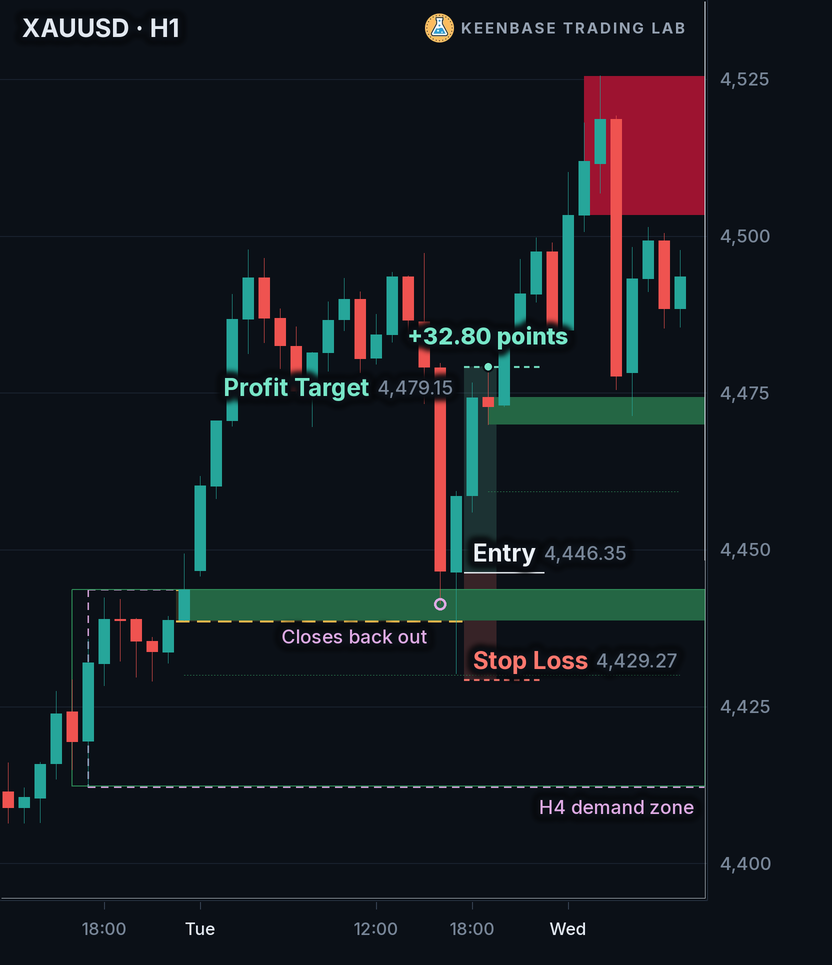
Gold, a buy: the H1 demand zone, 4,438.57 to 4,443.59, sat at the top of a much taller H4 demand zone. The buy went in at 4,446.35 with the stop loss 17.08 points below.
The profit target, 32.80 points above the entry, was reached within hours. The supply zone that gave the target no longer shows on the chart, because price later closed through it, and a close through a zone removes it.
Gold, a sell: the same rules, turned upside down. The H1 supply zone ran from 4,341.07 to 4,353.57, inside a taller H4 supply zone. Several candles traded inside the zone before one closed back below it.
The sell went in at 4,339.23. The stop loss went on the stop room line above the zone, 28.85 points above the entry, and the profit target was the demand zone below, 52.14 points away.
A Setup That Met Every Rule and Failed
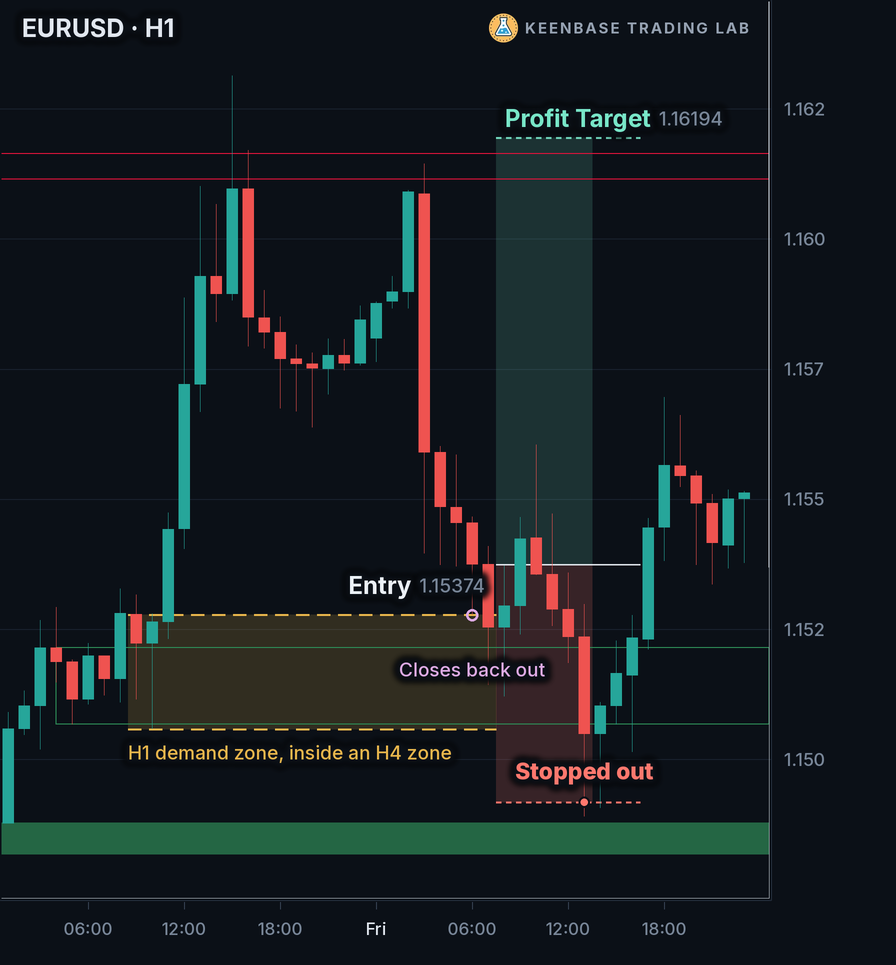
EURUSD, a buy: the H1 demand zone ran from 1.15058 to 1.15278, inside an H4 demand zone. A candle closed back above the zone, and the buy went in at 1.15374.
The stop loss was 45.6 pips below the entry and the profit target was 82.0 pips above it, 1.8 times the stop loss distance. All four questions had a yes.
Price turned down again within hours, went through the zone and reached the stop loss. The trade lost the full stop loss distance.
A zone is a place to act, not a promise. That is why the risk is fixed at 1% before the entry, and why question 3 keeps the profit target well beyond the stop loss distance.
Mistakes That Waste a Good Zone
- Trading every box: most zones on the chart are not the setup. Question 1 removes the ones that stand on their own.
- Buying the touch: the entry comes after a candle closes back out of the zone, not when price first reaches it.
- A stop loss at the zone edge: a wick through the edge does not end the zone, but it does hit a stop loss placed there.
- A target the chart does not allow: when the opposite zone is closer than 1.5 times the stop loss distance, there is no trade.
- Keeping a zone alive: after a candle closes through a zone, the indicator removes it. Do not draw it back by hand.
Does Supply and Demand Trading Work? Where to Start
A supply or demand zone is a good place to look for a trade. It is not a guarantee that price will turn there, and no zone is. What makes supply and demand trading a strategy is a fixed set of rules applied to every zone, the same way, with the same risk.
Start with gold (XAUUSD) and the major forex pairs, on an H1 chart with the H4 and daily zones behind it. These markets are liquid, and their spread is small next to the stop loss distance of an H1 zone. H1 with H4 and daily zones is also the indicator’s own default pairing.
For day trading on a faster chart, the indicator pairs an M15 chart with H1 and H4 zones. That is a different set of zones, so keep a separate record for it.
Then keep a record. Write down every setup the four questions give you, taken or skipped: the market, the zone, the entry, the stop loss, the profit target and the outcome, including spread and swap. After a few dozen rows you will know how these zones behave on your market, before it costs you anything on a live account.
The Zone Inside a Zone Setup on One Card
| Chart | H1, KT Supply and Demand Indicator on its default settings: H1 zones filled, H4 and daily zones as outlines. |
|---|---|
| Zone | An H1 zone inside an H4 or daily zone of the same side: demand for a buy, supply for a sell. |
| Entry | After an H1 candle reaches the zone and closes back out of it, enter at the open of the next candle. |
| Stop loss | On the zone’s stop room line. |
| Profit target | The near edge of the nearest opposite zone. Skip the trade if it is closer than 1.5 times the stop loss distance. |
| One trade | One trade per visit, one trade open at a time. A candle close through the zone ends it. |
| Risk | 1% of the account per trade. |
The Supply and Demand Trading Playbook (PDF) carries the two zones and the end of a zone on real charts, the trade, wait or skip guide and the setup on one page. It also has a pre-trade checklist, a stop loss and target worksheet, the five examples above with their prices, and journal pages for your own record.
| # | Name | Link |
|---|---|---|
| 01 | KT Supply and Demand IndicatorDraws the supply and demand zones of your chart, the H4 and daily zones behind them and the stop room line beyond each zone, removes a zone when a candle closes through it, and alerts when price reaches a zone and when a candle closes back out. MT4 and MT5. | Get Indicator |
| 02 | Supply and Demand Trading Playbook (PDF)The two zones and the end of a zone on real charts, the trade, wait or skip guide, the setup on one page, a pre-trade checklist, a stop loss and target worksheet, five real examples and journal pages. | Download PDF |
Open your own H1 chart tonight and ask the four questions of the zone nearest to price. Is it inside a bigger zone, has a candle closed back out, is the profit target far enough, and is the risk set? Most evenings the answer to the first or the second is no, and the right trade is no trade.
 Built by the Keenbase Trading Lab
The Keenbase Trading Lab is the research side of Keenbase Trading, where trading methods are worked out in full before anything is published about them.
A method reaches this blog only once it is complete enough to trade without guessing. That is why the rules are stated in full, and every chart on this page is a real setup with its symbol and timeframe named.
Keenbase Trading has more than 11 years of experience in algo trading and in building MetaTrader indicators and Expert Advisors. The methods published here come from the same people who build the indicators that run them.
Prices, candle times and market names differ from broker to broker, so check the rules on your own broker’s charts before you trade with real money.