
Best Buy Sell Indicator for MT5: The Test That Tells You Which One to Trust
There is no single best buy sell indicator for MT5, and any page that hands you a name has skipped the part that decides whether the name is worth anything. Two properties separate a signal you can trade from an arrow that decorates a chart.
The signal was available when it claims it was. Not visible now, on a finished chart. Visible then, close enough to the arrow that you could have acted on it.
The signal carries more than a direction. Where the idea is wrong, where it is going, and whether this side of this market is worth taking at all.
The first is testable in one sitting, on whatever indicator is already on your chart, using a tool MT5 gives you for free. The second is where most of them quietly fail. Here is the procedure, and the reason each step exists.
Why every MT5 arrow indicator looks accurate in history
An MT5 indicator does not paint an arrow once and leave it there. It is handed the price series and asked to produce values again and again for as long as the chart is open.
To stop charts crawling, the terminal hands the indicator a count of how many bars it had already finished last time, so it can skip them. That shortcut is switched off under a condition you trigger constantly without noticing.
The MQL5 OnCalculate reference states that when the price data have changed since the last call, because “a deeper history has been loaded or gaps in the history have been filled”, the terminal itself resets that count to zero.
Zero means start again from the first bar. Scrolling back far enough, reconnecting after a dropout, or opening a chart that pulls more bars from the broker all produce it, and none of them announce themselves.
So the arrows you are judging are not necessarily the ones that were on screen when those bars were live. Some or all of them were computed afterwards, by an indicator that could already see how each of those bars resolved.
None of that makes an indicator dishonest. An honest one recalculates too and puts every arrow back exactly where it was. The problem is evidential: a finished chart cannot tell you which kind you are holding.
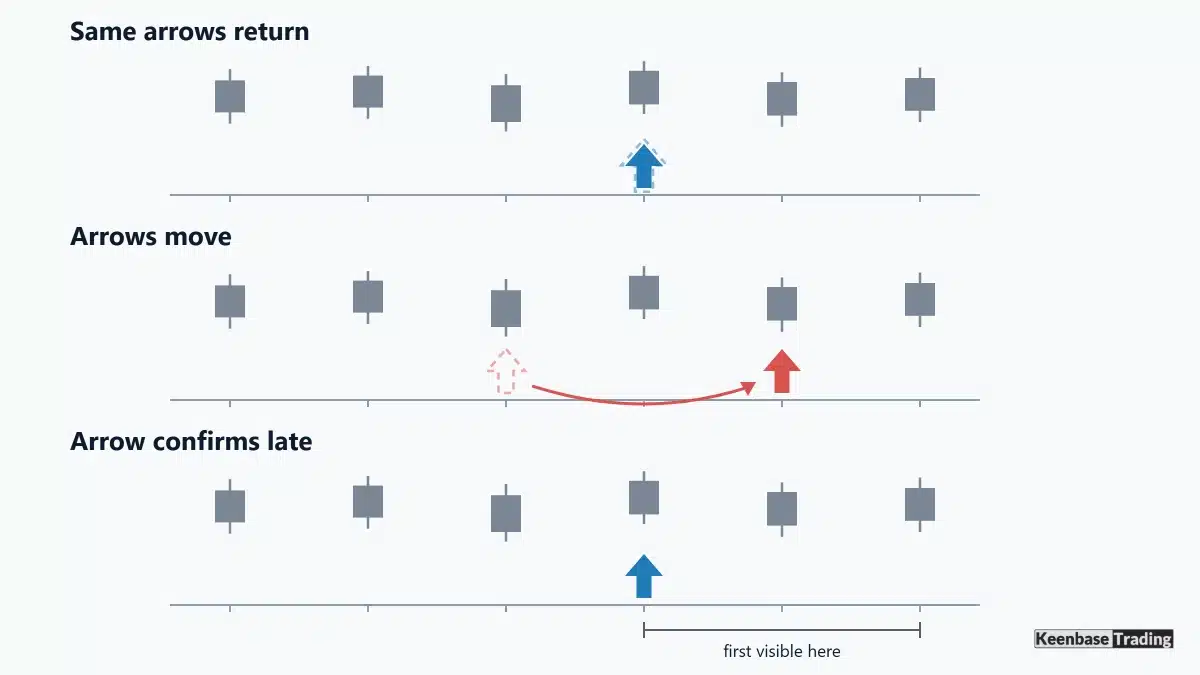
Three behaviours, one identical chart
Set what happened live beside what the finished chart shows and three outcomes matter. They are not variations on a theme. They are different products with the same photograph.
| Behaviour | What happened live | What the finished chart shows |
|---|---|---|
| Same arrows return | The arrow appeared when it claims and stayed | An honest record |
| Arrows move | An arrow shifted, flipped or vanished | A cleaner history than anyone traded |
| Arrow confirms late | The arrow was drawn on an older bar once later bars agreed | A price that was never on offer |
The middle row is repainting in the sense everybody knows to ask about. The third row is the one that costs people money quietly, because nothing moves. Once the arrow appears it stays, so the usual repaint check passes.
Some traders call that late plotting repainting too, and there is a fair argument for it. The label matters less than the consequence: the price printed beside the arrow was no longer available by the time the arrow existed.
Traders who have been caught by it once stop asking whether an indicator repaints. They start asking when the arrow becomes visible relative to the candle it is drawn on, which is the better question and the one the rest of this page answers.
The test, step by step
The Strategy Tester handles the first three steps directly, which is why this does not require weeks of live observation. Step 4 needs a live or demo chart, and Step 5 is arithmetic on what the first four showed you. Pick one symbol and one timeframe.
Step 1: replay the indicator in visual mode
Open the MT5 Strategy Tester, attach the indicator, choose Every tick modelling and switch on visual mode. Drag the speed control well down, low enough that you can watch a single bar build.
The tester feeds bars forward in sequence, so an indicator cannot borrow a bar that has not happened yet. A finished chart is where it can.
Step 2: watch the moment the arrow appears
There are three things it can do, and you are simply recording which one.
- While the candle is still forming: an intrabar signal. Not automatically a fault, but it can vanish before the close, so it must never be read as a confirmed one.
- On the first update after its candle closes, drawn on that closed candle: a clean closed-bar signal. Note that this is still not the candle’s closing price. An indicator recalculates on an incoming tick, so the earliest you can act is the first price quoted after the bar ended.
- Later, on a candle that closed a while ago: the case Step 3 is about.
Step 3: keep going for ten more bars
Pause when an arrow prints, note the bar it is on, then let the tester run at least another ten bars and look again.
If the arrow is still on the same bar, it survived. If a new arrow has appeared behind the current price, on a bar that had already closed with nothing on it, you have just watched confirmation delay happen. No amount of reading a sales page would have shown you that.
Step 4: force a history reload on a live chart
The tester cannot do this one, and it is the step tied to the documented behaviour above.
Screenshot a live or demo chart with several arrows on it, noting bar times rather than shapes. Then force the recalculation. Scrolling back until MT5 actually requests older bars from the broker is the closest match to the documented condition.
Removing the indicator and reattaching it also works, and it is worth doing as well, though it is a different mechanism: it starts a fresh instance rather than changing the history. Then compare the two screenshots arrow by arrow, against bar times.
Anything that has moved to a different bar, changed direction or disappeared is repainting, and no setting fixes it. Do it on a second symbol as well, because an instrument with thinner history or a different session structure can behave differently.
Step 5: price the signal at the moment it became knowable
This is the step that turns the other four into a decision. Take one arrow and ask what you could actually have paid.
If the arrow was confirmed as soon as its bar closed, the answer is the first price quoted after that, which is close to the arrow. If it was confirmed later, the answer is wherever price had reached by then.
Walk one through with your own figures. Say the arrow sits under a candle that closed at 1.0840, and Step 3 showed it only became visible two bars afterwards, with price by then at 1.0872. The trade you are judging is the one at 1.0872, not the one at 1.0840.
That is 32 pips, because 1.0872 minus 1.0840 is 0.0032. Those pips have been taken out of the distance to the target and added to the distance to the stop, and the finished chart shows none of it. Repeat the subtraction on several arrows and you will see how far the tradeable version sits from the one you were shown.
An arrow that passes all five is still not a trade
Suppose the indicator survives. You now own something genuinely useful: a signal that is honest about when it fired. You still do not own a trade.
An arrow answers one question, which is direction. A trade needs three more answers, and none of them are on the chart.
Invalidation: which price proves the idea wrong, and is it far enough away to survive normal noise?
Exit: where is profit taken, and was that decided before the position existed or during it?
Selection: what tells you to skip a technically valid arrow? Every signal method has conditions it should stand down in. One worth checking first is low-volatility compression, where price crosses the calculation repeatedly without going anywhere.
The same gap shows up in our support inbox. The first practical question a buyer asks is whether the indicator repaints. Once it has proved itself clean, the next one is how to turn the signal into a complete trade, and it follows quickly. By then the arrow was clearly never the missing piece.
What a complete signal puts on the chart
That gap is what KT Alpha Hunter Arrows was built to close, so it is worth being specific about what it prints rather than describing it in adjectives.
Closed bars only: arrows appear after the bar has finished, once price has pushed beyond an adaptive volatility band with strength, and they stay where they are. No intrabar signals, no mid-candle shifts, no retroactive changes.
Closed-bar behaviour is exactly what Steps 1 to 4 are built to check, and it is what the product page commits to in its own FAQ.
The whole trade at once: the entry, a stop placed beyond the nearest swing with breathing room rather than at a fixed pip distance, and four targets from TP1 to TP4, all printed at the moment the arrow appears. The exits exist before the position does.
A verdict, not just a signal: an Edge Dashboard rates buy setups and sell setups separately for the chart you are on and says which side, if either, is worth trading. A one-click Auto Optimize tunes the settings to that symbol and timeframe first.
Account rules in view: a Prop Firm Risk Panel shows daily and total drawdown, open risk across every position, the next high-impact news event, and session and weekly-close context, on the chart rather than in a spreadsheet.
Management after entry: an included Trade Manager EA takes the entry, stop and four targets and runs one of five plans you choose up front, from taking everything at TP2 to banking a portion and leaving a runner to TP4.
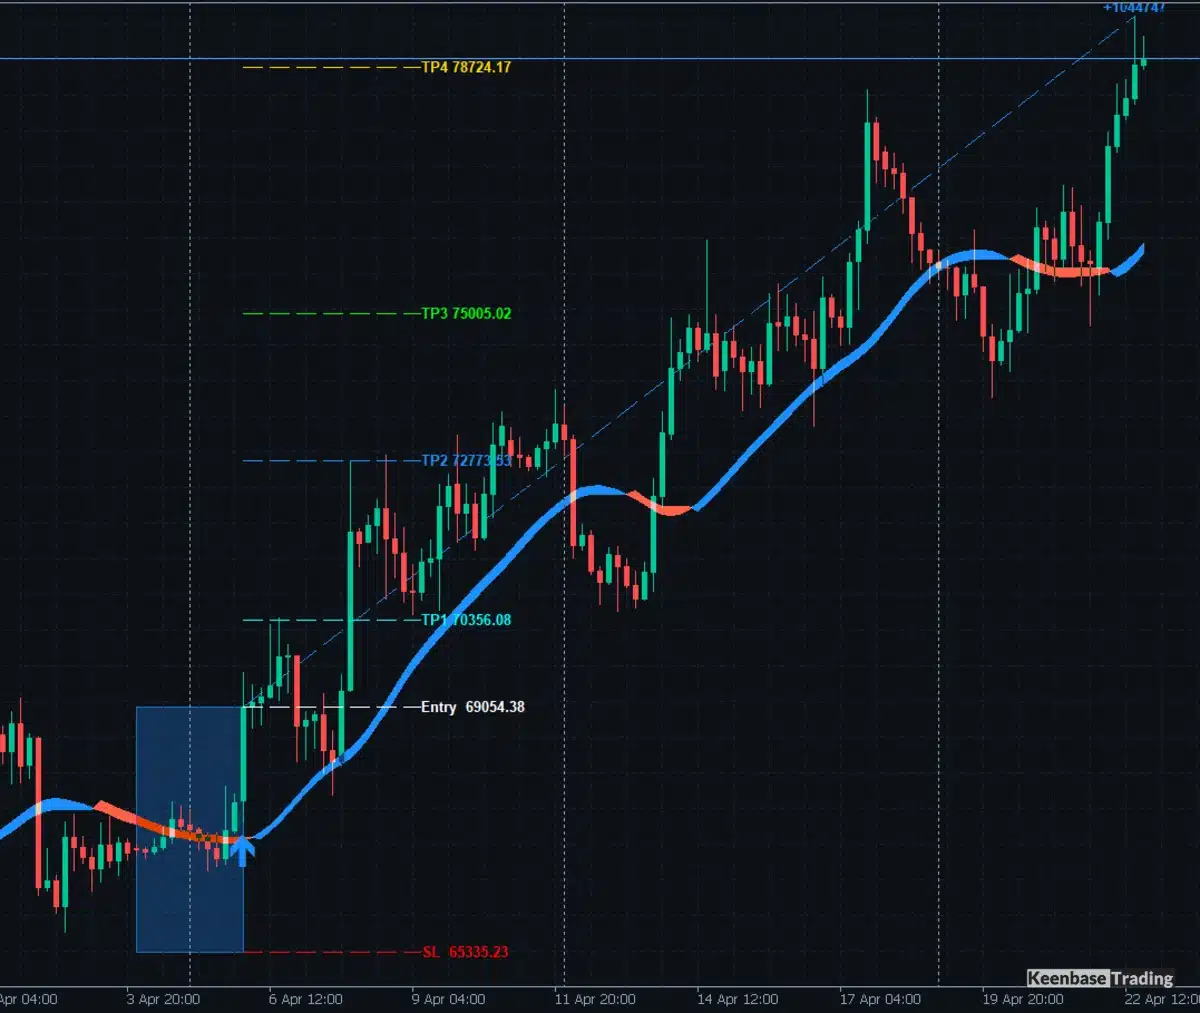
Two limits belong in the same breath as those features. The Trade Manager EA never opens a position by itself, so every entry is still your click. And the risk panel makes the rules visible, which is not the same as enforcing them: no MetaTrader tool can stop a trader opening a position by hand, and none of this is a profit guarantee.
Start with the indicator you already have
Do not start by shopping. Load whatever is currently on your chart into the Strategy Tester tonight and run Steps 1 to 3, because the result changes what you should be looking for.
If the arrows hold, you own an honest signal and what you are missing is the structure around it: the stop, the targets, and a reason to skip the side that is not working. If they move, you have just found out why the chart looked so convincing, and you have saved yourself the strategy you were about to build on top of it.
Either way the next indicator gets judged on evidence you produced, which is a better position than any list of the best MT5 indicators can put you in.
If you would rather the arrow arrived with the entry, the stop, four targets, a verdict on which side has the edge and a plan that runs itself after you enter, that is what the full toolset does.
See what KT Alpha Hunter Arrows plots on your chart
About this article
Published by Keenbase Trading, which has been trading since 2018 and builds MT4 and MT5 indicators, Expert Advisors, free trading tools and custom MetaTrader development.
Platform behaviour can change between builds, so verify it on your own terminal before relying on it.