
Inside Bar Trading Strategy: Which Inside Bars to Trade and Which to Skip
Most inside bar guides end with the same advice: trade the pattern at a key support or resistance level. They do not say which level. And when you put a support and resistance indicator on a chart, you find a level near almost every inside bar, so that advice does not filter out anything.
This strategy gives you a rule you can check on the chart in a few seconds. You trade an inside bar only when it forms at a strong level: a support or resistance level that price has already turned away from on most of its past visits. Every other inside bar, you skip.
The complete rules for buying and selling come next, then one real trade followed candle by candle, four more real trades and one that failed, and finally what this single rule changed across five markets.
What an Inside Bar Is
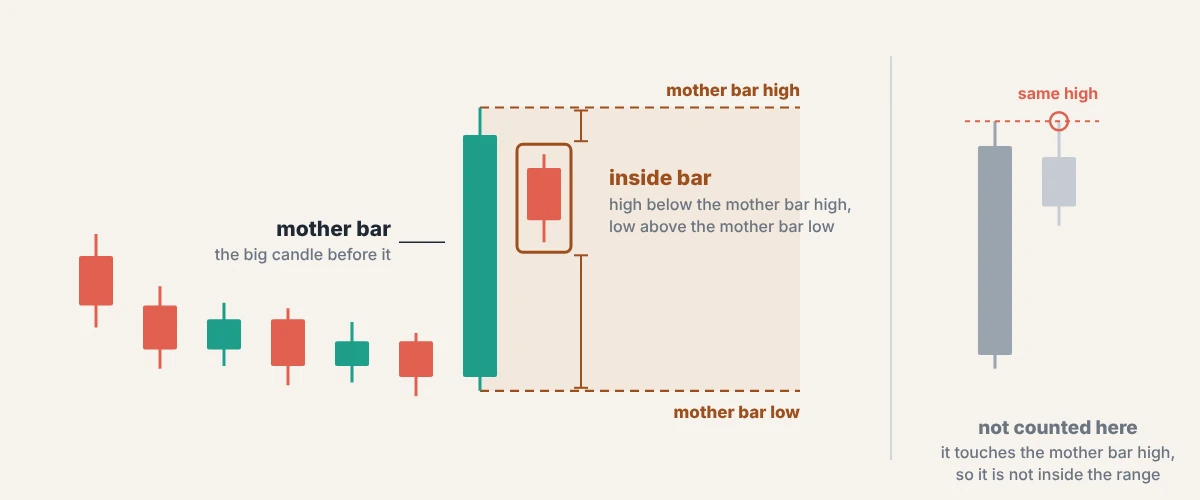
An inside bar is a candle whose high is lower than the high of the candle before it, and whose low is higher than the low of the candle before it. The bigger candle before it is called the mother bar. The inside bar sits completely within the range of the mother bar.
Some traders also count a candle that touches the high or the low of the mother bar exactly. This strategy uses the strict version only. The high of the inside bar must be below the high of the mother bar, and its low must be above the low of the mother bar.
An inside bar is a pause. The market made a big move with the mother bar and then stopped for one candle. The pause on its own does not tell you whether price will go up or down next.
The trade direction comes from the side where price moves past the mother bar: above its high, or below its low. In this strategy, the inside bar indicator shown further down tells you which side to trade.
An inside bar is one of the simplest candle patterns, so it appears on the chart very often. That is why it needs a rule that tells you which inside bars to ignore. The pin bar, another common candle pattern, needs the same kind of rule, and our pin bar trading strategies cover it.
Why Most Inside Bars Are Not Worth Trading
A pause can be followed by anything: a move that keeps going, a move that turns around, or a few more quiet candles.
The classic way to trade an inside bar is to place a buy stop order just above the high of the mother bar and a sell stop order just below its low. Whichever order price reaches first becomes the trade, and you delete the other order. Traded that way, every inside bar becomes a trade.
A buy stop order is an order to buy if price rises to a price you choose in advance. A sell stop order is an order to sell if price falls to a price you choose in advance. Your broker holds the order and fills it only if price gets there, so you do not have to watch every candle.
The trouble is that the pattern on its own tells you very little about which way the market will go next.
The usual fix is to trade it at a key level. But what counts as a key level?
A support and resistance indicator can put dozens of lines on a chart. It draws turning points from the daily, weekly and monthly charts and pivot points. It also draws the high, low, open and close of the previous day, week and month.
We checked the inside bars this strategy trades on five markets. More than nine out of every ten were already sitting at one of those levels. A rule that keeps nine inside bars out of ten does not filter out much.
What separates one level from another is its record. A level that price has turned away from again and again is not the same as a level that price keeps breaking through. This strategy uses that record, and one indicator shows it on the chart:
Each time price comes back to a level is called a touch.
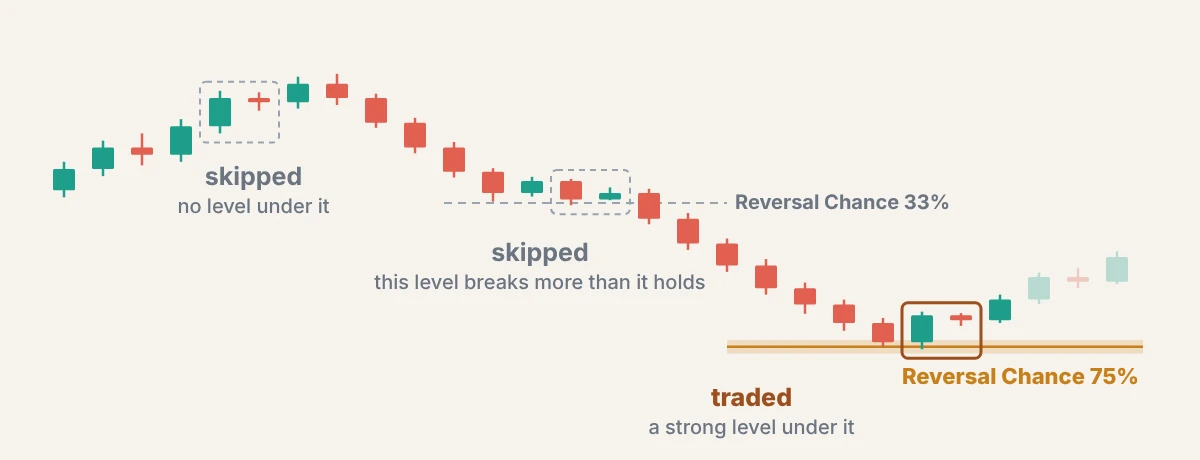
On every level, KT Auto Support Resistance Levels Indicator shows a number called the Reversal Chance: the percentage of touches where price turned away from the level instead of breaking through it. A level with a Reversal Chance of 75 percent over 4 touches turned price away 3 times out of 4.
Some levels are drawn as a single line. Levels that sit close together are joined into one Smart Zone, drawn as a box with a top and a bottom. In the rules below, a level drawn as a single line has its top and its bottom at the same price.
In this strategy, a strong level is a level with a Reversal Chance of 60 percent or more, over at least 2 touches. A new level that price has not come back to yet does not count, because it has no record to judge. Its label reads Fresh.
Our support and resistance trading strategies use the same two numbers to trade price bouncing off the levels. In this strategy, the two numbers decide which inside bars you trade.
The Indicator That Finds the Inside Bars
You could find inside bars by eye, but this strategy uses an indicator that does more than find them. KT Inside Bar Advanced marks only the inside bars that form after a large candle and in the direction of the trend. For each one, it draws the entry line, the stop loss line and three target lines.
On every signal you see an arrow on the inside bar, the entry line, the stop loss line and three target lines.
For a buy signal, if price falls below the low of the mother bar before it reaches your entry line, KT Inside Bar Advanced cancels the signal, and you delete your order. For a sell signal, the same happens if price rises above the high of the mother bar first.
By default, KT Inside Bar Advanced then removes the cancelled signal from the chart.
That cancellation answers a question many traders ask about inside bars: what to do with an order that price never reaches. You do not leave it on the chart and hope.
Does This Inside Bar Qualify?
Ask three questions, in this order. If the answer to any one of them is no, you skip the inside bar and wait for the next one.
QUESTION 1
Has KT Inside Bar Advanced marked this inside bar?
An arrow on the inside bar, with the entry line, the stop loss line and the target lines drawn.
No: skip it. It is not a signal.
QUESTION 2
Did price come down to a strong support level in the last few candles, and did the inside bar close back above it? (For a sell: up to a strong resistance level, and a close back below it.)
Use the stop loss line of KT Inside Bar Advanced. For a buy: the stop loss line is at or below the top of the strong support level, and the inside bar closed above the top of that level. For a sell: the stop loss line is at or above the bottom of the strong resistance level, and the inside bar closed below its bottom.
No: skip it. This inside bar is not sitting on a level with a good record.
QUESTION 3
Was that level already on the chart before the mother bar formed?
The label on each level shows its age, such as 3 days or 11 months. If the level appeared only in the last few hours, while these same candles were forming, it does not count.
No: skip it. A level made by these same candles has no record yet.
Yes to all three: place the order at the entry line of KT Inside Bar Advanced.
The second question takes a second to check. For a buy, KT Inside Bar Advanced draws the stop loss line just below the most recent candles. For a sell, it draws the stop loss line just above them.
So if the stop loss line is at or below a support level, price has just been down to that level. And if the inside bar closed above the level, price has come back up. That is the sign you want before you buy: price went down to the support level, and the support level held.
The Trading Rules
Here are the complete rules. The sell rules are the buy rules turned upside down.
Buy rules
- KT Inside Bar Advanced shows a buy signal on the inside bar.
- A strong support level was on the chart before the mother bar formed: a Reversal Chance of 60 percent or more, over at least 2 touches.
- The stop loss line of KT Inside Bar Advanced is at or below the top of that support level, and the inside bar closed above the top of the level.
- Place a buy stop order at the entry line.
- Set the stop loss at the stop loss line.
- Set the profit target at the third target line, the furthest of the three.
- If KT Inside Bar Advanced cancels the signal before your order is filled, delete the order.
- If a newer signal on the same market passes all three questions while your order is still waiting, delete the old order and place the new one.
- While a trade is open on a market, ignore new signals on that market.
- If the trade is still open five trading days after your order was filled, close it at the market price.
Sell rules
- KT Inside Bar Advanced shows a sell signal on the inside bar.
- A strong resistance level was on the chart before the mother bar formed: a Reversal Chance of 60 percent or more, over at least 2 touches.
- The stop loss line of KT Inside Bar Advanced is at or above the bottom of that resistance level, and the inside bar closed below the bottom of the level.
- Place a sell stop order at the entry line.
- Set the stop loss at the stop loss line.
- Set the profit target at the third target line, the furthest of the three.
- If KT Inside Bar Advanced cancels the signal before your order is filled, delete the order.
- If a newer signal on the same market passes all three questions while your order is still waiting, delete the old order and place the new one.
- While a trade is open on a market, ignore new signals on that market.
- If the trade is still open five trading days after your order was filled, close it at the market price.
Choose your trade size so that, if price reaches your stop loss, you lose the same small part of your account on every trade. The comparison further down used 1 percent of the account per trade.
Results on this page are given in R. R is the amount a trade risks, which is the distance from the entry to the stop loss. +1.6R means the trade made 1.6 times what it risked.
Why the level must be older than the mother bar
The Reversal Chance describes how price behaved at a level in the past. If the level was created by the same candles you are about to trade, it has no past yet, and its number means nothing. So the level has to be on the chart before the mother bar forms.
Why the third target and not the next level
It is tempting to aim for the next support or resistance level instead.
But the stop loss on an inside bar trade is close to the entry, and the levels of KT Auto Support Resistance Levels Indicator sit close together. The next level is usually so near that the trade would earn hardly more than it risks, so the strategy uses the third target line, the furthest of the three.
Why the trade closes after five trading days
An inside bar trade is a bet that the pause ends with a move. If a full trading week has passed and price has reached neither the target nor the stop loss, the move did not come.
There is a second reason too. After a very large candle caused by an economic news release, the mother bar can be huge. The stop loss and the target then end up very far away, and without a time limit such a trade could stay open for months.
One Trade, Candle by Candle
Here is one real trade on the one hour chart of gold (XAUUSD), followed in the order a trader would see it.
The level: A daily swing support sat at about 1,879: a low on the daily chart that price had turned up from before. Price had touched it 5 times and turned away 3 times, a Reversal Chance of 60 percent. That is just enough to count as a strong level.
The dip below the level: The afternoon before the mother bar formed, price fell through the level and spent the night below it. Early the next morning it climbed back above the level, and two large rising candles followed. The second of them, the mother bar, reached a high of 1,884.94.
The inside bar: The next candle stayed completely inside the range of the mother bar and closed at 1,883.56. KT Inside Bar Advanced marked it with a buy signal. It drew the entry line at 1,884.96, just above the high of the mother bar, the stop loss line at 1,874.68, and the third target line at 1,901.07.
The three questions: KT Inside Bar Advanced had marked the bar, so the first answer was yes.
The stop loss line at 1,874.68 was below the support level, and the inside bar closed at 1,883.56, above the level, so the second answer was yes. The label showed that the level had been on the chart for months, so the third answer was yes. The buy stop order went in at 1,884.96.
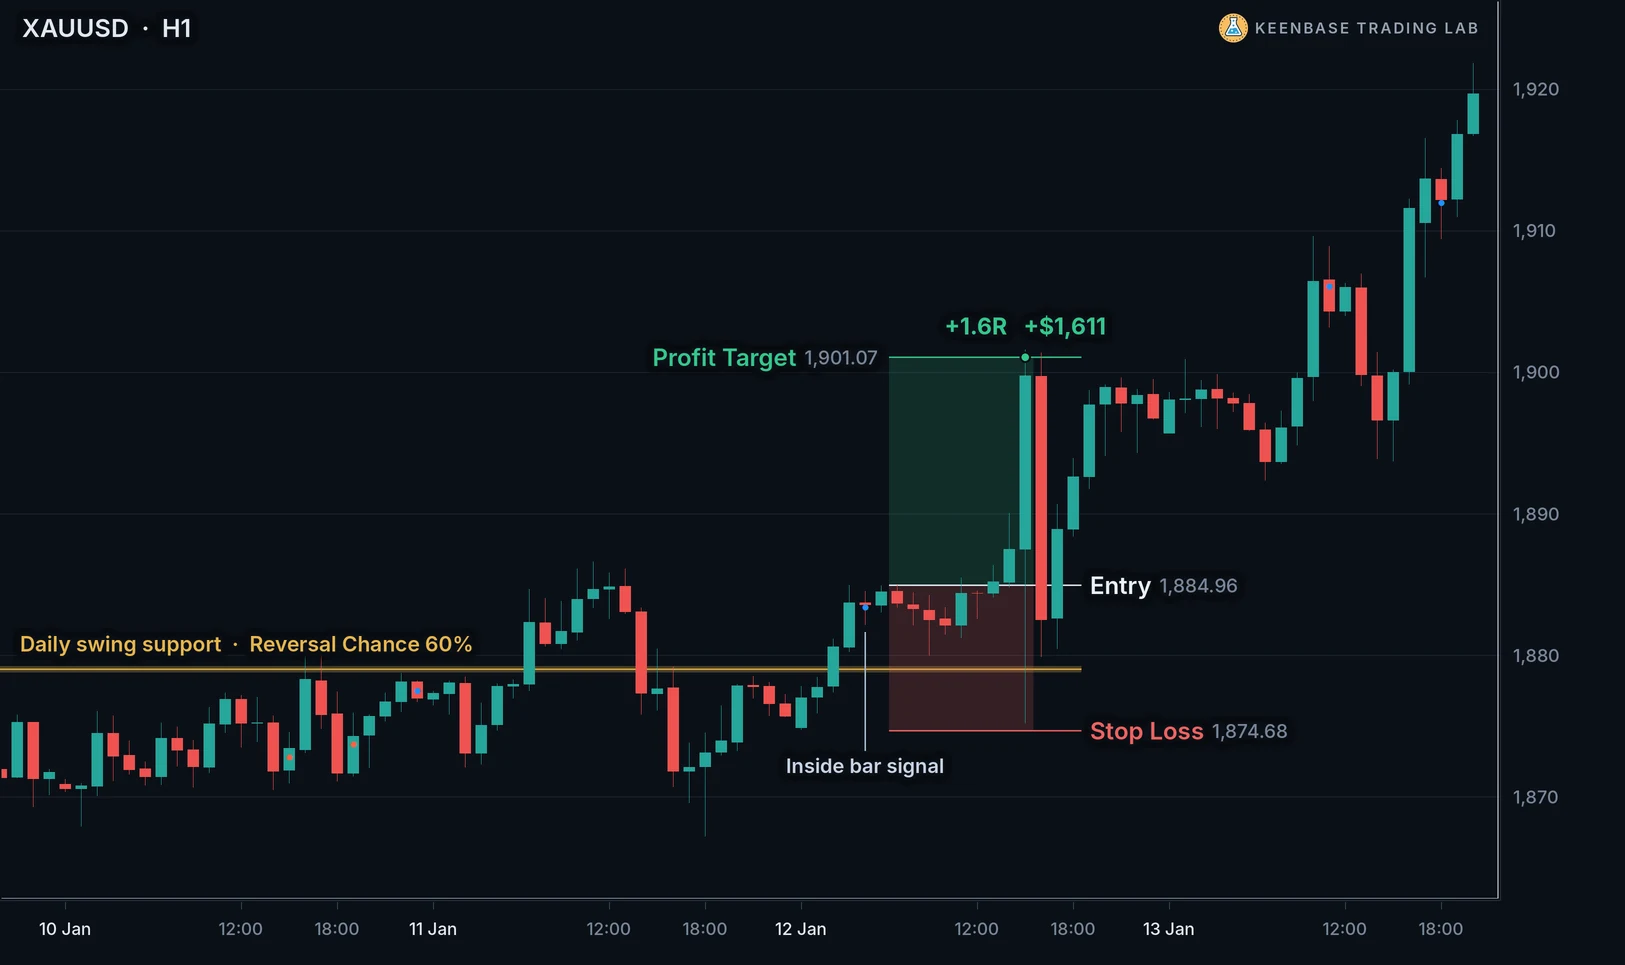
The trade: Two candles later, price rose to 1,884.96 and the order was filled. Over the next few hours price drifted back down to 1,879.98, close to the support level but well above the stop loss. Then a very large candle during an economic news release carried price up through the target at 1,901.07.
The result: +1.6R, as the chart shows. The trade made 1.6 times what it risked.
Next to the +1.6R figure, the chart shows what the same move was worth on one standard lot of gold, which is a trade size of 100 ounces, before trading costs. Your own figure depends on the size you trade.
Notice what was never needed: a judgement about whether the level looked important. The record on the level made that decision.
Four More Trades, and One That Failed
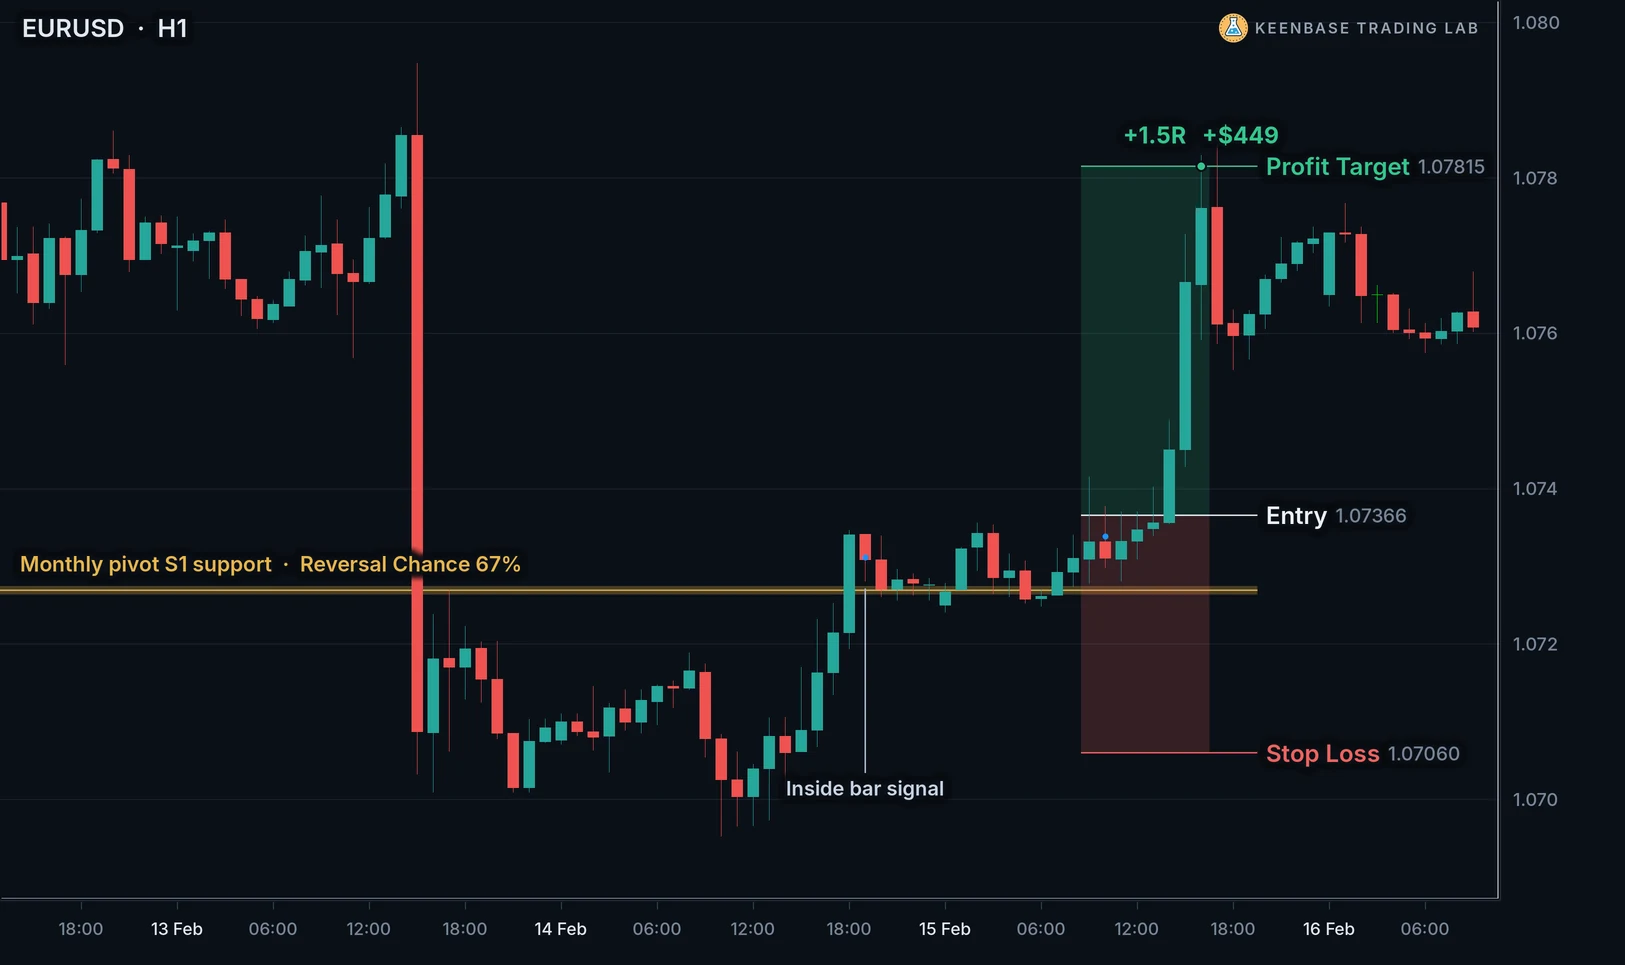
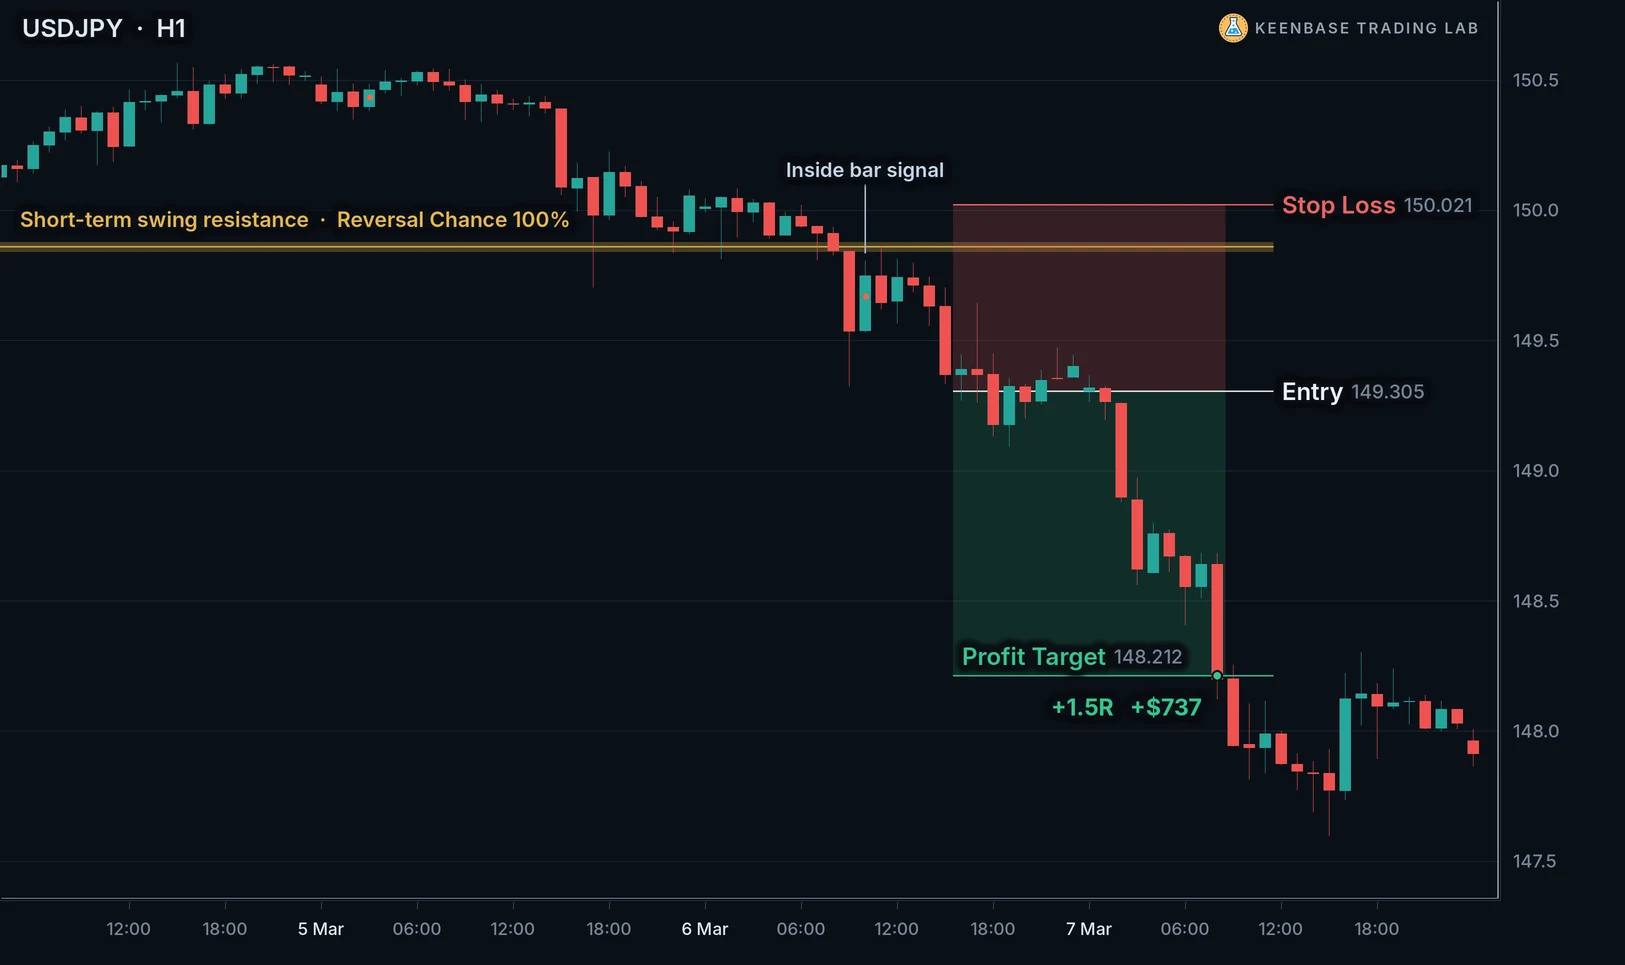
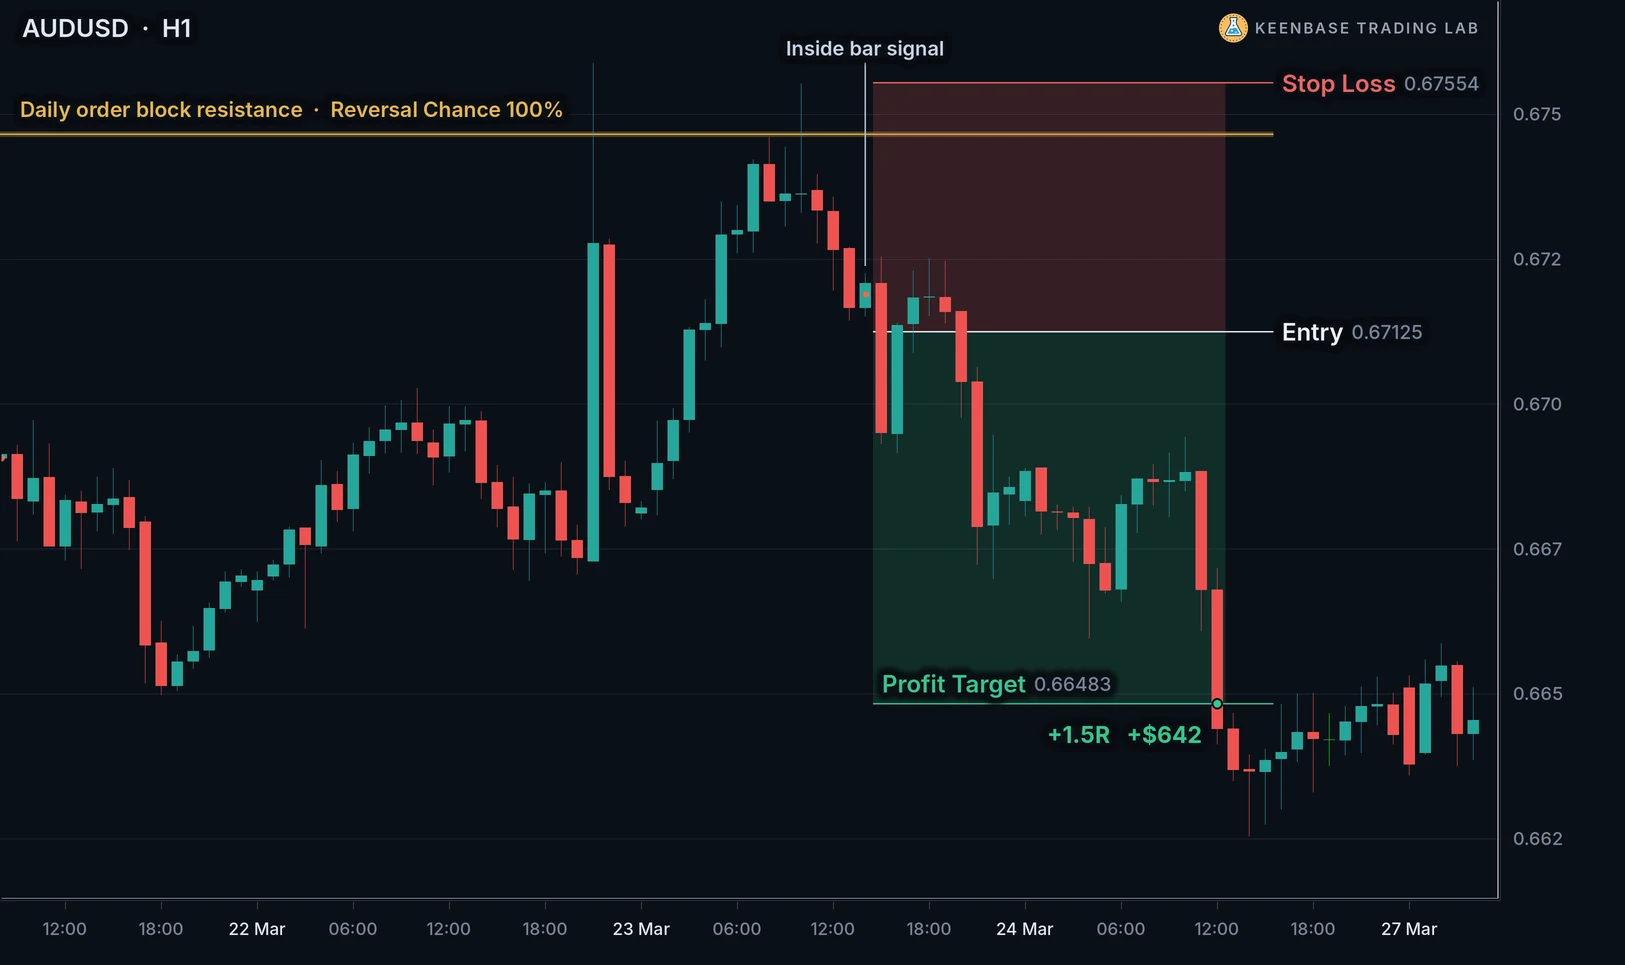
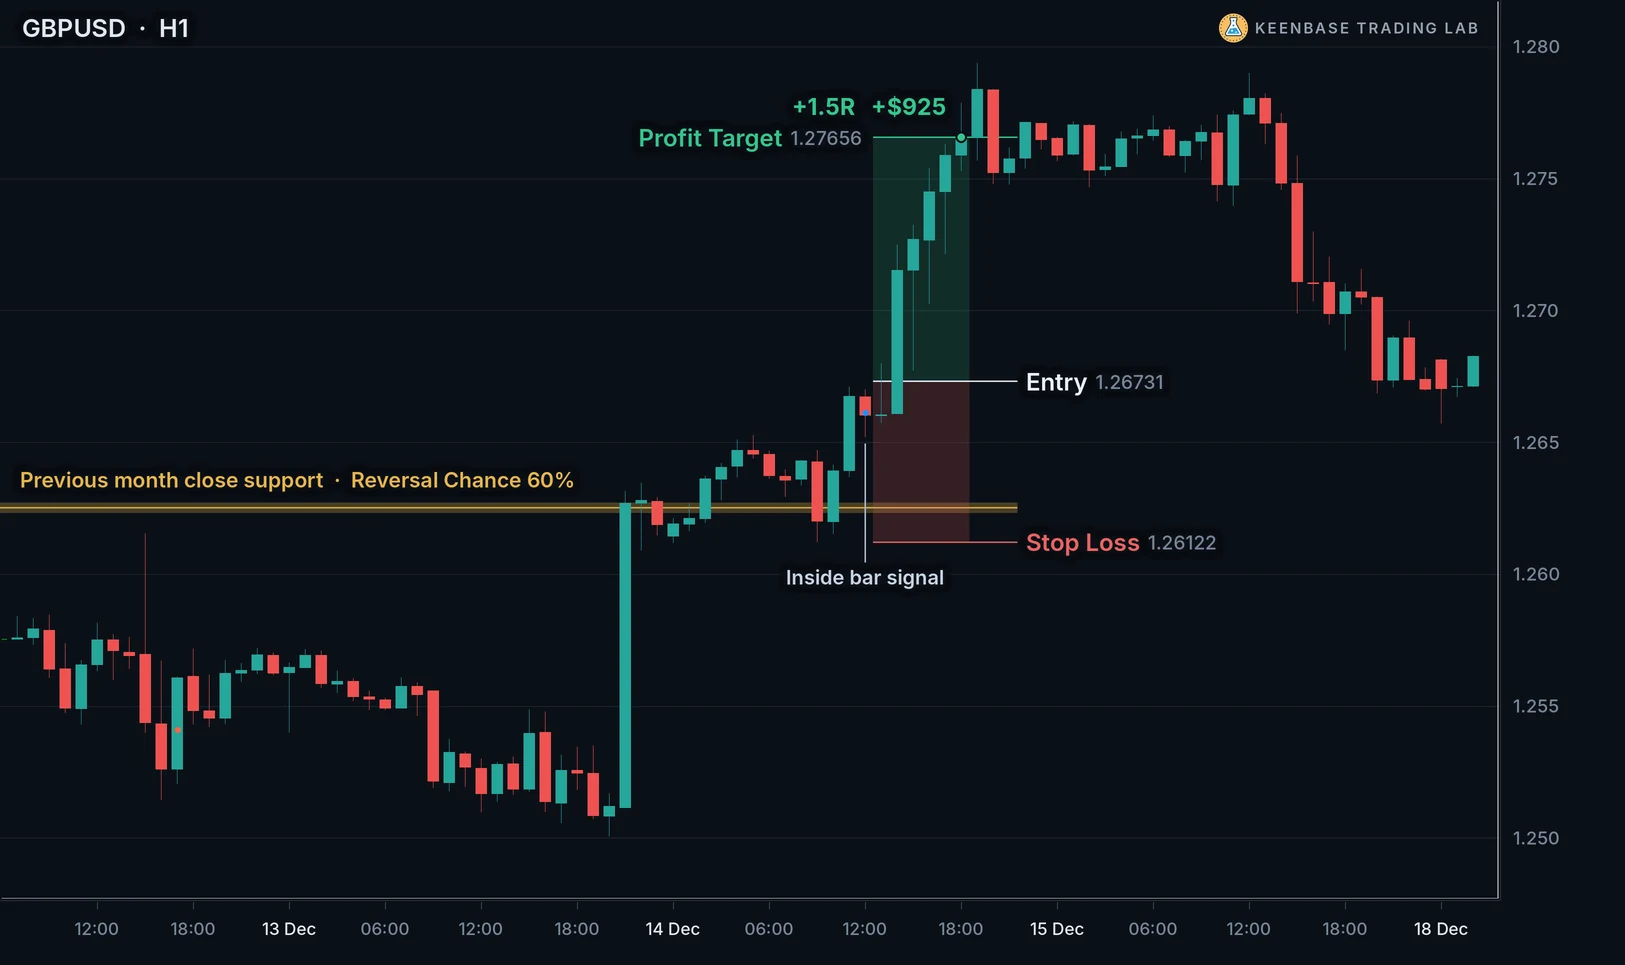
Four more real trades from the same rules, on four different markets, each at a different kind of level.
The kind of level is part of the label that KT Auto Support Resistance Levels Indicator puts on it. Monthly, weekly and daily mean the level comes from that chart. Short-term means the level comes from the chart you are trading, here the one hour chart.
A swing is a turning point where price reversed. A pivot is a level calculated from the previous period’s high, low and close. An order block is the area of the last candle before a strong move.
The previous day, week and month levels are the high, low, open and close of that period. You do not need to work any of these out: KT Auto Support Resistance Levels Indicator draws them and shows the Reversal Chance on each one.
Not every trade that passes the three questions works. Here is the trade that failed: a buy on AUDUSD at a short-term order block support.
The level had turned price away both times price came back to it, a Reversal Chance of 100 percent over 2 touches. The inside bar closed above it and the buy stop order was filled. Then price fell back through the level and reached the stop loss, so the trade closed at a loss.
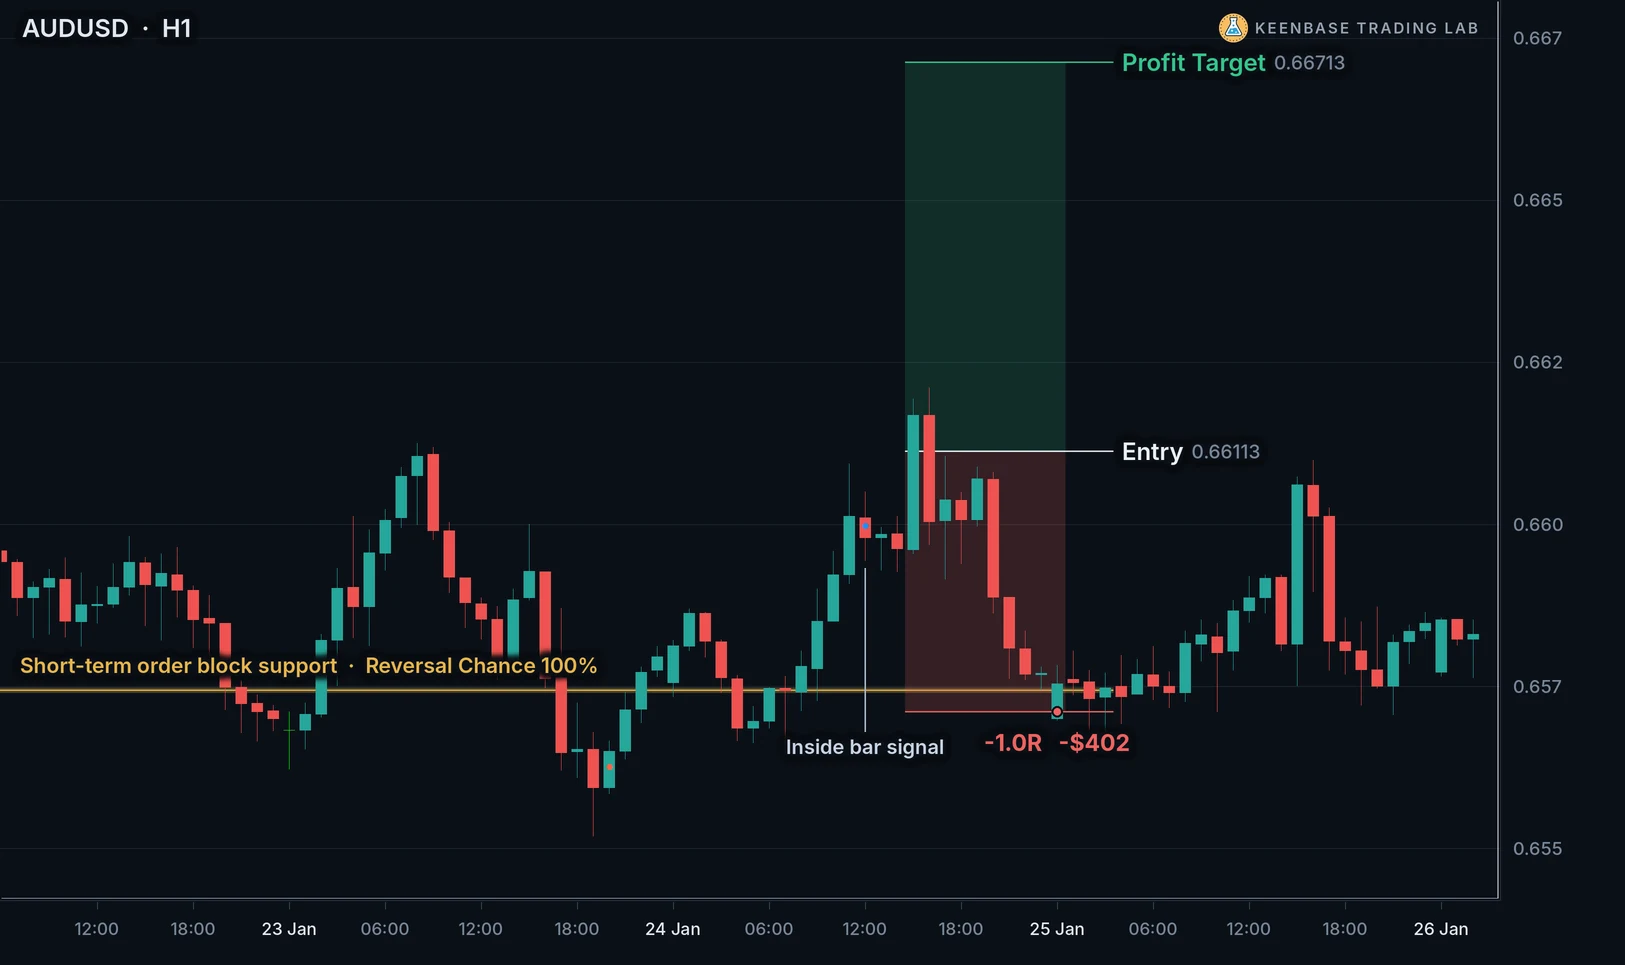
A Reversal Chance describes the past of a level. It does not promise the next visit. A level with only 2 touches has a short record, and even a level with a long record can stop working. What keeps a losing trade small is the stop loss, placed before the trade starts and never moved further away.
What the Strong Level Rule Changed
To see what the strong level rule actually does, we compared three ways of trading the same inside bar signals. The first takes every signal from KT Inside Bar Advanced. The second takes only the signals at a strong level. The third takes the signals at any level, strong or not.
Everything else was the same: the entries, the stop losses, the targets and the five day exit.
The comparison covered five markets on the one hour chart: EURUSD, GBPUSD, USDJPY, AUDUSD and gold. It ran over two separate periods: a first period of seven years, and a second, later period of two years. Every trade risked 1 percent of the account.
Trading costs were included: the spread (the difference between the buy price and the sell price), the broker commission and the swap (the fee for holding a trade overnight).
The deepest drop in the account, often called the maximum drawdown, is the biggest fall from a high point of the account to a later low point. It is the part of trading that makes most people give up a strategy.
| Compared with taking every signal | At any level | At a strong level |
|---|---|---|
| Share of all signals that were traded | 97% | 36% |
| Markets where the deepest drop in the account was smaller | 3 of 5 | 5 of 5 |
| Average result per trade, all five markets together | No better | Better |
| Markets where the average result per trade improved | 3 of 5 | 3 of 5 |
| Compared with taking every signal | At any level | At a strong level |
|---|---|---|
| Share of all signals that were traded | 94% | 36% |
| Markets where the deepest drop in the account was smaller | 2 of 5 | 5 of 5 |
| Average result per trade, all five markets together | No better | Better |
| Markets where the average result per trade improved | 2 of 5 | 4 of 5 |
Five markets, one hour chart, trading costs included, 1 percent risk per trade.
So the strong level rule did two things in both periods. The deepest drop in the account was smaller on every one of the five markets. And the average result per trade, with all five markets together, was better.
The average result per trade improved on three of the five markets in the first period and on four of the five markets in the second period, not on every market. And the rule keeps only about one signal in three, so you will trade less often.
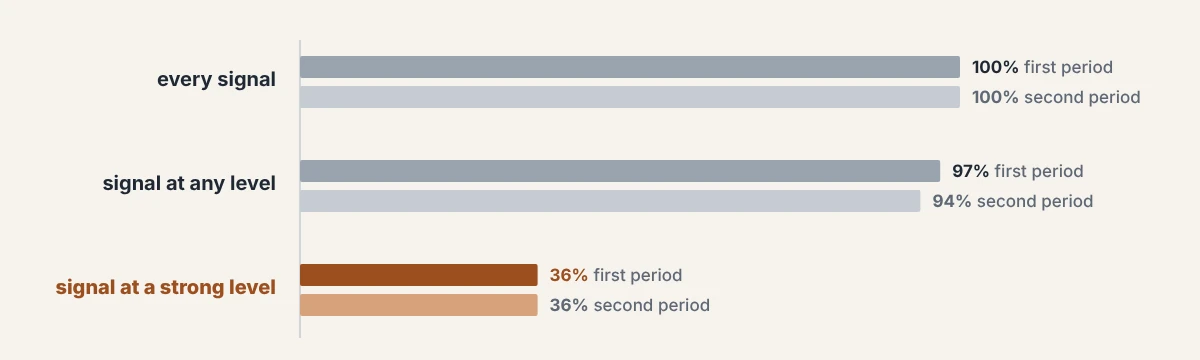
Look at the middle bars in the chart above. The version that took signals at any level kept more than nine signals in ten, and its average result per trade was no better. Being at a level is not the filter. Being at a level with a good record is the filter.
One honest limit: this is a comparison between ways of choosing from the same trades. It shows what the strong level rule changed. It does not say how much the strategy would make, and nothing on this page is a promise about the future.
Which Charts to Start On
Start on the one hour chart of the major currency pairs and gold. On the one hour chart, an inside bar is a pause in the market that lasts one hour.
KT Auto Support Resistance Levels Indicator draws levels from the daily, weekly and monthly charts, and also short-term levels from the chart you are trading. The comparison above measured this pairing on the one hour chart.
A 15 minute inside bar is a different trade. It is a pause of a quarter of an hour, and the stop loss is much closer to the entry. The spread, the small cost you pay on every trade, then becomes a much bigger part of the distance to the stop loss. This strategy was not tested on the 15 minute chart.
How to Test It on Your Own Charts
Before you risk money, check the rules on your own charts and your own broker. It takes an afternoon, and it is the only way to trust what you see.
- Open the one hour chart of one market and add KT Inside Bar Advanced and KT Auto Support Resistance Levels Indicator.
- Go back through the history one signal at a time. For every signal, answer the three questions and write down whether the inside bar qualifies or is skipped.
- Judge each old signal by what the level showed at that time. The Reversal Chance you see today also counts the touches that came after the old signal. To see the number as it was then, replay the chart in the MetaTrader Strategy Tester in visual mode, with both indicators on the chart, and judge each signal as it appears.
- For every inside bar that qualifies, write down the entry, the stop loss, the target and how the trade ended: the target, the stop loss or the five day exit.
- Keep a second column for the inside bars you skipped and how they would have ended. That is the same comparison as the tables above, on your own market.
- Collect at least 30 qualifying trades before you judge. A handful of trades can look great or terrible by chance.
- Then trade it on a demo account for a few weeks before you trade it with real money.
Both indicators run on MetaTrader 4 (MT4) and MetaTrader 5 (MT5):
| # | Name | Link |
|---|---|---|
| 01 | KT Inside Bar AdvancedMarks the inside bars worth considering and draws the entry, the stop loss and three targets for each one. MT4 and MT5. | Get Indicator |
| 02 | KT Auto Support Resistance Levels IndicatorDraws the support and resistance levels with their Reversal Chance, so you can see at a glance which ones are strong. MT4 and MT5. | Get Indicator |
Whatever market you trade, the question is the same every time: is this inside bar sitting on a level that price has turned away from before?
 Built by the Keenbase Trading Lab
The Keenbase Trading Lab is the research side of Keenbase Trading, where trading systems are designed and tested before anything is published about them.
A method reaches this blog only once it is complete enough to trade without guessing.
Keenbase Trading has been building MetaTrader indicators and Expert Advisors since 2018, alongside free indicators and custom MQL5 development. The systems published here come from the same people who build the indicators that run them.
Prices and market names differ a little from broker to broker, so test the rules on your own broker’s charts before you trade with real money.