
4 Hour Candle Breakout Strategy: Every Rule of the Range Break System
The highest win rate we have ever measured on a four-hour breakout system is 80.84 percent, and that configuration lost money.
It is not a trick of a short sample or one bad instrument. It happens when a target sits a quarter of the way to the stop: wins are frequent and small, losses are rare and four times the size, and the account still goes down.
The 4-Hour Range Break System trades one thing: a four-hour candle closing beyond its recent range. Its rules are stated precisely enough that two traders would take the same trades.
It runs on the H4 chart of instruments that trend and break out rather than drift back to the middle. One indicator draws all of it: the range, the break, the stop, and all three targets.
The System at a Glance
The 4-Hour Candle Breakout Strategy
- Timeframe: H4, and the rules are written for it.
- Instruments: markets that tend to trend and break out.
- What it catches: the continuation after price closes outside its recent range.
- Signal: a candle that closes above the top, or below the bottom, of the recent range the indicator draws.
- Direction rule: a buy cannot follow a buy. Signals alternate.
- Entry: market, at the open of the next candle.
- Stop: beyond the recent swing low or high the indicator marks, with a small buffer.
- Target: the final target the indicator draws, a little beyond the stop distance.
- Risk: 1 percent of the balance per trade.
Where the Range Comes From
The range is not drawn by hand and it is not a session box. On every completed candle, the indicator measures the recent highest high and lowest low, and treats those two prices as the current range.
The range covers several trading days of four hour candles. That is long enough that a break means something and short enough that the level is still in view on the chart.
The candle being judged is not part of its own range. The range is built only from the candles that came before it, which is why the break can be measured on that candle’s close without the candle moving the level it is breaking.
None of that has to be drawn by hand, and on an H4 chart it would be a chore to keep current. One indicator carries the whole system, and it is the only component in it.
Everything from here, the stop and the three targets included, is a line that the indicator puts on the chart.
The Break Is a Close, Not a Touch
A wick through the high is not a signal. The candle has to finish above it.
Price runs through a recent high several times a week and comes back inside before the candle ends. The close is what separates the two cases, and it is the single rule that removes most of the noise a breakout trader complains about.
It also means a signal can never appear mid-candle and then vanish, because a close does not change once it has printed.
The practical cost is that you wait. A break at 09:00 on a candle that closes at 12:00 is not tradable until 12:00, and the entry is later still.
Buy Cannot Follow Buy
This is the rule that makes the system unusual, and it is worth understanding before any chart.
The range break is symmetrical: price can close above the range or below it, and both happen in clusters. A strong market closes above its range high, then does it again two candles later, and again the day after. A system that takes every break takes all of them.
This one does not. After a buy signal, the system will not produce another buy at any distance, on any candle, until a sell signal has come first. The market has to break the other way before the same direction is available again.
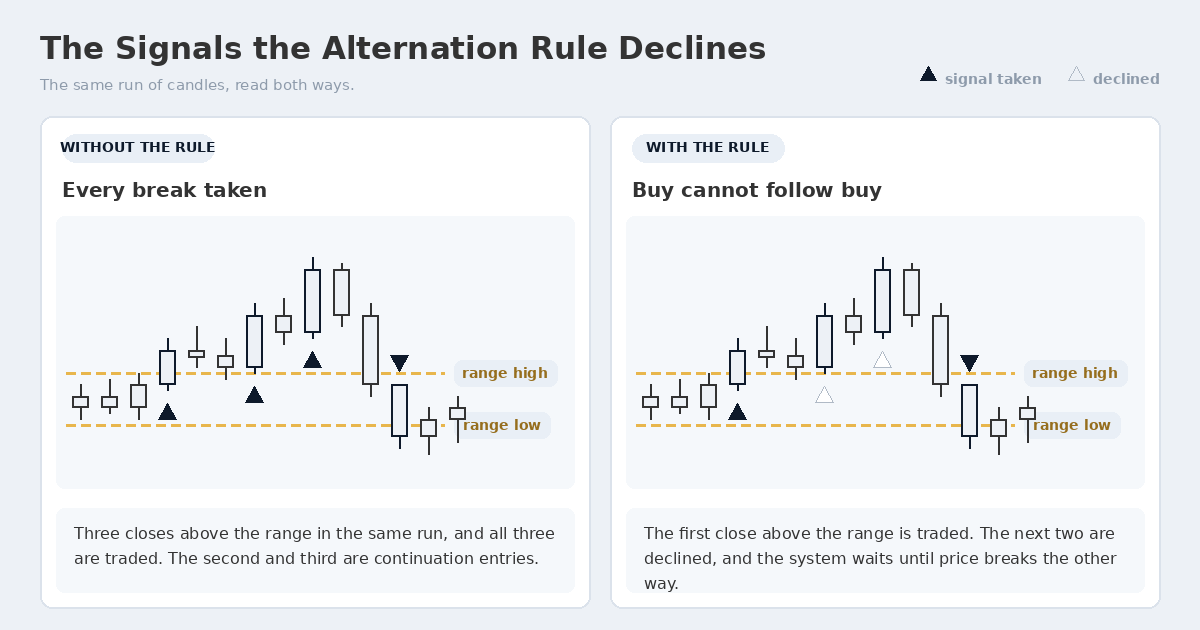
The second and third closes above the range are declined, and the system waits for a break the other way.
What that does, on the chart, is decline continuation. The second and third break in a strong run are exactly the entries that pay best in a trend, and the rule sits them all out. What it buys in exchange has been measured, and the answer is not the one a trend trader would guess.
The Stop, and Why It Sits Where It Does
For a long, the stop sits under the most recent swing low the indicator marks, with a small buffer below it.
That swing low is the most recent extreme the market made before the break. Price closing back below it says the break has failed rather than paused, which is the definition of invalidation this system uses. The buffer is there because a stop resting exactly on a visible low is the first one a small overshoot reaches.
A short mirrors it: the most recent swing high, with the buffer above.
The stop is placed when the trade opens and it does not move. There is no trail, no break even step and no partial exit.
The stop distance: the gap from the entry to that stop is the unit every target is measured in. Each of the three targets is a fraction or a multiple of it.
The Three Targets, and What Each One Costs
The indicator draws three targets on every signal, and the question our support desk answers about them most often is whether they are 1:1, 1:2 and 1:3. They are not, and the difference matters more than the names do.
- First target: a quarter of the stop distance.
- Second target: half the stop distance.
- Final target: a little beyond the whole stop distance, where the indicator draws it.
The first two are fractions of the risk rather than multiples of it. A trader taking the first target is risking four to make one.
Work the sum out and the problem is visible without any testing at all. Risking one to make a quarter needs four wins for every loss just to stand still, which is a strike rate of 80 percent before costs. Risking one to make a half needs two wins for every loss, about 67 percent.
The final target is the only one of the three that pays at least what it risks, and on the setups shown here it comes out between 1.1 and 1.2 times the risk.
Which target to take: the final one. That choice rests on the break even sums rather than on any result, since a target needing four wins in five to stand still leaves very little room for spread, commission and the occasional gap.
The target is set when the trade opens, and like the stop it does not move.
One Trade, Start to Finish
Gold, H4. The range high sat at 1343.87 after four days of compression under it. A candle closed at 1344.00, above the range, and the arrow printed on that candle.
- Entry: 1344.00, at the open of the next candle.
- Stop: 1329.90, under the recent swing low with its buffer. The stop distance is 14.10, which on one standard lot is 1,410 dollars.
- Target: 1360.43, the final target the indicator drew.
- Outcome: the target filled five days later, at 1.2 times the risk.
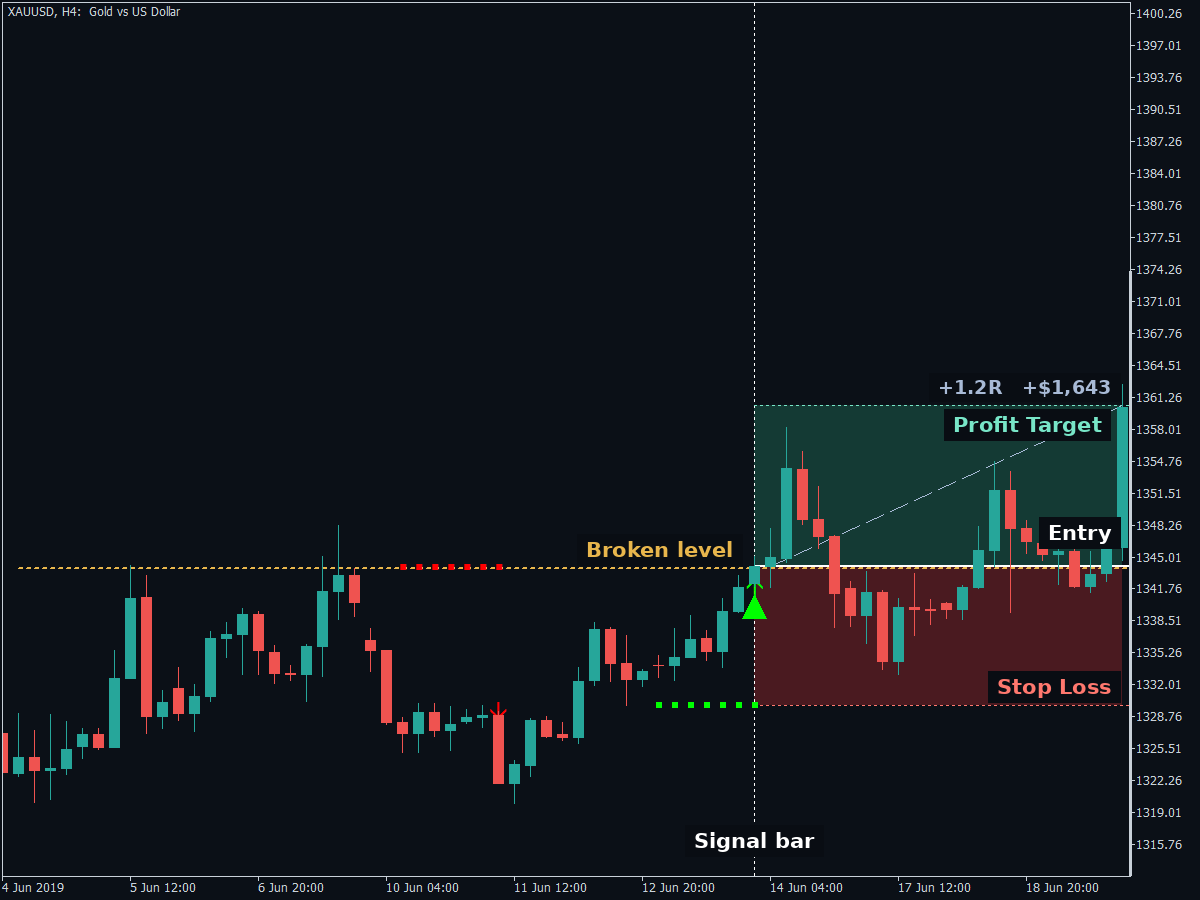
Gold H4. The close above the range, the entry at the next open, the stop under the recent swing low, and the target a little beyond one times the risk.
Two things in that sequence are worth slowing down for. The entry is the open of the candle after the signal, not the close of the signal candle, so the fill is rarely the level the arrow sits on.
The second is that the trade took five days. This system holds through weekends and through several sessions, which is part of why it lives on H4 rather than on a shorter chart.
Three More Signals, Same Rule Set
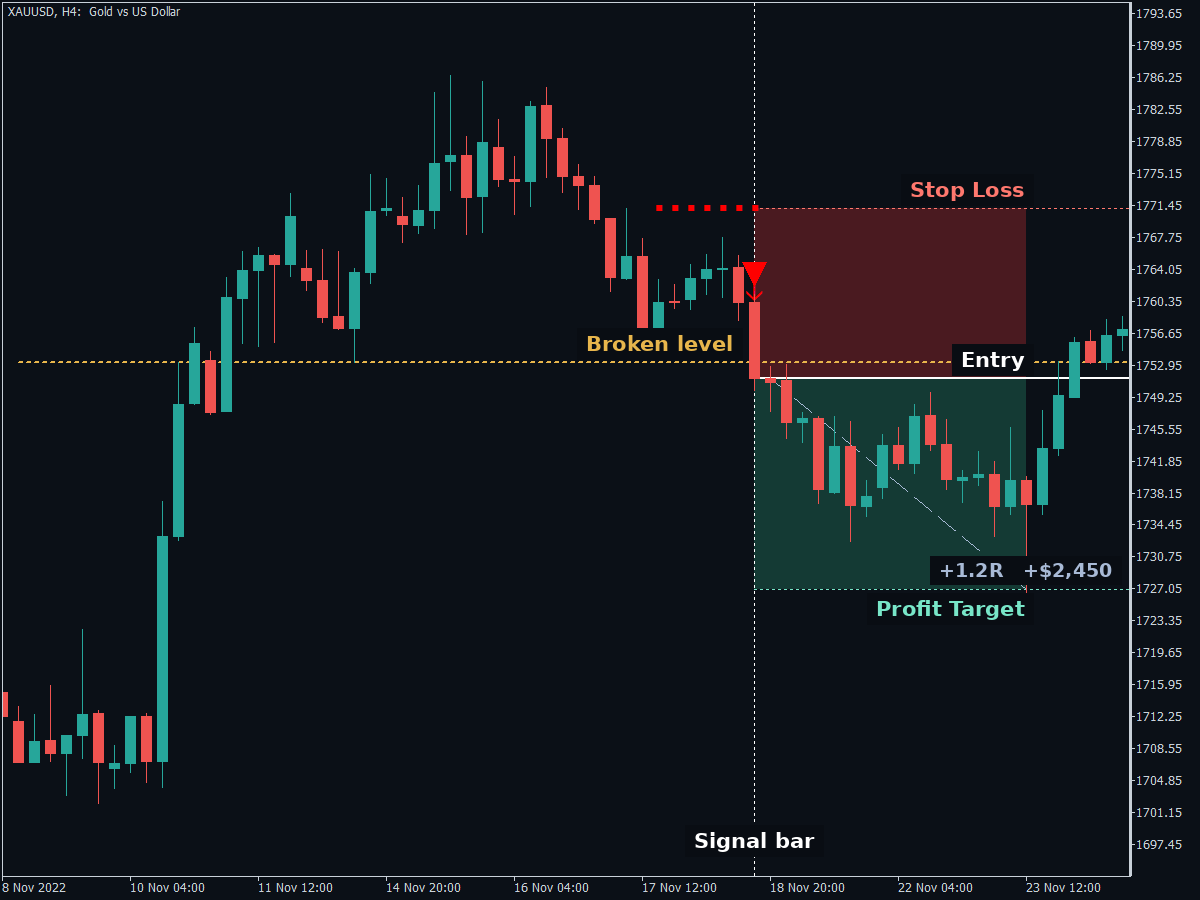
Gold H4, the short side. The close is below the range, the stop sits above the recent swing high, and the target is measured down from the entry.
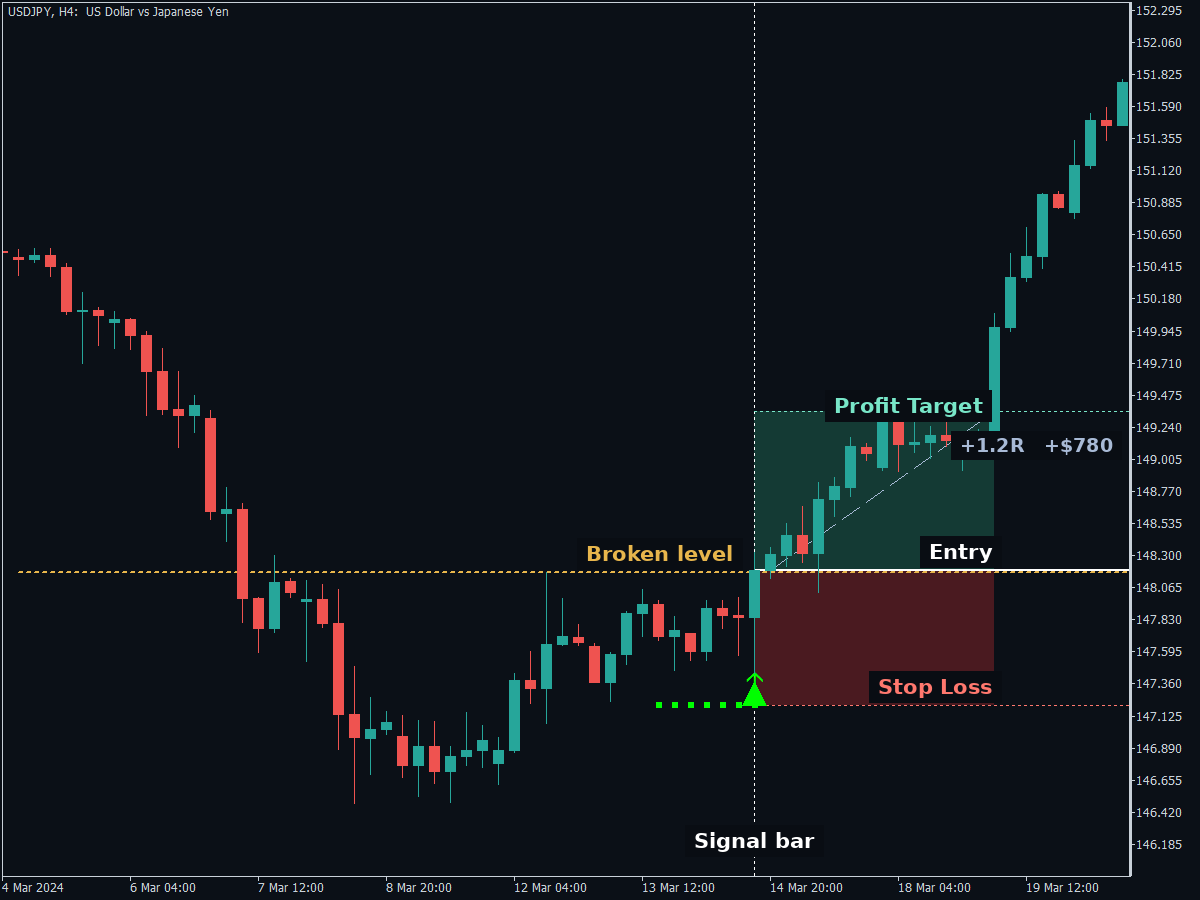
USDJPY H4. A smaller range to break, and the same four rules produce the same shape of trade.
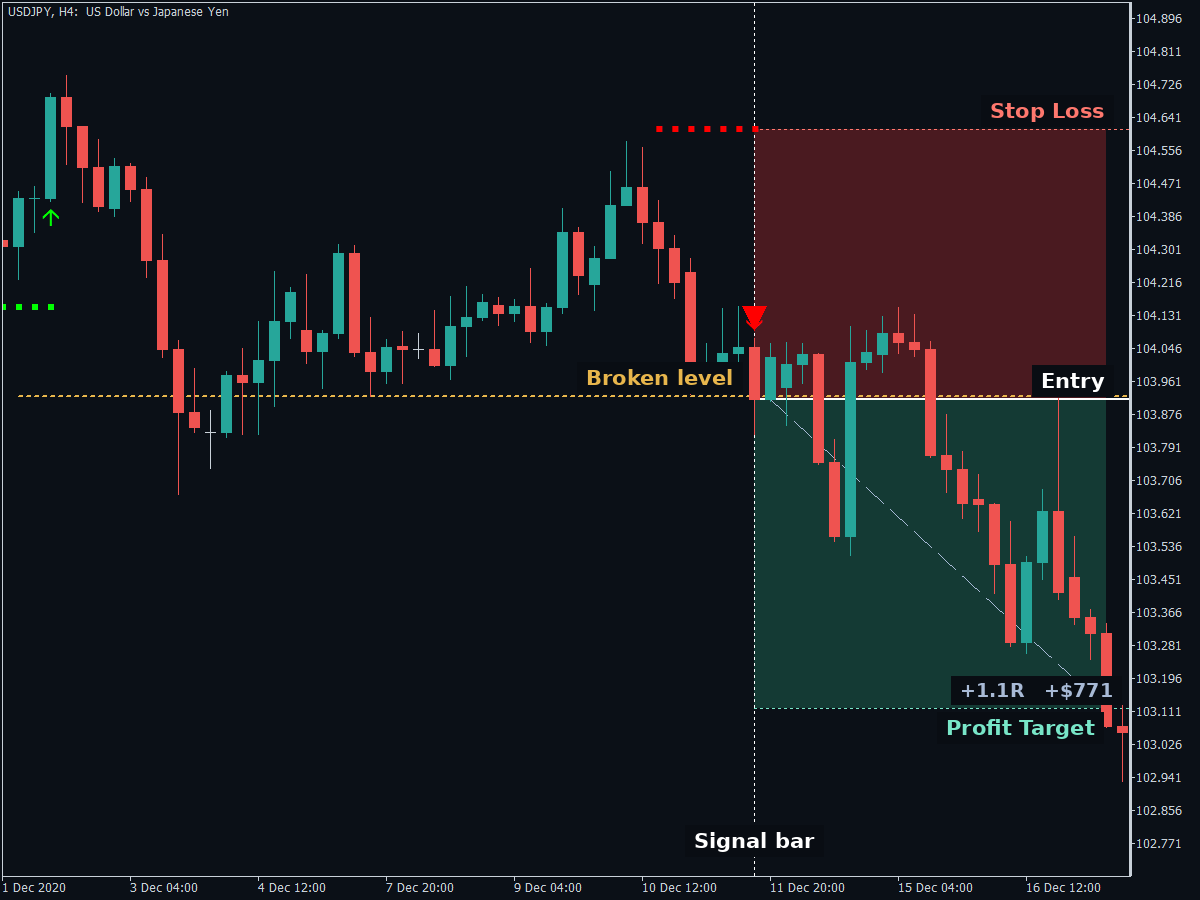
USDJPY H4. The break comes after a failed push higher, and the market spends five days reaching the target.
Each of those follows the same rules: a close beyond the range, a direction that was available, an entry at the next open, the recent swing as the stop, and the final target. Nothing was chosen by eye, and nothing about the market context was used to accept or reject them.
Notice how ordinary the entries look. There is no compression pattern, no retest, no confirming candle and no higher timeframe agreement. The system either has a close beyond the range or it does not.
A Signal That Failed
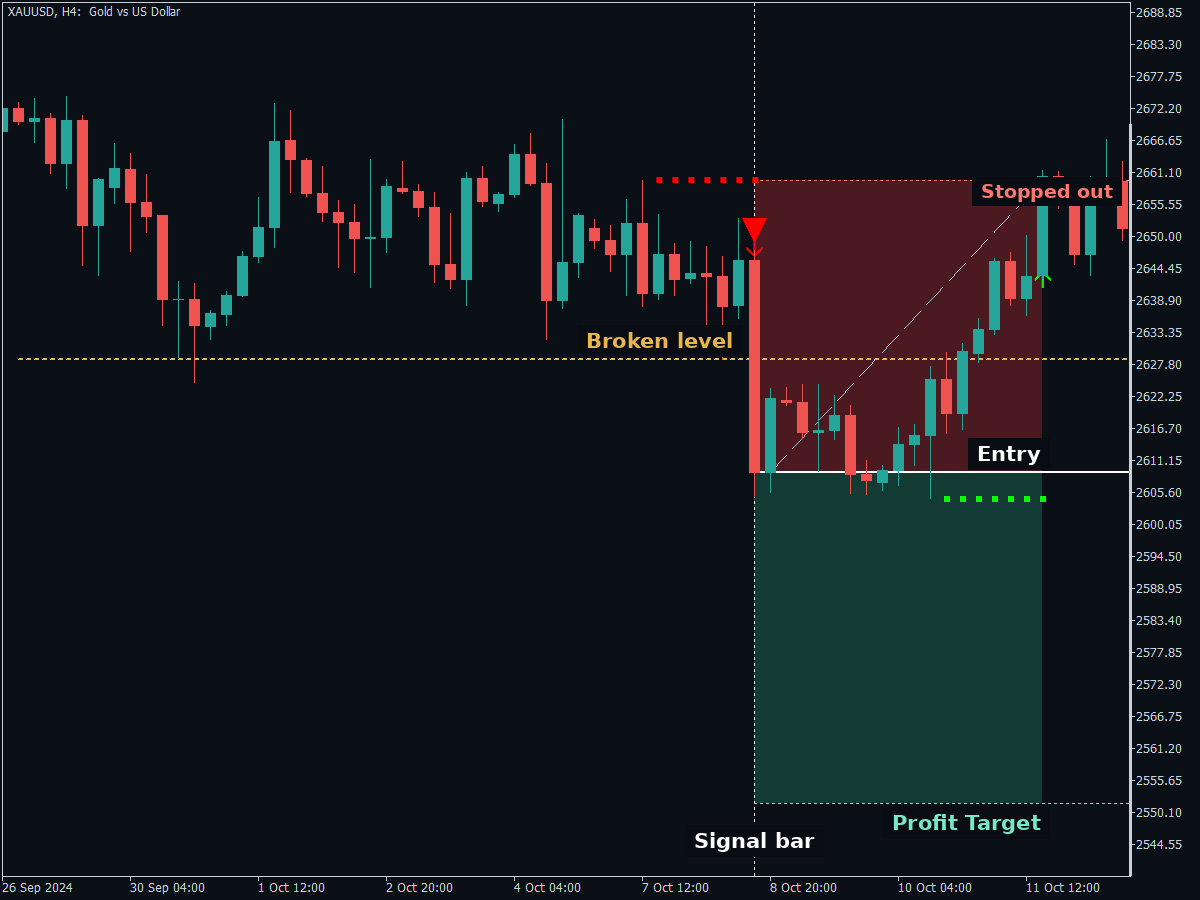
Gold H4. The break was valid, the follow through was absent, and the trade resolved at the stop three days later.
The sell signal was valid, the entry was correct, and the trade was stopped out three days later. Price broke down, turned, and ran back through the recent swing high before it ever approached the target.
That is the failure mode of a close based break: the close is real and the follow through is absent. Nothing in the rule set predicts which of the two you have, which is why the stop is fixed at entry and the position size is a fixed fraction of the balance rather than a judgement about how good the setup looks.
A system that cannot show its losing setups is showing you a filtered sample. The same rule set produced this trade and the four winners.
What the Alternation Rule Costs
None of the pages ranking for this strategy publishes what the alternation rule contributes, because measuring it needs the system built rather than described.
The rule that a buy cannot follow a buy can be switched off in a test and left otherwise identical: same range, same close, same stop, same targets, same instruments, same costs. What comes out is a clean answer on what the rule contributes.
It was measured on five instruments, four major currency pairs and gold, across the indicator’s three targets, which gives fifteen matched comparisons. The comparison was run twice, over 2016 to 2022 and again over 2023 to 2024, so that a single period could not carry the conclusion.
What the direction rule did, in Keenbase testing
- Drawdown was lower with the rule in 13 of the 15 matched comparisons over the earlier period, and in 11 of 15 over the later one.
- Return was mixed: the rule was ahead in 9 of 15 over the earlier period, and taking every break was ahead in 12 of 15 over the later one.
- It removes two thirds to three quarters of the trades, in both periods.
Original Keenbase test data. Real spread, commission and swap, every tick, 1 percent risk per trade. Data through December 2024.
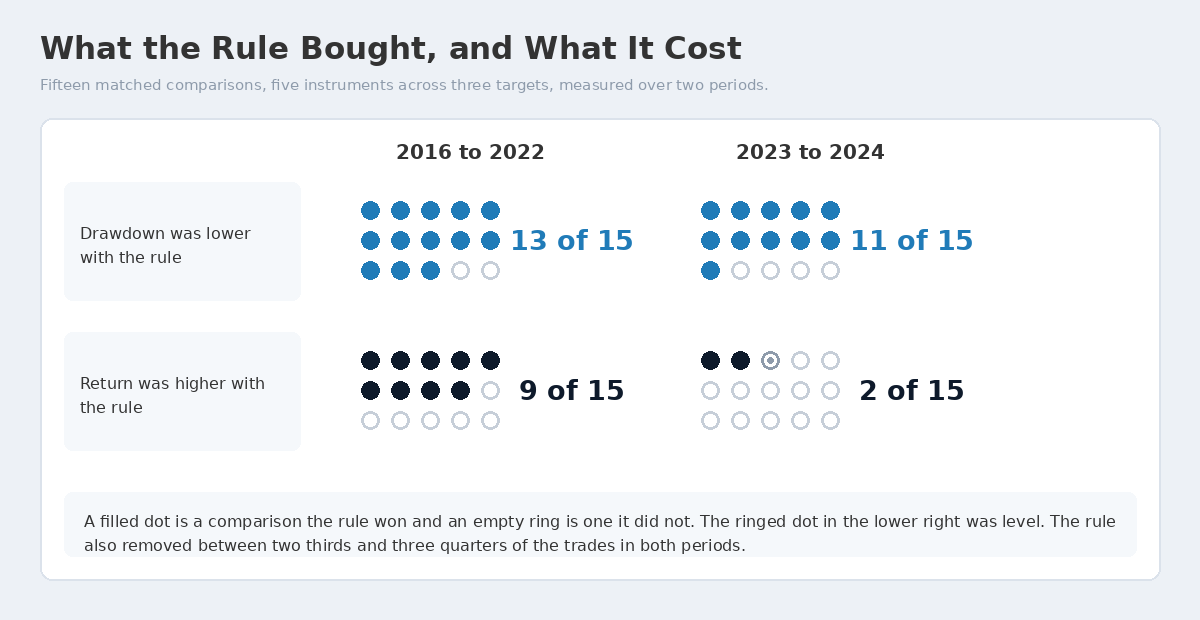
The same fifteen comparisons read twice, once for drawdown and once for return.
The rule buys smoothness and pays for it in return: that is the honest version, and it is the opposite of what a breakout trader expects to hear, since the entries it declines are the continuation entries that feel like the best ones on the chart.
Which of those two you want is not a technical question. An account that stops being traded after a bad month is worth less than a slower one that survives, and a trader who cannot sit through a deep equity dip will not be there when the system recovers.
A High Win Rate Is Not a Result
Take the first target, the quarter of the stop distance, and leave everything else alone.
Across the instruments and settings measured over the later period, it won between 67.8 and 83.7 percent of its trades. Eight of the ten configurations measured on it still finished behind. Over the earlier period the best strike rate anywhere in the work was 80.84 percent, and that one lost money too.
The break even sum is the whole explanation. A target a quarter of the way to the stop needs 80 percent just to stand still, so an 80 percent strike rate is not a good result on that target. It is the break even point, and every cost the platform charges comes out of it.
A win rate is a description of the target you chose, not a measure of the edge you have.
That is worth holding on to beyond this system. Whenever a strategy advertises a high strike rate, the first thing to find is what it risks to make what. If the answer is that it risks four to make one, the strike rate is mostly a property of that target, and it cannot be read without it.
When the Four Hour Candle Actually Closes
MetaTrader builds H4 candles from midnight on the broker’s server clock and steps every four hours, so the candles open at 00:00, 04:00, 08:00, 12:00, 16:00 and 20:00 of that clock. The captures here carry that grid along their time axis.
That is where the eight o’clock candle question comes from, and the answer is that eight o’clock means eight on the server, not eight where you are sitting. A server running GMT+2 or GMT+3 shifts the whole grid against London and New York, and another broker may sit on a different offset again.
Settling it takes ten seconds. Open the H4 chart, read the times along the bottom, and compare one of them with the clock on your own wall. That difference is the gap between your clock and the server’s, and every rule is measured on the server grid.
For the system itself, none of this changes a rule. The signal is a close, and the close happens when the candle ends, whatever the candle is called.
Instruments and Timeframe to Start With
The timeframe: H4, and it is not a variable. The range, the stop and the final target are all measured in candles of that chart. Move the system to M15 and none of them means what it meant.
The instruments: start with the ones that trend. Our support desk has answered this question for years with the same reasoning, that the indicator suits instruments with a higher tendency to trend and break out, and that instruments which mean revert do not suit it.
That is reasoning about the setup rather than a claim about a result. A close beyond a recent high only pays when something follows it, and a market whose habit is to fade the edge of its range gives the break back before the target is reached.
These settings are the ones the indicator ships with. They are the honest starting point, because they are what you see on first load, and a number fitted to history is worth less than one that has not been.
Test It Before You Trade It
None of these rules needs to be taken on trust, and none of them should be.
- Load the H4 chart of one instrument you already follow.
- Load ACB Breakout Arrows, scroll back, and find the first arrow on the chart.
- Take the open of the next candle as the entry, and the stop and the final target exactly where the indicator draws them.
- Walk it forward one signal at a time, recording the outcome and nothing else.
- Do 30 of them before forming any opinion, and keep the ones that stopped out alongside the winners.
Two rules for that record. Alternate the direction the way the system does, or you are testing a different system. And size every trade the same way, because a record where the good setups were bigger tells you about the trader rather than about the rules.
The rules sheet carries the same list on one page, in the order the rules are applied.
Putting the Rules on a Chart
The system is a short list of decisions: where the range is, whether the candle closed beyond it, whether that direction was available, where the invalidation sits, and which of the three targets you take. Everything else on the chart is optional.
| # | Name | Link |
|---|---|---|
| 01 | ACB Breakout Arrows IndicatorDraws the range, marks the close that breaks it, and attaches the stop-loss and all three targets. MT4 and MT5. | Get Indicator |
| 02 | The 4-Hour Range Break Rules SheetEvery rule on this page, on one sheet, in the order it is applied. For beside the chart. | Download PDF |
The rules are the method, and the indicator draws every level they use.
If you are trading it by hand, take the rules sheet, open an H4 chart with the indicator loaded and find the last arrow. Walk forward from there, one signal at a time, and let the record rather than the first trade tell you whether the method suits you.
 Built by the Keenbase Trading Lab
The Keenbase Trading Lab is the research side of Keenbase Trading, where trading systems are designed and tested before anything is published about them.
A method reaches this blog only once it is complete enough to trade without guessing, which is why the rules above are stated in full and every figure on this page comes from a test that was run.
Keenbase Trading has been building MetaTrader indicators and Expert Advisors since 2018, alongside free tools and custom MQL5 development. The systems published here come from the same people who build the indicators that run them.
Market conditions, broker feeds and symbol names vary, so confirm the behaviour on your own account before trading it.