A Pivot Points Forex Trading Strategy
Pivot points in financial markets align with the principles of support and resistance levels that primarily govern all kinds of markets like Forex, Stocks, Commodities, Metals, and Crypto.
To gain a better understanding of Pivot Points Forex trading strategy, one needs to understand the basic concept of support and resistance levels.
Support is a price level where downtrend can be expected to halt due to the accumulation of demand, and Resistance is a price level where uptrend can be expected to end due to accumulation of supply.
Aligned with the same theory, pivot points are the areas where the market is more feasible to change its direction.
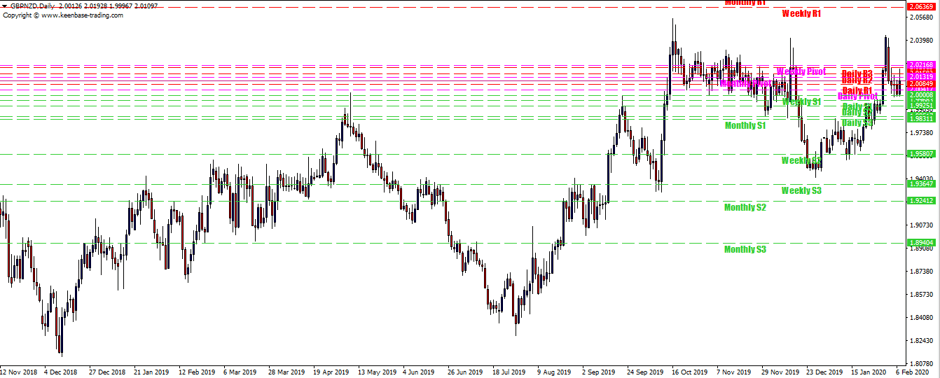
Imagine the markets as one massive room with infinite ceilings and floors(support and resistance levels) where a ball (price) keeps passing through. There are hundreds of these levels across all time-frames.
The most significant advantage with pivot points is that they remove the subjectivity that usually comes with traditional support and resistance levels. Pivot points are calculated using a mathematical formula.
A custom indicator can be efficiently coded, which can automatically draw the pivot levels based on a pivot calculation formula.
Luckily, we already have a Pivot points indicator for Metatrader that draws the Daily, Weekly, and Monthly pivot levels using the classic pivot formula. It is beneficial for day traders as well as for positional traders.
The KT Pivot Levels indicator allows full customization from colors to width and also provides alerts when price touches a pivot level.
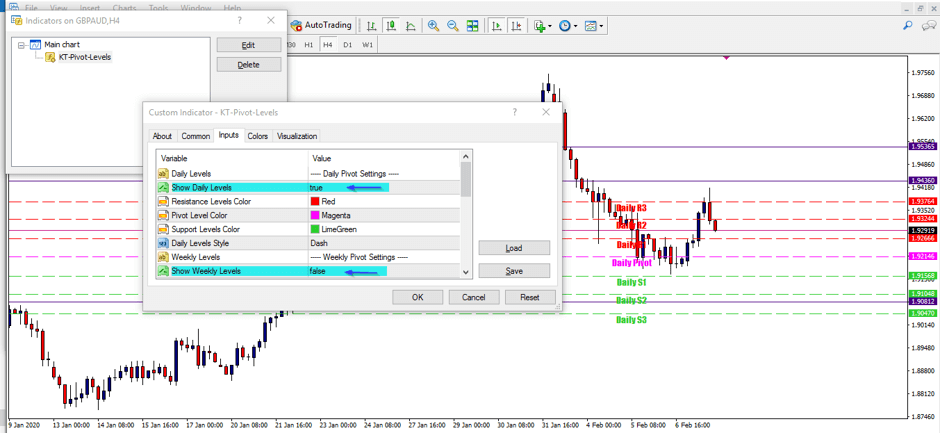
In the below picture, the indicator is configured to display only Daily pivot levels:
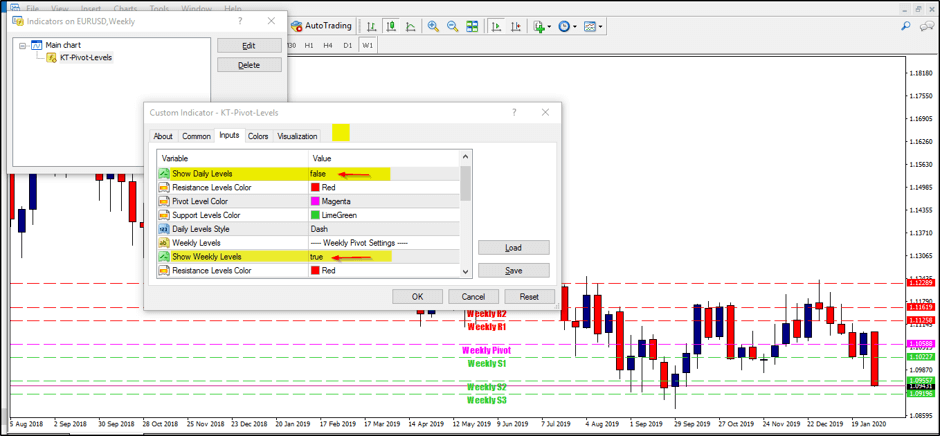
Below, the indicator is configured to display only Weekly pivot levels:
Understanding the Pivot Points in more detail
It's useful to know about the mathematical calculation behind the pivot points. Pivots are mostly calculated using the end of the day data (end of the New York session in FX). Pivots consist of the main pivot level along with the three support and resistance levels in both directions.
There are various pivot calculation methods available, like Woodie pivots, Camarilla pivots, and Fibonacci pivots. The calculation formula requires the four data values(OHLC) to calculate the pivot points.
- Daily Pivots = OHLC data from daily time-frame.
- Weekly Pivots = OHLC data from weekly time-frame.
- Monthly Pivots = OHLC data from monthly pivots.
Pivot Calculation Formula
There are several formulas exist to calculate the pivot points. The most common method is averaging the High(H), Low(L), Close(C), and Open(O).
- P(Pivot level) = P = (O + H + L + C) / 4
- R1 = P + (P − L) = 2×P − L
- R2 = P + (H − L)
- R3 = H + 2×(P − L) = R1 + (H − L)
- S1 = P − (H − P) = 2×P − H
- S2 = P − (H − L)
- S3 = L − 2×(H − P) = S1 − (H − L)
One of the main advantages of pivots points is that they provide a clear representation of the intrinsic market structure. The market usually reacts to the pivot points in a very similar way.
Apart from providing a clear roadmap to the entries and exits, pivot points also help to decide the stop-loss and take-profit for trade.
Predicting the turning points in market
Traders and speculators attempt to predict the turning points in the market with varying degrees of success. In technical analysis, there shouldn't be a sole dependency on a single tool, and pivots are no exception.
No doubt, pivots provide an excellent method to see the market structure. However, it is not recommended to use the pivots as a standalone tool. Price action and other tools should be used along with the pivots to carry out a robust analysis. For example, the use of indicators like RSI, Moving averages, Fibonacci extensions can be combined with pivots.
Combining the Pivot Points Forex Trading Strategy with RSI
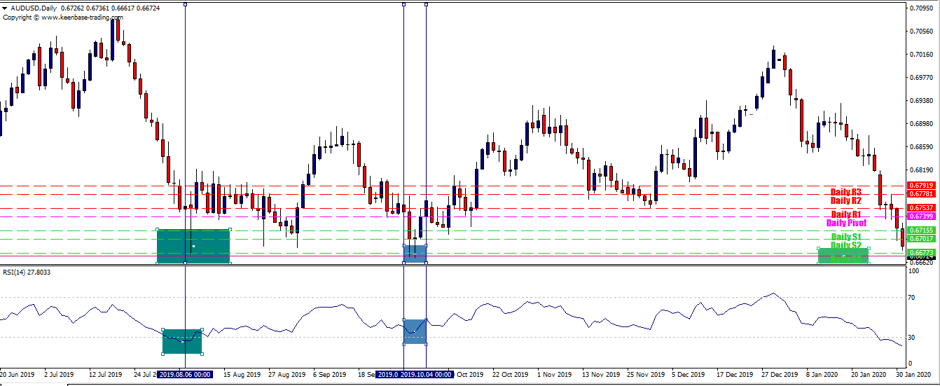
To have a more clear picture, we've combined the pivot points with the Relative Strength Index(RSI) oscillator. Looking at the AUDUSD on the Daily time-frame, the price has crossed below the S2, and RSI also peaked below the 30 (oversold level). This arrangement indicates a strong downtrend that need some correction before continuing to the trend direction.
On 7th August 2019, there is a sharp pin bar formed rejecting the S3(0.66773). Although it can be considered as a strong reversal signal, the overall momentum was still bearish, so we should be more careful. Any upside movement can be a correction rather than a reversal.
Almost two months later, the price again reached to the S3 level. The pin bar formation occurs again, rejecting the S3, and RSI shows a divergence rejecting the oversold zone. All these signs are indicating the losing bearish momentum with a clear clue of upcoming reversal to the upside.
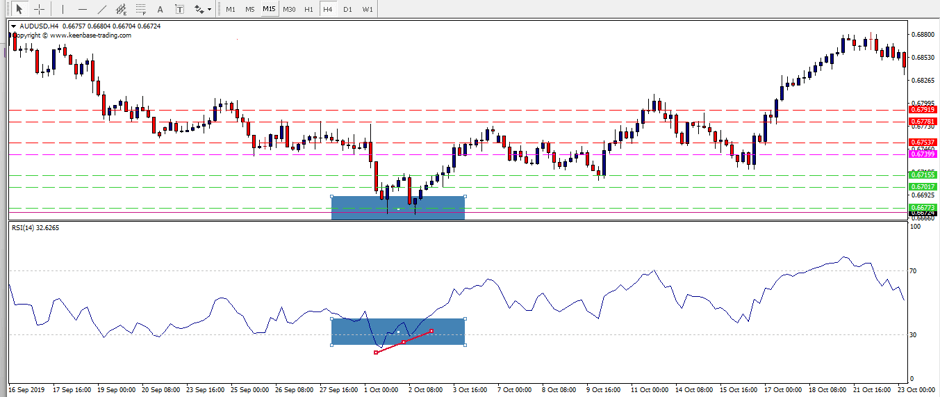
As expected, the price reversed upside 260 pips from the S3. The Resistance levels R1-R3 can be used to set the profit targets, and Support levels S1-S3 can be used to set the stop-loss.
Many other setups and combinations can be used with the Pivot points trading strategy. It is more practical to observe the price reaction around a pivot level. If the price action and other indicators also show a sign of reversal, it is more likely to occur.
