
BOS vs CHoCH: Break of Structure vs Change of Character Explained
A break of structure (BOS) happens when a candle closes beyond the last swing point in the direction the market is already moving. A change of character (CHoCH) is the first close beyond a swing point against that direction. A BOS says the trend continued. A CHoCH says the trend may be turning its direction.
That is the usual definition. What it leaves open is which swing point counts for a CHoCH, and that choice changes how often the next break agrees with the label.
We measured it on six markets. When a CHoCH was marked on the nearest swing, the next break agreed with it about half the time. When it was marked on the swing the last BOS came from, the next break agreed with it about 7 times in 10.
How often the next break agreed with a CHoCH
Any close beyond the most recent swing point.
Only a close beyond the swing the last BOS came from.
The black mark is 50%. Six markets on M15, H1 and H4 in MetaTrader 5, breaks counted on a candle close.
BOS and CHoCH on One Chart
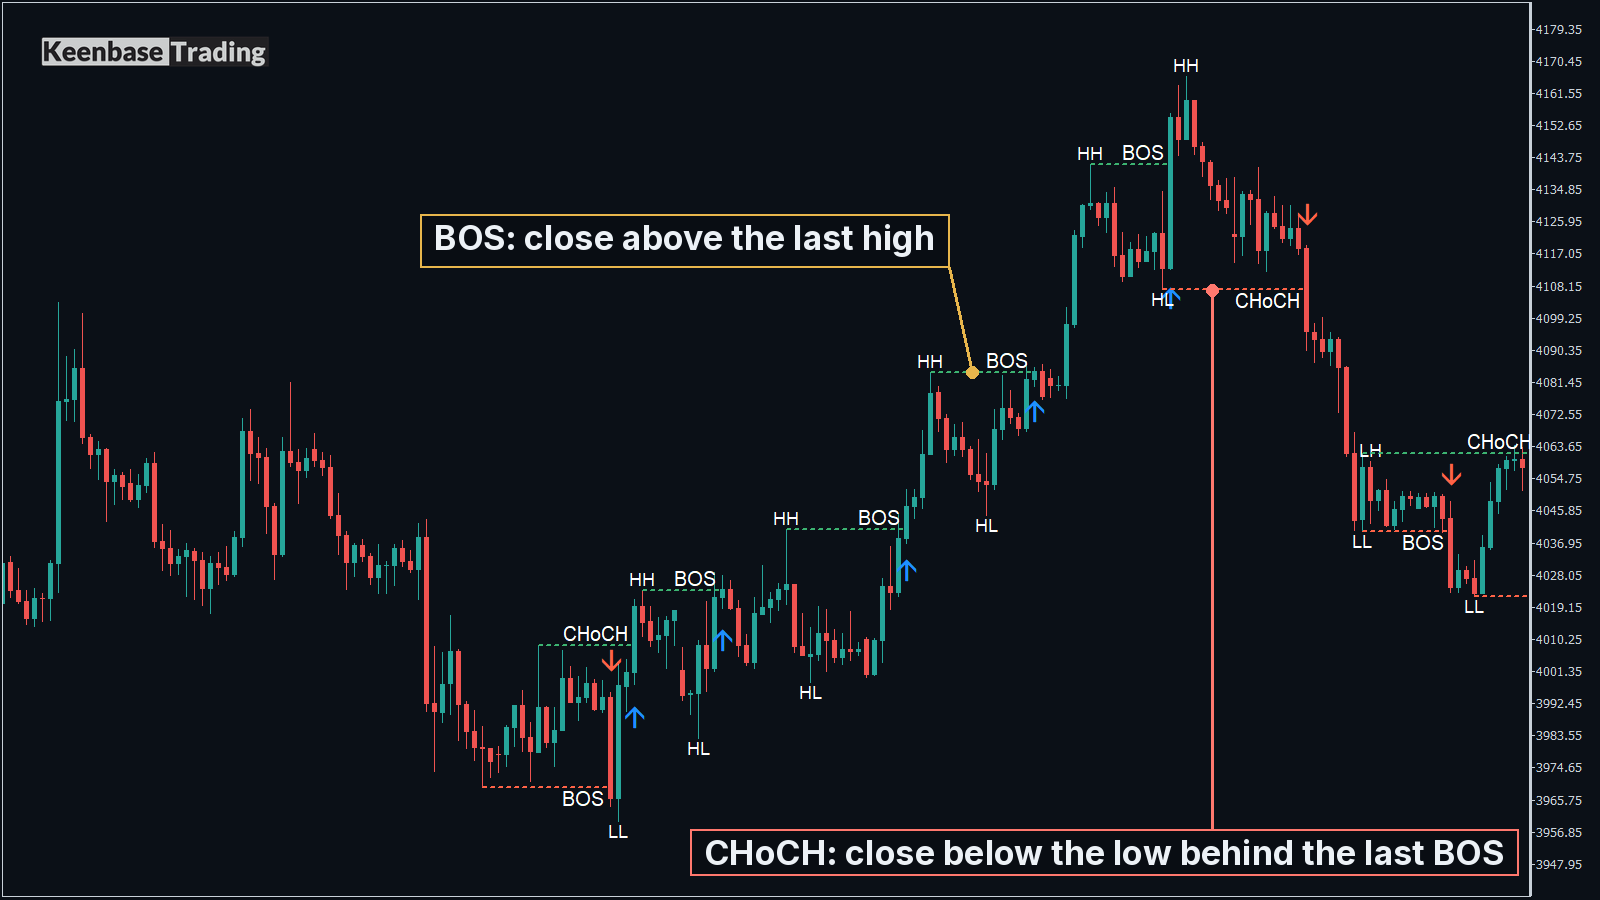
Market structure is the sequence of swing highs and swing lows on a chart. A swing high is a peak with lower highs on both sides of it. A swing low is a dip with higher lows on both sides of it.
In an uptrend, price makes a higher high (HH), pulls back to a higher low (HL), and then closes above the previous high. That close is a bullish break of structure. A downtrend is the mirror: lower highs (LH), lower lows (LL), and a bearish BOS each time a candle closes below the previous low.
A change of character is the first break the other way. In an uptrend it is a close below a swing low. From that candle the structure is read as bearish, and the next close below a new swing low is a bearish BOS.
So the same close gets a different name depending on the direction the market had before it.
| The candle closes | In an uptrend it is | In a downtrend it is |
|---|---|---|
| Above a swing high | Bullish BOS | Bullish CHoCH |
| Below a swing low | Bearish CHoCH | Bearish BOS |
Which Swing Has to Break for a CHoCH
Two different rules are in use for a CHoCH, and they draw different charts.
Nearest swing: any close below the most recent swing low in an uptrend is a CHoCH. Small pullbacks leave small swing lows, so this rule fires often.
Origin swing: only one low counts, and it is the low the last BOS came from. In an uptrend that is the lowest point between the high that was broken and the candle that broke it. Until a candle closes below that low, the uptrend is intact, however many small lows break on the way.
We ran both rules over the same candles: EURUSD, GBPUSD, USDJPY, gold, US30 and US500, on M15, H1 and H4, close to four years of price history from one broker. After every CHoCH we looked at the next structure break. A BOS in the new direction confirmed the CHoCH. A CHoCH back the other way meant it had failed.
| CHoCH marked on | Confirmed on M15 | Confirmed on H1 | Confirmed on H4 |
|---|---|---|---|
| Nearest swing | 48.4% | 52.7% | 47.8% |
| Origin swing | 69.3% | 70.7% | 75.3% |
The nearest swing rule was close to a coin toss on every timeframe. With a candle close, the origin swing rule was confirmed 68% to 75% of the time across every swing size and timeframe we tried. On each of the six markets taken alone it was between 67% and 73%.
It also printed far fewer labels. On M15 the origin swing rule marked 7,752 CHoCH where the nearest swing rule marked 13,775, which is 44% fewer. The breaks of small lows inside a trend stopped counting. The H1 figure rests on 1,927 CHoCH and the H4 figure on 463.
The higher confirmation rate has one limit. Under the origin swing rule, the level that would cancel a new CHoCH sits at the far end of the whole previous move, so it is further away than the level that would confirm it. Part of the higher rate comes from that distance.
The figure says the reading of direction is steadier. It does not say that a trade opened at the CHoCH makes money.
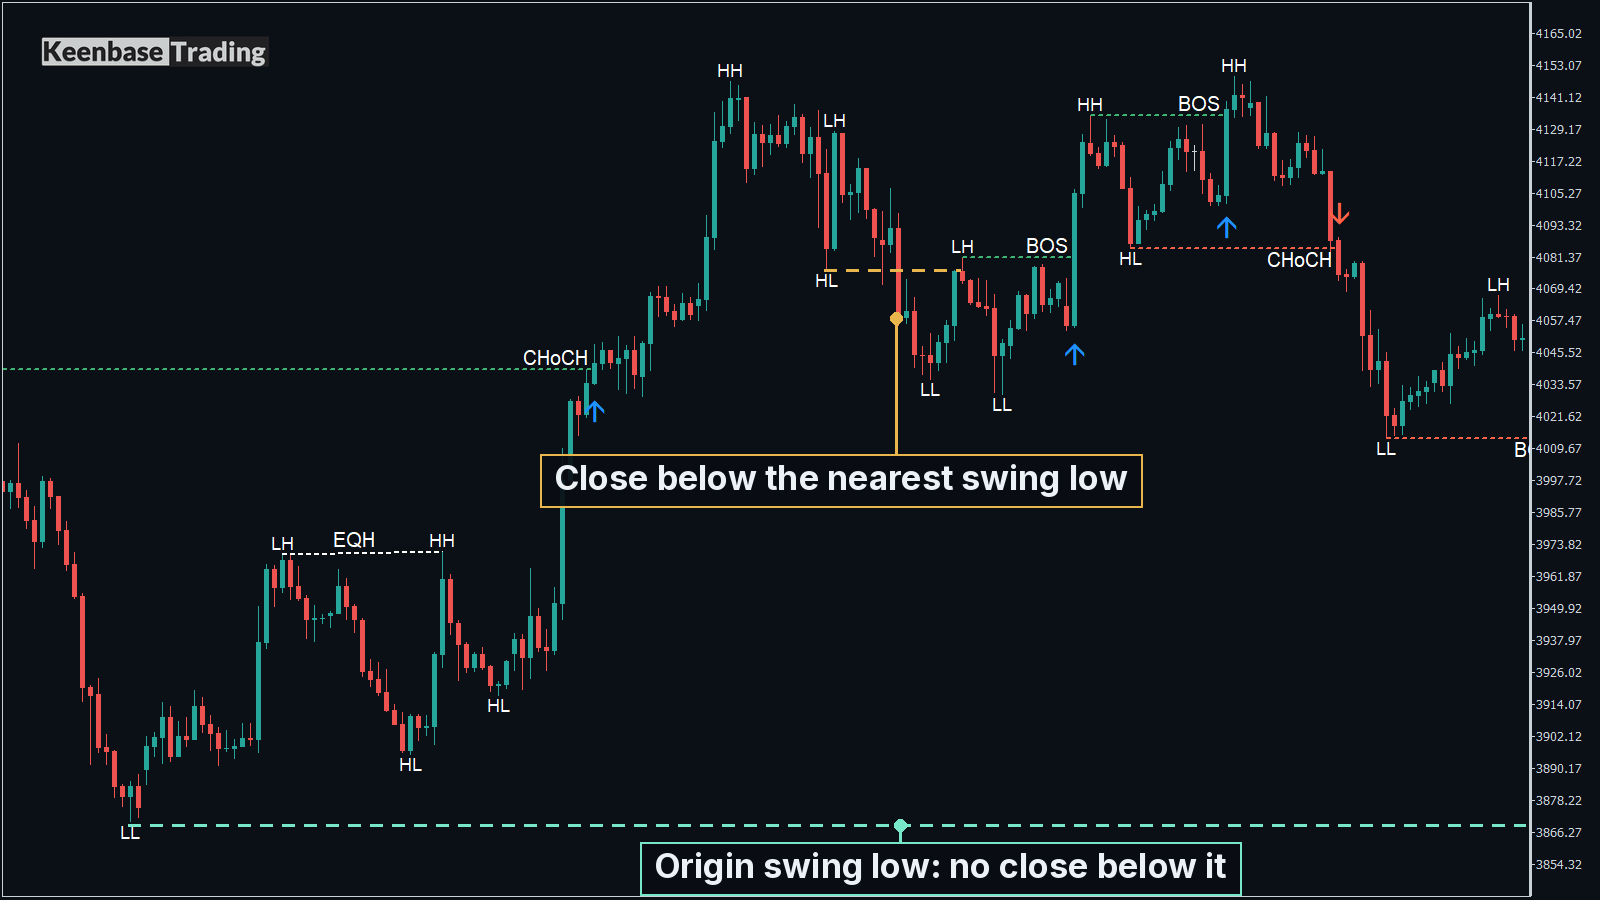
Here is the origin swing rule playing out candle by candle on a falling gold H1 chart: a bounce closes above a small high, and the CHoCH waits for the high the last BOS came from.
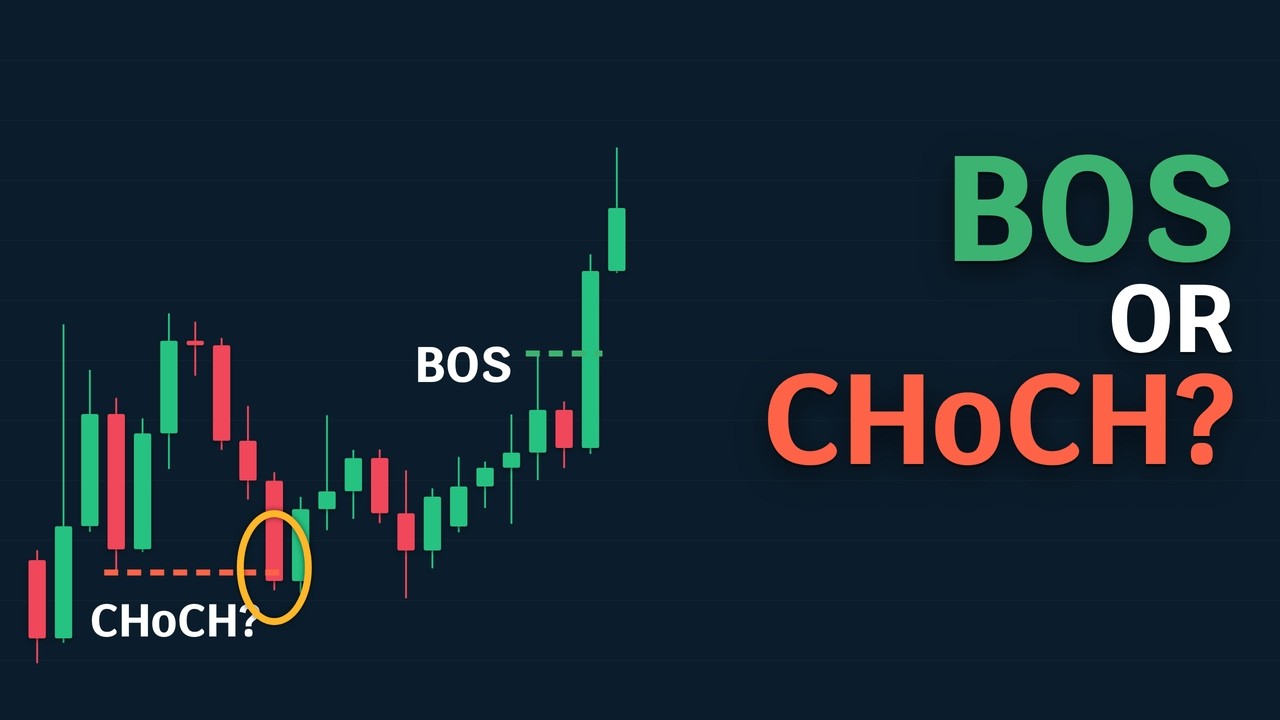
Why the Break Has to Be a Candle Close
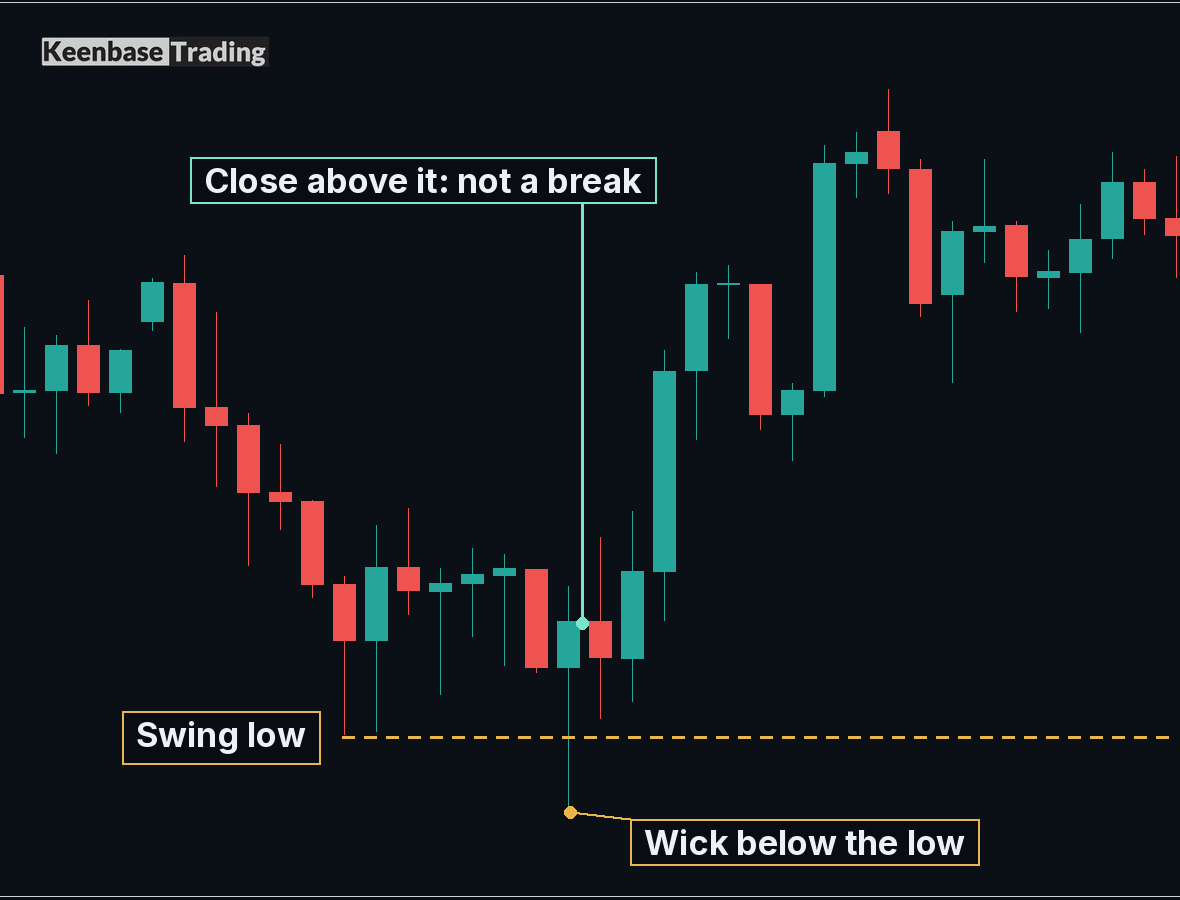
A wick through a level and a close through it are different events. A wick shows that price traded there for a moment. A close shows that price was still there when the candle finished.
Counting a wick as a break is the second way a chart fills with labels. With the origin swing rule on M15, counting wicks printed 12,580 CHoCH against 7,752 for counting closes, which is 62% more. Labels counted on a wick were confirmed less often.
| Break counted on | CHoCH confirmed, M15 | CHoCH confirmed, H1 | CHoCH confirmed, H4 |
|---|---|---|---|
| Candle close | 69.3% | 70.7% | 75.3% |
| Wick | 58.7% | 60.1% | 65.0% |
The same holds for a BOS. After a BOS counted on a close, the next break was another BOS 53% to 59% of the time. After a BOS counted on a wick, it was 45% to 51%.
The cost of the close rule is time. The label arrives when the candle finishes, not when price first touches the level, and on H4 that can be hours later.
How the Swing Size Changes the Number of Labels
Every swing rule needs a size: how many candles on each side of a high must be lower before it counts as a swing high. A size of 3 marks small swings. A size of 10 marks only the large ones.
| Swing size, candles each side | CHoCH on M15 | Confirmed | Candles from one CHoCH to the next |
|---|---|---|---|
| 3 | 10,998 | 69.7% | 39 |
| 5 | 7,752 | 69.3% | 57 |
| 10 | 4,719 | 68.3% | 92 |
A larger swing size did not make a CHoCH more reliable in our data. It made it rarer. The confirmation rate stayed within two points while the number of labels fell by more than half.
So the swing size is a choice about how often you want the structure to change, not about accuracy. The gap between two CHoCH was also almost the same on M15, H1 and H4 when counted in candles: about 55 to 58 candles at a size of 5. On M15 that is roughly 14 hours of trading, and on H1 a little over two days.
What Usually Follows a CHoCH
After a CHoCH the structure points the other way until the next CHoCH. We call that stretch a trend, and most trends are short. We counted how many BOS each of 1,921 trends printed, with the origin swing rule on H1.
Share of 1,921 trends on H1, by the number of BOS before the next CHoCH.
About 6 trends in 10 ended with no BOS or exactly one. About 1 in 8 ran to four or more. M15 gave almost the same split, and H4 had slightly more long trends, 16.6% with four or more.
A CHoCH tells you which side the structure is on now. It does not tell you how far the move will go, and it is not a trade signal by itself. Where to enter, where the stop loss goes and where to take profit are separate decisions that these numbers do not cover.
Marking BOS and CHoCH Automatically in MT4 and MT5
All of these figures come from a plain swing rule run over raw candles, not from an indicator, so they describe how the two rules behave in general.
Marking the origin swing by hand is slow work. For every break you find the high that was broken, then the lowest low before the breaking candle, then wait for a close, on every chart and timeframe you follow.
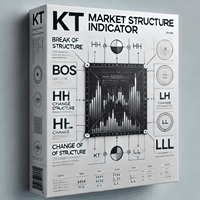
KT Market Structure Indicator does that marking in MetaTrader 4 and MetaTrader 5. It draws BOS and CHoCH lines, equal highs and equal lows, and the HH, HL, LH and LL swing labels, and it decides every one of them on a closed candle.
CHoCH Mode: the indicator offers both rules. Origin Swing is the default and marks a CHoCH only when the swing behind the last BOS breaks. Nearest Swing marks a CHoCH on the most recent swing.
Structure Strength Magnitude: this input is the swing size. A higher value marks fewer and larger structures, and a lower value marks more of them.
Alerts: when the candle of a BOS or a CHoCH closes, the indicator can send a pop-up, a sound, a push notification to your phone or an email.
Four Checks for Reading a CHoCH
- Which swing broke: on the swing the last BOS came from, the next break agreed with the CHoCH about 7 times in 10. On the nearest swing it was about half.
- How it broke: a wick through the level is not a break. Counting wicks printed 62% more CHoCH on M15, and they were confirmed about 10 points less often.
- Which swing size is on the chart: the size changes how often a CHoCH prints, from 39 candles apart at a size of 3 to 92 at a size of 10. It did not change how often a CHoCH was confirmed.
- How far to expect it to go: about 6 trends in 10 printed one BOS or none before the next CHoCH, and about 1 in 8 printed four or more.
KT Market Structure Indicator marks BOS and CHoCH on closed candles in MT4 and MT5, with the origin swing rule as its default.
Mark BOS and CHoCH on your chart with KT Market Structure Indicator
About this article
Published by Keenbase Trading, which has been trading since 2018 and builds MT4 and MT5 indicators, Expert Advisors, free trading tools and custom MetaTrader development.
Price history differs between brokers, so check the numbers on your own chart before you rely on them.